Boeing’s Financial Gains and Green Goals Take Flight in Q1 2025

Boeing's Financial Gains and Green Goals Take Flight in Q1 2025

Boeing, one of the world’s largest aerospace manufacturers, shared its first quarter (Q1) 2025 financial results this week, revealing signs of improvement despite continued challenges. Meanwhile, the company reaffirmed its commitment to the environment. Boeing has long-term plans to cut emissions toward net zero and promote sustainability in aviation.

Let’s look at how the company performs this quarter and its carbon emission reduction strategy. 

Earnings on the Ascent: Boeing Narrows Its Losses

In Q1 2025, Boeing reported a loss of 49 cents per share. While still a loss, this was an improvement from the $1.13 per share loss reported in the same quarter of 2024. The company’s total revenue rose 18%, reaching nearly $19.5 billion

Analysts expected a loss of $1.18 per share and revenue of $19.38 billion. So, these results came as a positive surprise for investors.

Boeing’s CEO, Kelly Ortberg, noted that the company is beginning to see improvements in its operations due to a focus on safety and quality. He noted that,

“We are seeing early positive results and remain committed to making the fundamental changes needed to fully recover.” 

Commercial airplane revenue grew significantly, increasing 75% to $8.15 billion. Boeing delivered 130 commercial aircraft during the quarter, a 57% increase compared to the same period last year. Part of this growth came from the company ramping up production after the previous year’s temporary grounding of its 737-9 aircraft.

The company aims to produce 38 of its 737 jets per month by the end of 2025. The 787 production line, which had stabilized at 5 jets per month earlier this year, could rise to 7 per month later in the year. 

Boeing’s 777X program is now in an important testing phase with the FAA. The first delivery of the 777-9 is set for 2026.

Boeing Q1 2025 performance
Source: AlphaStreet

Jet Set: Orders Fly In as Production Ramps Up

Boeing secured 221 net commercial airplane orders during Q1, including:

  • 20 777-9 jets
  • 20 787-10 jets
  • 50 737-8 jets

This strong order activity boosted the company’s commercial backlog to over 5,600 aircraft, with a total value of about $460 billion.

In terms of cash flow, Boeing reported a free cash outflow of $2.29 billion. While still negative, it is better than the $3.93 billion outflow from the same period last year.

Boeing made headlines when President Trump chose them in March to build the new F-47 sixth-generation fighter jet. This decision replaced Lockheed Martin in this important role. This deal, however, is not yet included in the backlog figures.

Cash and Core: Boeing Sells Digital Unit for $10.6B Boost

In a significant move, Boeing announced a $10.55 billion all-cash deal with Thoma Bravo, a private equity firm. The agreement includes the sale of the company’s Digital Aviation Solutions business, which contains several key software platforms: Jeppesen, ForeFlight, AerData, and OzRunways.

Boeing plans to keep the parts of its digital business that provide aircraft and fleet data for both commercial and defense customers. These tools support diagnostics, maintenance, and repair services.

Following this news and the Q1 earnings release, Boeing’s stock rose by 6% on Wednesday. The company’s shares have recovered from earlier losses in April and are now down less than 3% for the year.

Boeing stock price
Source: XTB.com

Flying Green: Boeing’s Net Zero Strategy 

Beyond its financial performance, Boeing continues to push forward with environmental initiatives. The company has taken many steps to cut its carbon footprint worldwide to reach net-zero emissions.

In 2023, Boeing reached net-zero carbon emissions for the fourth year in a row. This includes Scope 1 and Scope 2 emissions, along with some Scope 3 emissions like business travel. It achieved this through a mix of energy efficiency upgrades, expanded use of renewable energy, and certified carbon offsets.

At its major manufacturing sites—known as Core Metric Sites—Boeing closely monitors emissions and energy use. These locations represent 70% of the company’s total operational emissions.

Boeing verifies its data using utility bills and third-party assessments. This helps ensure transparency and accuracy.

The company’s strategy follows an “Avoid First, Remove Second” approach:

  • Avoid emissions by improving efficiency and switching to renewable energy, such as sustainable aviation fuel (SAF).
  • Remove remaining emissions through permanent carbon removal solutions and offsets.

Boeing also aims to reduce its use of offsets by 2024, especially for Scope 1 and Scope 2 emissions. However, offsets will continue to play a role for Scope 3 emissions, such as business travel, and in supporting voluntary carbon markets.

Cascade: A Tool for Industry-Wide Impact

In May 2023, Boeing introduced the Cascade Climate Impact Model as part of its net zero roadmap. Cascade is a data-based tool designed to help reduce emissions across the aviation industry. It shows how different strategies can reduce emissions. For example, replacing older planes with newer, efficient ones or optimizing flight paths can help.

Cascade also looks at the use of SAF, aircraft innovation, and market-based mechanisms. It is publicly available and backed by partners like NASA, IATA (the International Air Transport Association), and universities.

Boeing works with these partners to improve the tool and make it more useful for the aviation industry. The company is using these five ways to help the industry decarbonize. 

Boeing plan to decarbonize aerospace
Source: Boeing

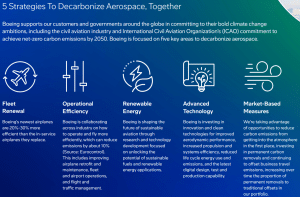
The company also teamed up with Norsk e-Fuel to build one of Europe’s first big Power-to-Liquids (PtL) plants in Mosjøen, Norway. This collaboration will create sustainable aviation fuel (SAF). It combines green hydrogen with captured CO₂ to produce electro-SAF (e-SAF).

The initiative supports the EU’s RefuelEU targets, aiming for 6% SAF use by 2030 and 70% by 2050, with specific goals for e-SAF. Boeing’s investment accelerates SAF production, contributing to aviation’s net-zero emissions goal by 2050. ​

Boeing is sharing tools like Cascade and promoting sustainable aviation fuels. This helps the industry work towards its goal of net-zero emissions by 2050.

Flight Path Forward

Boeing’s Q1 2025 performance suggests progress in its efforts to recover financially. At the same time, its environmental strategy reflects a long-term commitment to making air travel more sustainable.

Boeing faces a growing backlog of orders and has major aircraft development programs in progress. The company is also investing in renewable energy and innovation. These steps aim not just to return to profits but to lead the aviation industry toward cleaner and greener skies.

The post Boeing’s Financial Gains and Green Goals Take Flight in Q1 2025 appeared first on Carbon Credits.

Alphabet Smashes Q1 2025 Expectations with Strong Growth But Emissions Are Rising

Alphabet, Google’s parent company, kicked off 2025 with a solid earnings report. Despite global economic concerns and trade tensions, the company beat analyst expectations across the board. Its core businesses—Search, YouTube, and Cloud continued to grow, showing strong momentum and revenue. However, with a massive upgrade in AI infrastructure, emissions have risen. Can Google still meet its net-zero target?

Alphabet’s Revenue Jumps Amid Economic Uncertainty

Alphabet reported $90.2 billion in revenue for the first quarter. That’s a 12% increase from $80.5 billion in Q1 2024. Analysts had expected $89.2 billion. Net income came in at $34.54 billion, up 46% from $23.66 billion a year ago.

Earnings per share (EPS) hit $2.81, far above the expected $2.01. Operating income rose 20% to $30.6 billion. Plus, the company’s operating margin expanded to 34%, which is higher than last year.

CEO Sundar Pichai, confirmed by saying,

“We’re pleased with our strong Q1 results, which reflect healthy growth and momentum across the business. Underpinning this growth is our unique full-stack approach to AI. This quarter was super exciting as we rolled out Gemini 2.5, our most intelligent AI model, which is achieving breakthroughs in performance and is an extraordinary foundation for our future innovation. Search saw continued strong growth, boosted by the engagement we’re seeing with features like AI Overviews, which now has 1.5 billion users per month. Driven by YouTube and Google One, we surpassed 270 million paid subscriptions. And Cloud grew rapidly with significant demand for our solutions.”

Google Search, YouTube, and Cloud Drive Growth

Google Search brought in $50.7 billion in revenue. YouTube ads earned $8.93 billion, up from $8.09 billion a year earlier. Google Services, which includes Search, YouTube, subscriptions, and device sales, generated $77.3 billion—a 10% increase from last year.

Meanwhile, Google Cloud stood out. The cloud business earned $12.3 billion, growing 28% from $9.57 billion in Q1 2024. This growth was fueled by demand for Google Cloud Platform, AI infrastructure, and generative AI tools.

Alphabet earnings
Source: Alphabet

Shareholders Win Big

Alphabet didn’t just report big profits, it also rewarded investors. The board approved a massive $70 billion stock buyback plan. In addition, the company raised its quarterly dividend by 5% to $0.21 per share.

Right after the earnings release, Alphabet’s stock jumped 5% in after-hours trading. Shares hit $169, the highest level in four weeks.

AI Still the Focus Despite Trade Tensions

Even with rising costs and trade tensions between the U.S. and China, Alphabet is staying aggressive. The company confirmed it will stick to its $75 billion capital spending plan for 2025. A large portion of that will support AI infrastructure and data centers.

Analysts have raised concerns about Big Tech pulling back on data center projects. But Alphabet and its peers, like Meta and Amazon, remain committed, giving AI investment a top priority.

For now, Alphabet shows strong growth for the rest of the year.

Google’s Emissions Are Rising, Not Falling

Google aims to hit net-zero emissions across its operations and supply chain by 2030. The company is leaning on two major strategies: cutting emissions in all possible areas and removing the remaining emissions through carbon removal.

In 2023, Google’s total greenhouse gas (GHG) emissions hit 14.3 million metric tons of CO₂ equivalent. That’s a 13% jump from 2022. While the growth slowed compared to past years, the trend still moved in the wrong direction. Most of the rise came from higher energy use at data centers and emissions from its supply chain.

Scope Emissions

  • Scope 1 (direct) emissions: 79,400 tCO₂e (1% of total)
  • Scope 2 (indirect from electricity): 3.4 million tCO₂e (24%)
  • Scope 3 (supply chain and other indirect emissions): 10.8 million tCO₂e (75%)
alphabet google emissions
Source: Google

Although Google has made progress, its emissions increased in 2023, highlighting the challenge of scaling digital services while reducing carbon emissions. Especially with the unpredictable energy demands of artificial intelligence (AI).

Google’s Roadmap to a Net-Zero Future

Google aims to cut its emissions by 50% by 2030 using 2019 as the baseline. However, after updating how it measures emissions, the company now reports a 48% rise from 2019.

google alphabet
Source: Alphabet

Renewable Energy

Google has run on 100% renewable energy for seven years straight. But under current standards, this hasn’t cut its market-based Scope 2 emissions. Its new goal is to run all operations on 24/7 carbon-free energy (CFE) by 2030. In 2023, it hit 64% CFE globally.

google renewable energy Alphabet
Source: Alphabet

Energy Efficient Data Centers

Google’s data centers are 1.8 times more energy efficient than typical enterprise setups. In 2023, its average Power Usage Effectiveness (PUE) was 1.10, well below the industry average of 1.58.

Another example is its AI hardware, TPU v4 chips, which are 2.7 times more efficient than their predecessors.

Using AI to Slash Emissions

Furthermore, it is developing tools to reduce the energy needed to train AI models by up to 100 times. They can slash emissions by as much as 1,000 times.

Their Gemini 1.5 Pro model delivers performance similar to Gemini 1.0 Ultra but with far less computing power. Google is also guiding software developers through its “Go Green Software” initiative to shrink their environmental impact.

Practical examples of AI in action include:

  • Fuel-efficient navigation, cutting 2.9 million metric tons of emissions since 2021.
  • Flood forecasting tools are used in over 80 countries.
  • The Green Light initiative is to optimize traffic signals.

Google is also building AI-powered systems to predict extreme heat, detect cool roofs, and track methane leaks. These tools show how AI can play a key role in solving environmental problems.

Betting Big on Carbon Removal Credits

Google knows how important it is to remove residual emissions to hit its net-zero target. That’s where carbon removal and high-quality carbon removal credits are immensely useful.

  • In 2022, it pledged $200 million to Frontier, an initiative to boost carbon removal technologies by committing to buy future credits.
  • Signed deals with Charm Industrial, Lithos Carbon, and CarbonCapture through Frontier. These deals represent about 62,500 metric tons of carbon removal credits to be delivered by 2030.
  • Joined a U.S. Department of Energy program to match carbon removal purchases, aiming to lock in at least $35 million worth of credits within a year.

Nature-Based Solutions

Furthermore, Google has also invested in nature-based removals. To support carbon credit markets, it gave more than $7 million in grants to organizations like The Gold Standard and ICVCM.

google alphabet
Source: Alphabet

Google’s large-scale commitments are:

  • Purchased 200,000 tons of removal credits from Terradot, which uses enhanced rock weathering.
  • Bought 50,000 tons from Brazilian startup Mombak, which is focused on reforestation in the Amazon.
  • A partnership with Holocene to capture 100,000 tons of CO₂ by 2032.

These investments reflect its transition from short-term carbon neutrality and focusing on long-term carbon removal solutions.

Google’s environmental efforts show its huge strides in clean energy and AI-driven efficiency. Yet emissions are still rising. As 2030 approaches, the big question is, can Google truly deliver on its net-zero promise while expanding its tech empire? Only time will tell.

The post Alphabet Smashes Q1 2025 Expectations with Strong Growth But Emissions Are Rising appeared first on Carbon Credits.

From Sea to Sky: MOL & Climeworks Launch Maritime Carbon Removal First

From Sea to Sky: MOL & Climeworks Launch Maritime Carbon Removal First

Climeworks, a Swiss company known for its carbon removal technology, announced a major partnership with Mitsui O.S.K. Lines (MOL), one of the world’s largest shipping companies. This is Climeworks’ first collaboration with a shipping company and its first agreement with a Japanese partner.

As part of the deal, Climeworks will remove 13,400 tons of carbon dioxide (CO₂) from the air on behalf of MOL by 2030.

This agreement supports MOL’s goal of reaching net-zero greenhouse gas emissions by 2050. MOL is already using clean energy, improving energy efficiency, and testing new technologies. But because shipping is one of the hardest industries to decarbonize, carbon removal is seen as a necessary tool to meet climate goals.

Christoph Gebald, co-founder and Co-CEO of Climeworks, said,

“Shipping is a hard-to-abate sector where residual emissions are likely to remain even with ambitious mitigation measures. Carbon removal solutions will be necessary to address those emissions and reach full climate targets.”

How Climeworks’ Direct Air Capture Technology Works

Climeworks uses a method called Direct Air Capture (DAC) to remove CO₂ directly from the atmosphere. Special machines with large fans pull in air, which passes through filters that trap CO₂.

When the filters are full, they are heated to release the CO₂ gas. This gas is then either stored underground, where it turns into rock over time, or reused in other processes. This approach removes CO₂ permanently and allows it to be measured, verified, and tracked.

Climeworks DAC technology
Source: Climeworks

Climeworks opened its largest DAC facility, called Mammoth, in Iceland in 2024. This plant can capture up to 36,000 tons of CO₂ per year. It builds on Climeworks’ Orca project. This is part of their plan to remove multi-megaton CO₂ by the 2030s and reach gigaton levels by 2050.

Hard-to-Abate Emissions and the Role of Carbon Removal

Shipping contributes about 3% of global greenhouse gas emissions. The chart below shows the industry’s emissions since 2012 by vessel type. Unlike cars or buildings, which can switch to electric or renewable energy solutions more easily, cargo ships are harder to decarbonize.

shipping emissions 2023
Source: UNCTAD

Even with low-carbon fuels and better designs, some emissions will remain. That’s why companies like MOL are turning to carbon removal.

Through this agreement, MOL is taking early action to address the challenge. It plans to remove 2.2 million tons of CO₂ by 2030. The partnership with Climeworks marks an important first step in reaching this goal.

MOL’s Commitment to Net-Zero Emissions

MOL has set a clear goal to achieve net-zero GHG emissions by 2050, as outlined in its “MOL Group Environmental Vision 2.2.” This roadmap outlines clear goals and milestones. They will help the company reduce emissions in its operations. ​

MOL net zero emissions roadmap 2050
Source: MOL

To reach this goal, MOL is implementing various strategies, including:​

  • Adopting Clean Energy. MOL is investing in alternative fuels, such as e-methane and bio-methanol, to power its vessels. These cleaner energy sources are part of the company’s plan to reduce reliance on traditional fossil fuels. ​

  • Energy-Saving Technologies. The company is enhancing ship designs and operations to improve energy efficiency. This includes utilizing wind power for vessel propulsion and other innovative technologies to lower fuel consumption.

  • Carbon Removal Initiatives. MOL has partnered with Climeworks to remove CO₂ from the atmosphere using DAC technology. This collaboration aims to offset emissions that are difficult to eliminate through other means.

Hisashi Umemura, Senior Executive Officer of MOL, explained,

“At Mitsui O.S.K. Lines, we’re committed to navigating toward a net-zero future. Contributing the expansion of high-integrity carbon removal credits, driven by Climeworks’ state-of-the-art Direct Air Capture technology, empowers us to address emissions that are hard to eliminate through conventional methods. This is not just an investment in carbon removal but an investment in the future of sustainable shipping.”

Japan’s Role in the Carbon Removal Market

Japan is playing a bigger role in the carbon removal industry. In 2024, it became the first country to allow international, durable carbon removal credits in its national emissions trading system. This made it easier for companies like MOL to invest in projects like Climeworks’.

MOL is not only Climeworks’ first shipping client but also its first customer from Japan. This shows how both are working together to push the boundaries of climate solutions.

The Growing Market for Direct Air Capture

The DAC market is growing quickly as more governments and companies take action to fight climate change. In 2023, experts valued the global DAC market at about $62 million.

DAC market outlook
Source: MarketsandMarkets
  • By 2030, they expect it to reach around $1.7 billion, with a strong annual growth rate of 60.9%, according to MarketsandMarkets.

Governments around the world are setting net-zero emission targets, which drives up demand for DAC. Many companies also see value in DAC to support synthetic fuels and meet climate goals.

North America leads the DAC market, thanks to major investments in new DAC technologies. Europe follows closely, with strong policies and big climate ambitions helping the market grow.

With these trends in place, the DAC market looks ready to keep growing fast. As more groups choose carbon removal, DAC will play a bigger role in global efforts to limit climate change.

A Bigger Vision for Global Impact

Alongside the offtake agreement to remove 13,400 tons of CO₂, MOL and Climeworks also signed a Memorandum of Understanding. This means MOL might invest in future Climeworks projects. These investments would help Climeworks build more DAC plants worldwide, increasing their ability to remove CO₂ on a large scale.

This partnership goes beyond reducing emissions in shipping. It shows how companies can take the lead in fighting climate change. By working with Climeworks, MOL is also helping to create demand for high-quality carbon removal solutions. These early actions could make it easier and more affordable for other industries to follow.

More initiatives like this can help carbon removal technologies grow to become a key part in decarbonizing the shipping industry and be a global strategy to fight climate change.

The post From Sea to Sky: MOL & Climeworks Launch Maritime Carbon Removal First appeared first on Carbon Credits.

U.S. Solar and Energy Storage Set for Major Growth in 2025

U.S. Solar and Energy Storage Set for Major Growth in 2025

Disseminated on behalf of SolarBank Corporation.

The U.S. energy system is changing fast. In 2025, the country is expected to add about 97 gigawatts (GW) of new electricity capacity. Most of this growth will come from solar power and energy storage, showing strong momentum for clean energy, even as fossil fuels remain part of the mix.

A report from S&P Global Market Intelligence says that more than 59 GW of new solar and wind projects are planned for 2025, along with over 31 GW of energy storage. This means nearly 90% of new electricity projects next year will be tied to renewable energy and batteries.

Solar Shines Brightest

Solar energy is growing quickly across the United States. Nearly 49 GW of solar power is in line to connect to the electric grid. That’s enough to power more than 35 million homes for a year.

Texas is leading the solar race, with more than 12 GW of planned solar capacity. Other large amounts are planned in the Midcontinent Independent System Operator (MISO) region with 8 GW, and the PJM Interconnection area with over 6 GW.

US energy capacity additions, retirements by fuel type
Source: S&P Global

The growth of solar is being pushed by several things:

  • Falling prices of solar panels
  • Government tax credits and incentives
  • Demand for clean electricity from businesses and households

According to the Solar Energy Industries Association (SEIA), the U.S. solar market grew by 51% in 2023, and similar strong growth is expected in 2025. By 2034, the High Case scenario shows a 17% increase in solar deployment. 

US solar forecast to 2034

Batteries or Energy Storage Take the Grid to the Next Level

Energy storage systems, mostly large batteries, are important because they help store solar and wind power for use when the sun isn’t shining or the wind isn’t blowing. In 2025, over 31 GW of new storage capacity is expected to be built.

California and Texas are the leaders in battery storage. The California Independent System Operator (CAISO) is set to add about 6 GW of storage next year, while Texas plans to add nearly 12 GW.

Storage growth is important because it makes renewable energy more reliable. Batteries can help keep the grid stable and reduce blackouts.

Wind Picks Up, But Slower

Wind energy is still expanding, though not as fast as solar. More than 2 GW of new wind capacity is expected in Texas alone in 2025, and around 2 GW more across the rest of the country.

Offshore wind projects have faced delays due to high costs and supply chain problems, but some are moving ahead. For example, the Vineyard Wind project off the coast of Massachusetts began delivering power to the grid in early 2024 and plans to expand.

Fossil Fuels: Still in the Field

While renewable energy is growing fast, fossil fuels like natural gas and coal are still part of the energy system.

US 2025 capacity additions, retirements energy

In 2025, the U.S. plans to add 6.4 GW of new natural gas capacity. At the same time, 4.6 GW of older gas plants are expected to retire, resulting in a net gain of 1.8 GW.

Coal power continues to decline. About 6.2 GW of coal-fired power plants are scheduled to shut down in 2025. This follows a long-term trend, as more utilities move away from coal due to high costs and pollution concerns.

Still, some recent government actions could slow coal’s decline. In April 2025, President Trump signed orders calling coal a “critical mineral” and pushed for its use in powering data centers. His administration declared a “national energy emergency” and said the grid was becoming less reliable without coal and gas.

Even so, experts say coal is unlikely to see a big comeback. Most utility companies are not planning to build new coal plants, as they worry about being left with stranded assets—plants that cost more to operate than they earn.

Natural Gas Eyes a Bigger Role

As electricity demand rises, especially from electric vehicles and data centers, natural gas could play a larger role in some parts of the country.

There’s going to be a lot of momentum for natural gas, per Steve Piper, director of energy research at S&P Global Commodity Insights. He noted that areas like the Marcellus and Utica shale regions, which have low-cost gas, could see more gas power plants being built.

Still, challenges remain for natural gas. High capital costs, slow permitting, and supply chain delays could limit how fast new plants are built.

Grid Growth by Region

Each part of the U.S. energy grid has its own plans for new projects in 2025. These include the following:

  • ERCOT (Texas): 27 GW of new capacity, with only 574 MW of retirements. Major growth in solar and batteries.
  • PJM (Mid-Atlantic and Midwest): 7 GW of new projects, mostly solar. About 3 GW of fossil fuel plants will retire.
  • CAISO (California): 10 GW of new capacity, including 6 GW of storage.
  • MISO (Midwest): 11 GW of new capacity, mostly solar. Coal retirements are expected.
  • ISO New England: About 2 GW of new power, mostly solar and storage.
  • NYISO (New York): 1.4 GW of new capacity, with gas retirements.
  • SPP (Southwest Power Pool): 6 GW of new capacity, mainly from solar and gas.
  • Non-ISO/RTO areas (Southeast and Western U.S.): 33 GW of new capacity, including 17 GW of solar and 11 GW of storage.

Toward a Cleaner Grid

Overall, the U.S. is set to add nearly 86 GW of new net power capacity in 2025. Most of this will come from solar and storage. These technologies are key to cutting emissions and meeting climate goals. And one company that stands out in this field is SolarBank Corporation (Nasdaq: SUUN) (Cboe CA: SUNN) (FSE: GY2). 

SolarBank is a leading independent renewable energy developer focused on distributed and community solar projects in Canada and the U.S. The company specializes in solar, battery storage, and EV charging solutions for utilities, municipalities, commercial clients, and homeowners.

Notably, SolarBank completed a $41 million USD deal with Honeywell for three New York-based solar projects and began work on a 1.4 MW rooftop project for Fiera Real Estate in Alberta. Major community solar initiatives include the Geddes, Greenville, and Nassau projects in New York, set to power thousands of homes. In Nova Scotia, SolarBank is developing up to 31 MW of solar capacity with TriMac Engineering, targeting 4,000 households.

SolarBank projects
Source: SolarBank

Looking ahead, SolarBank is advancing projects in New York, Pennsylvania, and Nova Scotia, including agrivoltaic systems that combine solar power with farming. These efforts highlight the company’s role in accelerating the clean energy transition through innovative, community-based solar solutions.

However, fossil fuels are still needed to meet rising demand and ensure grid reliability. Policymakers and energy companies face tough choices as they try to balance clean energy growth with keeping the lights on.

Even with political shifts, experts say the energy transition is moving forward. Market forces, customer demand, and lower costs for renewables are driving long-term change.

As more projects get built in 2025, the U.S. will come closer to a cleaner energy system—one that can power homes, businesses, and vehicles while cutting carbon pollution.

This report contains forward-looking information. Please refer to the SolarBank press release entitled “SolarBank Announces 2024 Highlights” for details of the information, risks and assumptions.


Disclosure: Owners, members, directors, and employees of carboncredits.com have/may have stock or option positions in any of the companies mentioned: None.

Additional disclosure: This communication serves the sole purpose of adding value to the research process and is for information only. Please do your own due diligence. Every investment in securities mentioned in publications of carboncredits.com involves risks that could lead to a total loss of the invested capital.

Please read our Full RISKS and DISCLOSURE here.

The post U.S. Solar and Energy Storage Set for Major Growth in 2025 appeared first on Carbon Credits.

How AI and Clean Energy Are Competing for Critical Minerals?

AI

The world is rapidly shifting to clean energy, and this is changing how we power our lives. Technologies like solar panels, wind turbines, and electric vehicles (EVs) need a lot more minerals than traditional fossil fuel systems.

For example, EVs use six times more minerals than regular cars. Onshore wind farms need nine times more minerals than gas power plants. Since 2010, the mineral use for each new power plant has jumped by 50%. This rise is mainly because renewables are growing fast.

Meanwhile, along with this clean energy transition, AI is the new player that is adding more pressure to global mineral supplies. IEA’s latest Energy and AI report shows that the rapid growth of AI and digital infrastructure is increasing demand for key materials already needed by the energy sector.

This means data centers, which power AI, rely on a wide range of critical minerals, many of which overlap with clean energy technologies.

Clean Energy Vs AI’s Mineral Requirements

Each clean energy tool depends on specific minerals. Batteries need lithium, cobalt, nickel, manganese, and graphite. Amongst all, lithium is the key to making lithium-ion batteries, which power backup systems in data centers. These batteries help keep things running during power outages.

Similarly, wind turbines and EV motors use rare earth elements for their magnets. Copper and aluminum are key for power lines and grids. Copper is especially important because it’s used in almost every clean energy device.

IEA predicts that by the 2040s, clean energy could account for over 40% of copper and rare earth use, 60–70% of cobalt and nickel use, and nearly 90% of lithium use. Already, EVs and batteries use more lithium than electronics. Soon, they’ll also use more nickel than stainless steel.

Minerals used in clean energy technologies compared to other power generation sources

clean tech critical mineral

AI’s Mineral Requirements are Complex

However, figuring out exactly how much mineral demand AI growth will create isn’t easy. That’s because there’s limited detailed data on what types of chips, processors, cooling systems, and storage equipment different data centers use.

Data Centers Demand More Than Just Power

Building and running data centers isn’t just about electricity. These digital hubs need large amounts of copper, aluminum, silicon, gallium, rare earth elements, and battery minerals.

  • Copper is essential for power systems, cooling networks, and fast data cables.
  • Aluminum, valued for its lightweight and heat resistance, is used in server racks and protective casings.
  • Silicon, especially in its purest form, forms the core of chips, memory, and storage devices.
  • Gallium-based compounds like gallium nitride and gallium arsenide are now common in high-speed processors and energy-efficient electronics.
  • Rare earths such as neodymium, dysprosium, and terbium play a crucial role in motors, cooling fans, and precision parts.

Data centers critical minerals

Still, estimates show that by 2030, the rise in data centers could drive:

  • 2% of the global demand for copper and silicon
  • Over 3% for rare earth elements
  • A huge 11% for gallium

Even though data centers won’t be the biggest users of these minerals, the total amounts are significant. It’s about 512,000 tonnes of copper and 75,000 tonnes of silicon by 2030. This means project developers need to take mineral supply seriously.

Looking ahead, defense, clean energy, construction, aviation, and AI will all be competing for the same limited mineral resources. For some, like copper, the supply is already falling short of demand. And the added pressure from growing AI data centers could make it worse.

Governments and industries will need to plan diligently to make sure they can meet future demand without slowing down critical projects.

Heavy Reliance on a Few Countries Puts Mineral Supply at Risk

One major issue with critical minerals is that most of the world’s supply comes from just a few countries. In 2024, the top three producers- China, Chile, and the DRC supplied:

  • Almost 60% of refined copper
  • Around 90% of aluminum
  • Over 90% of silicon, magnet-related rare earths, and gallium

This heavy concentration makes global supply chains vulnerable. If something disrupts production, like extreme weather, accidents, trade conflicts, or political tensions, it could lead to serious shortages.

Ai critical minerals global

China’s Export Restrictions 

These risks aren’t just hypothetical. In late 2024, China placed export restrictions on gallium, germanium, and antimony targeting the U.S. As a result, gallium prices outside China more than doubled in just five months.

China also added controls on graphite, followed by even more limits in early 2025 on tungsten, tellurium, bismuth, indium, and molybdenum. These minerals are key for advanced tech, defense tools, and data centers. And the trade war continues with Trump imposing huge tariffs on Chinese imports.

All of this shows how fragile the mineral supply chain has become. If these materials become harder to get, the cost of building and running data centers and other tech could rise sharply. This wouldn’t just affect companies, but also consumers and the broader economy.

Is a Mineral Security Crisis Brewing?

As more sectors from clean power and EVs to defense and digital tech chase the same scarce minerals, the risk of shortages is growing. Without urgent action, supply issues could raise costs and slow down vital projects worldwide.

Data center and AI growth would only flourish in the future. The potential solution could be if countries and companies diversify mineral sources, invest in recycling, and strengthen supply chains. The race for minerals is no longer just about the energy shift, it’s about protecting the future of global technology.

The post How AI and Clean Energy Are Competing for Critical Minerals? appeared first on Carbon Credits.

China Sets Clean Energy Record in Early 2025 with 951 TW

China Sets Clean Energy Record in Early 2025 with 951 TW

China made big progress in clean energy during the first three months of 2025. The country produced 951 terawatt hours (TWh) of clean electricity between January and March. That’s 19% more than during the same period in 2024, according to energy think tank Ember.

  • Clean energy now makes up 39% of all electricity in China, up from 34% last year.

This growth shows how quickly China is moving toward cleaner power. It also puts China far ahead of other major countries like the United States and those in Europe. Experts from Ember said this trend will likely continue throughout the year as clean sources like solar, wind, and hydro continue to grow.

Solar Skyrockets, Wind Whirls Past Records

China has been building many new clean energy projects in recent years. These include large wind farms, solar parks, and hydropower stations. The goal is to reduce pollution, improve energy security, and help fight climate change. The results from early 2025 show that these efforts are paying off.

china electricity generation by source Q1 2025

  • Wind energy was China’s largest source of clean power in early 2025, as seen above. Wind farms generated 307 TWh, which is 13% of the country’s total electricity.

That’s the highest wind share on record so far. These wind farms are located across many provinces, especially in northern and western China, where there is a lot of open space and strong wind.

Solar power grew even faster. In Q1 2025, solar generation rose 48% compared to the same period in 2024. Solar power reached 254 TWh, making up 10% of total electricity. This was the largest increase among all clean energy sources.

China is home to some of the world’s biggest solar farms, including desert-based installations that stretch across thousands of acres.

For the first time, solar and wind together produced more electricity than hydro power. This is a major shift. In the past, hydro was always the top clean energy source in China. But now, new investments in solar and wind are starting to take the lead.

Hydropower still plays an important role. In Q1 2025, hydro power grew 7% year-over-year to 226 TWh. This growth is important because hydro helps balance the power grid when wind and solar are not available.

Nuclear energy also increased, with output rising 13% to 117 TWh. Nuclear plants provide steady, non-stop electricity and support the shift away from fossil fuels.

Coal and Gas Use Drops

Thanks to the increase in clean energy, China was able to reduce its use of fossil fuels. Coal-fired electricity dropped by 4%, falling to 1,421 TWh.

Coal is still the largest source of electricity in China, but its share fell from 63% to 58%. This is a sign that clean energy is starting to take over more of the power mix.

Gas-fired power also went down by 4%, reaching 67 TWh. Gas is a cleaner fossil fuel than coal, but it still produces carbon emissions. Reducing gas use along with coal is important for meeting climate goals.

As a result of these changes, the total electricity from fossil fuels dropped to 2,445 TWh in Q1 2025. While fossil fuels still provide more than half of China’s electricity, the gap is narrowing as clean energy continues to grow.

China Pulls Ahead in the Global Clean Energy Race

China’s clean energy growth was much higher than in other big economies. In the U.S., clean electricity rose by just 6% in early 2025. In Europe, it actually fell by 5% due to less hydro generation and delays in new wind projects.

clean electricity or energy generation China vs 2025

This gap is expected to grow even more during the summer. China’s solar and hydro output usually peaks between July and August. That’s when the sun is strongest and the river water levels are high. Experts say China is likely to break more clean energy records later in the year.

In comparison, clean energy growth in the U.S. and Europe has slowed. This is partly due to rising costs, supply chain problems, and less government support. Meanwhile, China continues to invest heavily in clean power and has strong policy support from the government.

In 2024, China already saw a 15% increase in clean electricity. That was more than double the growth in the U.S. and Europe, which only grew by 6% each. If this trend continues, China will widen its lead even further in 2025.

clean electricity generation China vs 2024

More Records Expected in 2025

If current trends continue, 2025 could be China’s biggest year yet for clean electricity. Solar farms are expanding fast, and hydro power will increase as river levels rise during the rainy season. These factors, combined with nuclear growth, will boost the clean energy supply.

China is also adding more battery storage to help manage the power grid. Batteries can store extra solar or wind power and release it when demand is high. This helps keep the electricity system stable.

Experts believe China’s clean energy efforts could cut its carbon emissions by 30% by 2035—if current progress continues. The country is building a strong base for long-term change in how it produces and uses energy. This is important not just for China, but for the whole world, because China is the largest energy user and emitter of greenhouse gases.

China carbon emissions

Why China’s Energy Shift Matters for the World

China’s clean electricity generation reached a record 951 TWh in the first quarter of 2025. Clean sources now make up 39% of the country’s power mix, led by strong growth in solar and wind energy.

At the same time, coal and gas use have gone down. With more solar, wind, and hydro coming online in the next few months, China is on track for another record year.

While other countries are slowing down, China is pushing forward as a global leader in clean energy. The progress made so far in 2025 shows that China’s energy transition is speeding up—and could help shape the future of global energy for years to come.

The post China Sets Clean Energy Record in Early 2025 with 951 TW appeared first on Carbon Credits.

Paladin Energy Hits Record Uranium Output Since Restart at Langer Heinrich

uranium

Paladin Energy saw a 17% jump in uranium production in the March 2025 quarter, which sent its stock price up. The company produced 745,484 pounds of uranium oxide (U3O8) at its Langer Heinrich Mine in Namibia. It’s the highest amount since the mine restarted last year in March.

The company is supplying safe and steady uranium oxide to help the nuclear industry deliver clean and reliable energy to the world. Even though heavy rainfall, which they hail as one of the worst in 50 years, briefly shut down the site and damaged roads, it bounced back quickly.

Notably, it processed over 900,000 tonnes of ore during the quarter and reached a solid 88% recovery rate at its plant. For now, the mine is mainly using ore stockpiled, but is getting ready for full-scale open-pit mining.

Paladin’s Uranium Sales Beat Production, Strong Market Demand

Paladin sold 872,435 pounds of uranium in this quarter, more than it produced. The company earned an average price of US$69.9 per pound. This strong performance was facilitated by the timing of customer deliveries.

paladin uranium output
Source: Paladin

It also reported that it had US$127.8 million in cash and access to another US$50 million in loans, giving it plenty of funds to grow its business.

According to a report from Mining Technology shows that in 2025, global uranium production will continue its upward trend and is expected to reach ~ 65 megatonnes (Mt). This represented a year-on-year growth rate of around 9%, driven by increased output from leading producers such as Kazakhstan and Canada.

Kazakhstan topped in uranium production capacity last year, and this massive output came from its largest uranium company, Kazatomprom. Furthermore, the steady ramp-up of Canada’s McArthur River uranium mine also contributed significantly to the overall increase.

global uranium trend
Sourced from Mining Technology, original: Global uranium output. Credit: GlobalData.

Coming back to Paladin, it now has 12 long-term contracts with top global customers. In total, Paladin has committed to supply 22.3 million pounds of uranium through 2030. This strong sales pipeline shows the company is in high demand and is a major contributor to Australia’s bright uranium future.

paladin
Source: Paladin

Langer Heinrich Mine: A Key Player for Nuclear Power

The Langer Heinrich Mine is located about 80 km from Swakopmund in Namibia. Paladin owns 75% of the mine, which is expected to play a big role in global decarbonization.

Once fully operational, LHM will produce enough uranium to power over ten 1,000 MWe nuclear power plants for a year and support the demand for low-carbon energy.

The mine restarted operations in March 2024 after a major upgrade. It uses the conventional and simple alkaline leach process to extract uranium, which helps keep operations steady and low-risk.

Paladin Pushes for Greener Langer Heinrich Mine

Direct emissions or Scope 1, come mostly from fuel burned on-site and diesel used in mining vehicles and transportation. Indirect Scope 2 emissions result from electricity purchased from NamPower, Namibia’s national power supplier.

NamPower sources electricity from hydroelectric plants in Namibia, Zambia, and Zimbabwe. In recent years, solar power has also been added, helping reduce the region’s carbon footprint.

Rise in Emissions

Paladin Energy’s emissions increased sharply last year compared to 2023. This is because the mine returned to commercial production. Activities such as system testing and facility upgrades before the restart also added to the total emissions.

  • Scope 1 emissions rose from 752 tonnes CO₂e in 2023 to 18,994 tonnes CO₂e in 2024.

  • Scope 2 emissions were up from 431 tonnes CO₂e to 19,063 tonnes CO₂e in the same period.

This year the mine is ramping up output, and they expect a rise in Scope 1 and 2 emissions further as production hits full capacity. However, they are taking necessary steps to reduce their carbon emissions and environmental impact.

Paladin emissions
Source: Paladin

Protecting the Air Quality

The uranium miner has a completely rigorous checking of baseline air quality for gases like sulfur oxides (SOx), nitrogen oxides (NOx), and volatile organic compounds (VOCs).

They have skilled technicians who can handle the air monitoring system. The air monitoring plan tracks emissions from exhaust stacks, and it will continue throughout this year. This ensures the mine meets environmental standards and performance goals.

Reducing Environmental Impact

Paladin follows a strict Environmental Policy supported by clear procedures and plans. These include managing land and water use, reducing greenhouse gas emissions, and reducing mining waste.

When the mine restarted in 2024, it produced only small amounts of hazardous waste. All non-mineral waste is scanned for radioactivity. If found to be radioactive, the waste stays on-site in a special storage facility.

  • Ensure all hazardous and non-hazardous waste is handled safely and meets environmental standards.
  • Cut waste through reduction, reuse, recycling, and recovery

Recently, the Canadian government gave Paladin special approval to move forward with its Patterson Lake South (PLS) project. The company also signed community benefit agreements with two First Nations groups in Canada, showing its commitment to local partnerships.

Lastly, with rising uranium demand and strong results, Paladin Energy is growing fast. Its success also lifted other uranium companies in Australia, which showed strong confidence in this booming nuclear sector.

The post Paladin Energy Hits Record Uranium Output Since Restart at Langer Heinrich appeared first on Carbon Credits.

U.S. Slaps 3,521% Tariffs on Solar Imports—SolarBank CEO Shares Growth Strategy

Solar Stocks Rally As U.S. Sets 3,521% Tariffs on Southeast Asian Solar Imports

The U.S. government has imposed steep tariffs on solar panels and cells imported from four Southeast Asian countries: Cambodia, Vietnam, Malaysia, and Thailand. These new duties come from a yearlong investigation by the U.S. Department of Commerce. It found that solar manufacturers in these countries unfairly benefited from government subsidies. They sold their products for less than it cost to make them.

The move has caused big shifts in the global solar industry, with solar stocks rallying. It impacts manufacturers, investors, and clean energy goals. Let’s get to know how.

What Prompted the Tariffs?

The investigation began after complaints from a coalition of U.S. solar manufacturers, including Hanwha Qcells, First Solar, Mission Solar, and Meyer Burger. These companies are part of the American Alliance for Solar Manufacturing Trade Committee. They claimed that foreign solar producers were undercutting the U.S. market by dumping cheap products.

The Department of Commerce agreed. They ruled that solar products from four Southeast Asian countries—many owned or backed by Chinese firms—were sold at unfairly low prices. These products also received foreign subsidies.

The solar duties were finalized in April 2025. This came five months after a preliminary decision made during President Joe Biden’s term.

According to the final ruling, some companies received tariffs as high as 3,521%, though the rates vary by country and manufacturer. For example, the highest anti-dumping (AD) and countervailing duty (CVD) rates imposed were:

  • Cambodia: up to 125.37% (AD) and 3,403.96% (CVD)
  • Malaysia: up to 81.24% (AD) and 168.8% (CVD)
  • Thailand: up to 202.9% (AD) and 799.55% (CVD)
  • Vietnam: up to 271.28% (AD) and 542.64% (CVD)

These countries are the top importers of solar panel products to the U.S. According to an S&P Global report, the U.S. imported 8.1 GW of solar modules in Q4 2024, 61% of which came from those Southeast Asian nations, excluding Cambodia.

Solar panels Imports to US
Source: S&P Global

Some companies, such as Hanwha Qcells in Malaysia, received much lower rates. The company received a 0% AD rate and only 14.64% CVD, largely due to its cooperation with the investigation and existing U.S.-based production capacity.

How Did the Market React?

The tariffs caused an immediate reaction in the stock market. U.S.-based solar companies saw their shares climb sharply after the announcement.

  • First Solar’s shares jumped about 14%, Sunnova Energy also rose 14%, and SolarEdge Technologies increased by 12%.

Investors viewed the decision as a win for U.S. manufacturers, who now face less competition from low-priced imports.

Industry lawyer Tim Brightbill, who represented the American manufacturers, called the decision a “decisive victory for American manufacturing.” He said it was an important step toward protecting U.S. jobs and rebuilding the country’s industrial base.

Impact on Southeast Asian Manufacturers

Before these tariffs, the four Southeast Asian countries supplied nearly 80% of the solar products imported into the U.S. 

US solar panel imports Q3 2024
Source: S&P Global

That market is now in jeopardy. With the expiration of a two-year tariff waiver in June 2024, many Chinese-owned manufacturers in the region had already started scaling back or relocating operations. Some shifted to countries like Indonesia and Laos, which are not currently affected by the tariffs. But experts warn that these moves may not be long-term solutions, as future tariffs could target those countries as well.

Sharad Somani, head of infrastructure at KPMG Asia Pacific, explained that these tariffs challenge Southeast Asia’s position as a major solar manufacturing hub. He noted that the region’s attractiveness to investors may drop as companies look elsewhere for more stable trade conditions. However, he further noted that: 

“South-east Asia could experience indirect upside, as the region’s huge untapped solar resource can leverage potentially excess manufacturing capacity at competitive rates locally.”

Manufacturers in Cambodia were hit especially hard. Two major companies—Hounen Solar and Solar Long—pulled out of the investigation, saying they lacked the resources to continue. Though they denied any wrongdoing, the withdrawal likely contributed to the high tariff rates they received.

Global Supply Chain and Investment Shifts

Tariffs might slow solar manufacturing growth in Southeast Asia. They may also lead global investors to look for options in Europe, India, or the Middle East. With the U.S. market less accessible, producers will need to find new buyers. This could lead to temporary oversupply and falling prices in other regions, which may benefit local solar projects.

In the short term, the U.S. tariffs could disrupt the global solar supply chain. Clean Energy Associates, an energy market research group, warned that the AD/CVD measures could raise the price of solar modules in the U.S. by $0.15 per watt.

Modules made in the U.S. might also rise by $0.10 per watt due to supply bottlenecks. This could cause delays or even cancellations of solar projects, especially those still in planning or financing stages.

In addition, the tariffs are retroactive, meaning companies may be charged duties on past shipments. This uncertainty can make it harder for developers to secure funding or accurately estimate project costs.

This latest trade action reflects a broader shift in U.S. policy under President Donald Trump. His return to office focuses on stronger protectionism. Just weeks before the solar tariff announcement, the Trump administration imposed reciprocal tariffs on imports from about 90 countries.

SolarBank: Opportunities Amid Tariff Hikes

As tariffs on solar products from Southeast Asia rise, U.S.-based companies like SolarBank Corporation (NASDAQ: SUUN; Cboe CA: SUNN, FSE: GY2) may have new opportunities. SolarBank is a growing company that develops solar energy projects, battery storage, and EV charging solutions across Canada and the U.S. It does not manufacture solar panels but it does import them for its projects. However, SolarBank is not presently importing from any of the four countries that are part of this recent trade action.

The new tariffs will make solar panels from Southeast Asia more expensive. This may increase demand for U.S.-made solar products. Companies like SolarBank, which already have a solid presence in the U.S., can benefit by sourcing local options.

U.S. solar stocks have risen since the tariff announcement, which could help companies like SolarBank. The tariffs also give the company a chance to show how it can reduce risks in the supply chain by focusing on local production instead of relying on overseas manufacturers.

Regarding the recent tariffs, Dr. Richard Lu, CEO of SolarBank Commented:

“We continue to execute on our development pipeline of community solar projects. I also want to comment on the recent announcement of increased tariffs on south-east Asia solar cells and SolarBank’s plans to manage its supply chain.

SolarBank has not been importing solar panels from any of the four countries that are subject to the tariffs announced by the U.S. Department of Commerce on April 21, 2025. As a result its present operations are not affected by this announcement. In addition, SolarBank has been exploring sourcing solar panels from other jurisdictions such as the Middle East and North America, where (domestic assembled) solar panels are becoming cost competitive with the panels imported from Asia. SolarBank also has significant development opportunities in Canada where solar panels are not subject to the same tariffs. Finally, I am expecting that electricity costs will increase in response to these tariffs which will further mitigate the financial impact on projects.

Overall, SolarBank is well positioned to manage this risk.”

With over one gigawatt of projects planned and 100 megawatts already completed, SolarBank is well-positioned to meet the growing demand for U.S.-made solar solutions.

SolarBank project pipeline
Source: SolarBank

What Happens Next?

The next key milestone is the decision by the U.S. International Trade Commission (ITC), expected on May 20, 2025. The ITC will determine whether the imports have harmed U.S. solar manufacturers. If the ITC agrees with the Commerce Department’s findings, the tariffs will stay in place.

In the meantime, the U.S. solar industry finds itself at a crossroads. While domestic manufacturers celebrate, project developers worry about rising costs and delays. Southeast Asian producers may have to rethink their market strategies and possibly relocate their operations.

As the global solar industry adapts, the effects of this trade decision will likely ripple for years to come. Balancing trade protections with clean energy goals remains a complex challenge—one that countries must carefully manage as they move toward a low-carbon future.

Carboncredits.com receives compensation for this publication and has a business relationship with any company whose stock(s) is/are mentioned in this article.

Additional disclosure: This communication serves the sole purpose of adding value to the research process and is for information only. Please do your own due diligence. Every investment in securities mentioned in publications of carboncredits.com involves risks that could lead to a total loss of the invested capital.

Please read our Full RISKS and DISCLOSURE here.

The post U.S. Slaps 3,521% Tariffs on Solar Imports—SolarBank CEO Shares Growth Strategy appeared first on Carbon Credits.

Google Rides the Wind: First Offshore Wind Deal in Asia Pacific For 24/7 Carbon-Free Energy

Google Rides the Wind: First Offshore Wind Deal in Asia Pacific For 24/7 Carbon-Free Energy

Google has made a major step forward in its clean energy journey by signing its first offshore wind power purchase agreement (PPA) in the Asia-Pacific region. The deal is with the Fengmiao I offshore wind project in Taiwan, being developed by Copenhagen Infrastructure Partners (CIP). It is a milestone for both Google and the Taiwanese offshore wind sector.

Once completed in 2027, Fengmiao I will have a capacity of 495 megawatts (MW). Google will use this clean energy to power its data center, cloud region, and offices in Taiwan. This is part of Google’s plan to run on carbon-free energy all the time, in every place it operates by 2030.

A Landmark for Offshore Wind in Taiwan

The Fengmiao I project is the first from Taiwan’s Round 3.1 offshore wind auction to reach financial close. This achievement could spark further development in the country’s renewable energy sector.

Taiwan is facing rising electricity demand and climate goals, so it aims to cut fossil fuel use. The plan is to boost renewable energy, like wind and solar.

Google’s support for Fengmiao I shows other tech companies and investors that offshore wind energy in Asia is important and viable. I-Chun Hsiao, Senior Lead for APAC at Google Energy and Infrastructure, says this project is vital. It helps Google’s clean energy goals and boosts Taiwan’s energy security.

Supporting 24/7 Carbon-Free Energy Goals

Google’s partnership with CIP in Taiwan builds on its broader efforts to operate on 24/7 carbon-free energy. Since 2020, Google has aimed to match its electricity use with carbon-free energy every hour in all its locations. It’s not just about buying enough renewable energy each year. It’s about having clean power available all the time.

Google’s Carbon-Free Map with Data Center Operations

Google carbon-free energy map with data center operations
Source: Google

To achieve this, Google has invested in various energy technologies and projects across the globe. In Taiwan, this includes solar and geothermal energy agreements. For example, in 2024, Google partnered with BlackRock to invest in a portfolio of solar projects from New Green Power.

The company also signed a geothermal energy deal with Baseload Capital to diversify its energy sources.

These efforts in Taiwan are part of Google’s global clean energy strategy. The company has signed over 80 renewable energy agreements worldwide. This effort adds more than 10 gigawatts (GW) of new clean energy capacity to global grids.

Why Offshore Wind?

Offshore wind energy is a crucial solution for reducing carbon emissions in electricity systems. This is especially true in areas with little land available. Offshore wind turbines can generate more power than their onshore counterparts due to higher and more consistent wind speeds over the oceans.

The Fengmiao I project will have a capacity of 495 MW. This energy will power hundreds of thousands of homes in Taiwan. It aims to meet rising energy demands and lower emissions. The energy generated will be delivered to Google facilities via the local grid, contributing to the company’s hourly carbon-free energy targets.

Globally, offshore wind capacity is growing rapidly. The Global Wind Energy Council (GWEC) reports that over 64 GW of offshore wind power was installed globally by the end of 2023. If supportive policies remain in place, capacity could hit 380 GW by 2035.

new offshore wind installations 2024
Source: GWEC

In 2024, 8 gigawatts (GW) of new offshore wind power were connected to the grid around the world, per the GWEC report. This brought the total global offshore wind capacity to 83.2 GW by the end of the year.

  • However, the new additions were 26% lower than in 2023. Even so, 2024 was still the 4th-best year ever for offshore wind growth.

Taiwan is considered a regional leader, aiming to install 15 GW of offshore wind capacity by 2035.

offshore wind installations 2024
Source: GWEC

Copenhagen Infrastructure Partners and Their Role

Copenhagen Infrastructure Partners, the developer behind Fengmiao I, is a leading investor in energy transition projects. The company just closed its CI V flagship fund. It raised over €12 billion (US$13.1 billion) to support clean energy projects in safe countries.

CIP has previously worked with Google on other offshore wind projects, making this the second PPA between the two companies. CIP signed deals with several Taiwanese companies. These include United Microelectronics Corporation (UMC), Sino-American Silicon Products, Far EasTone Telecommunications, and MediaTek. These partnerships highlight the growing demand for reliable and sustainable energy in Taiwan’s high-tech economy.

Google’s Clean Energy Journey

Google was the first major company to become carbon neutral in 2007 and has been matching its global electricity use with 100% renewable energy since 2017. However, the company acknowledged that annual matching is not enough to fully eliminate carbon emissions from its operations.

In fact, its total emissions grew in 2024 compared to 2023 by 48%. That’s why the 24/7 carbon-free energy goal was introduced.

Google
Source: Google Environmental Report

This approach aims to solve one of the biggest challenges in clean energy—variability. Solar and wind power generation depend on the weather, which doesn’t always match demand.

Google aims to use a mix of energy sources. This includes solar, wind, geothermal, hydro, and batteries, with the goal to provide clean energy all day and night.

As of early 2024, Google was operating on around 66% carbon-free energy on an hourly basis across its data centers and offices. The company shares progress in its annual Environmental Report. It also pushes for grid upgrades and policy changes to support decarbonization.

Offshore Wind as a Cornerstone of Google’s Strategy

Google’s offshore wind deal in Taiwan is more than a business deal. It shows the company’s strong commitment to sustainability and innovation. By integrating offshore wind with solar and geothermal energy, Google is creating a clean, flexible, and reliable power system for one of its key operational regions.

This project also marks a turning point for offshore wind development in Asia, with Taiwan emerging as a leader in the region. Google’s role should boost investment and use of clean energy tech across the continent.

As global energy demands rise, so does the need for climate action. Initiatives like Fengmiao I show how the private sector can help build a low-carbon future, one project at a time.

The post Google Rides the Wind: First Offshore Wind Deal in Asia Pacific For 24/7 Carbon-Free Energy appeared first on Carbon Credits.