Carbon Credit Market Heads Toward $270 Billion by 2050 as Quality Reshapes Demand

The global carbon credit market is moving beyond stability and into a phase of structural transformation. While headline numbers suggest a market that has stayed flat in recent years, the underlying dynamics tell a very different story. Quality is now reshaping demand, prices are diverging sharply, and long-term growth signals are strengthening.

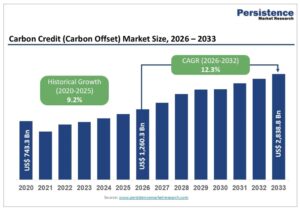
According to market forecasts, the global carbon credit (or carbon offset) market is expected to grow from about $1.26 trillion in 2026 to nearly $2.84 trillion by 2033, expanding at a 12.3% compound annual growth rate. This growth reflects a powerful mix of regulatory pressure, corporate climate commitments, and a steady shift toward high-integrity credits.

carbon credit market
Source: Persistence Market Research

However, the real story lies beneath the surface.

Carbon Credit Market Today: Calm on the Surface, Big Shifts Underway

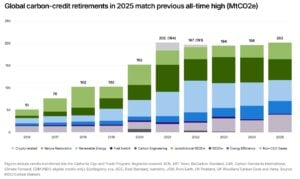
At first glance, the primary carbon credit market appears calm. According to MSCI, in 2025, its value remained steady at just over $1.4 billion, marking the fourth straight year at roughly the same level. Carbon credit retirements also rose modestly, increasing 3% year over year and matching the record highs seen in 2021.

Yet this stability hides major internal shifts.

Rising prices for higher-quality credits helped offset declining demand for lower-quality projects. In other words, the market did not grow in volume, but it evolved in value and composition. This quiet transition is laying the groundwork for stronger expansion in the coming decade.

carbon credits retirement

A Clear Flight Toward Quality

One of the strongest trends shaping the carbon market is the growing divide between high- and low-quality credits.

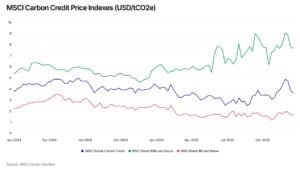
In 2025, the average global carbon credit price slipped slightly to $3.5 per tonne of CO₂, down from $4.3 the year before. However, this overall decline masks a powerful divergence. Credits rated BBB and above rose sharply in value, climbing from $5.6 to $6.8 per tonne, an increase of more than 20% in just one year.

Meanwhile, lower-rated credits moved in the opposite direction. As a result, the price gap between high- and low-quality credits widened significantly. By the end of 2025, higher-quality credits were trading at a premium of more than 360% compared to lower-quality alternatives.

This growing spread signals a market that increasingly rewards integrity, durability, and verified impact.

carbon credit prices

Demand Patterns Are Also Shifting

On the demand side, 202 million tonnes of CO₂ equivalent (MtCO₂e) were retired in 2025. Most retirements came from voluntary corporate action, although some credits were transferred into compliance systems such as California’s Cap-and-Trade Program.

After several years of rapid growth up to 2021, total retirements have now stabilized. This trend continued through 2025, suggesting that the market is consolidating rather than contracting.

More importantly, the type of credits being retired is changing. Only about 10% of retired credits were linked to carbon removals, while 90% came from emissions reduction projects. Nearly all removal-based credits came from nature-based solutions, such as forestry and land restoration. This split remained consistent with 2024.

At the same time, demand for renewable energy credits continued to decline. In 2025, they accounted for less than one-quarter of retirements, down sharply from over one-third earlier in the decade. This decline reflects growing concerns about additionality and real-world impact.

Supply Is Expanding—but Selectively

As of the end of 2025, more than 10,200 carbon credit projects were registered across 18 major registries, according to MSCI tracking. These projects issued 294 million credits during the year and more than 2.6 billion credits since the Paris Agreement was signed in 2016.

However, not all supply is valued equally.

Markets are increasingly rewarding project types that demonstrate permanence, measurability, and strong governance. As a result, growth is accelerating in carbon engineering and nature restoration, while traditional renewable energy projects are losing market share.

In fact, despite higher retirement volumes, the market value of renewable energy credits fell by more than 25% year over year. This contrast highlights how price—not volume—is now driving value.

Near-Term Outlook: Slow but Steady Growth

Looking ahead, MSCI modeling suggests that the carbon credit market will begin to expand gradually in the second half of the 2020s, before accelerating more strongly after 2030.

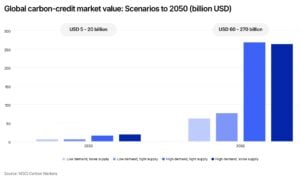
By the end of this decade, the market could be worth between $5 billion and $20 billion, depending on demand strength and supply constraints. While this range is wide, it reflects growing uncertainty around quality, regulation, and buyer preferences rather than weak fundamentals.

Several forces support this outlook. First, corporate climate commitments are growing rapidly. Around 1,300 companies have pledged to reach carbon neutrality by 2030 or earlier. Meanwhile, more than 12,000 companies now have approved or committed Science Based Targets (SBTi)—a nearly 70% increase in just one year.

As these targets approach, companies will need to address residual emissions, creating sustained demand for credible offsets.

Regulation Will Broaden Demand

Beyond corporate buyers, regulation is becoming a major demand driver.

The Carbon Offsetting and Reduction Scheme for International Aviation (CORSIA) will enter its second compliance phase in 2027, bringing more consistent demand from airlines. At the same time, companies in regulated markets are increasingly using credits to offset carbon taxes or comply with emissions trading systems.

MSCI estimates that demand from regulated schemes could reach 45 to 180 MtCO₂e by 2030, driven by programs such as California’s Cap-and-Trade and Australia’s Safeguard Mechanism, as well as new national systems.

In parallel, governments are exploring how carbon credits can support Nationally Determined Contributions (NDCs) under the Paris Agreement and future Article 6 mechanisms. This adds another layer of long-term demand stability.

Long-Term Outlook: Big Growth, Big Differences

By 2050, projected market outcomes diverge sharply. Depending on how demand evolves and how tight high-quality supply becomes, the value of retired credits could range from $60 billion to $270 billion.

This wide gap highlights one central theme: credit quality will define the market’s future.

In scenarios where buyers prioritize high-integrity credits, market value grows faster because prices remain strong. In contrast, scenarios flooded with lower-quality supply show weaker confidence, lower prices, and slower growth.

carbon credit demand

Removal-based credits, especially engineered solutions like direct air capture and biochar, are expected to play a growing role. Although they are more expensive, they align closely with long-term net-zero strategies and offer greater durability.

What This Means for Investors

For investors, the message is clear. The carbon market is becoming larger, more complex, and more selective.

Value is no longer spread evenly across projects. Instead, it is concentrating on high-quality segments that demonstrate strong science, governance, and permanence. Exposure to removal-based solutions and advanced project types is likely to matter more over time.

As the buyer base expands to include corporates, regulated sectors, and sovereigns, carbon credits are shifting from a niche climate tool to a core component of the global transition economy.

In short, the carbon credit market is no longer just growing—it is maturing.

The post Carbon Credit Market Heads Toward $270 Billion by 2050 as Quality Reshapes Demand appeared first on Carbon Credits.


Why BlackRock Flags AI as a New Stress Test for Clean Energy in 2026

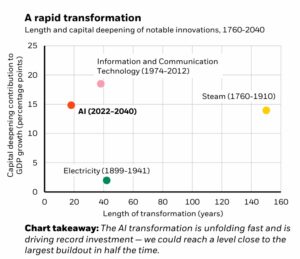
Artificial intelligence is no longer a niche technology story. By 2026, it will become a defining force for energy systems, emissions pathways, and long-term climate strategy. BlackRock’s 2026 Global Outlook makes this clear: AI is now deeply tied to sustainability outcomes.

The rapid expansion of AI infrastructure is changing how electricity is produced, where capital flows, and how climate risks are managed. At the same time, AI offers tools that could improve efficiency and reduce emissions across the global economy. The challenge is timing and scale. AI’s energy demand is rising fast, while clean energy systems are still catching up.

How these two trends intersect will shape the climate impact of digital growth.

AI’s Power Appetite Is Growing Fast

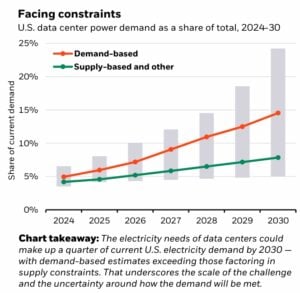
AI systems require massive computing power. Large language models, real-time data processing, and advanced analytics all depend on data centers that operate around the clock. As these systems scale, electricity demand rises sharply.

BlackRock expects AI-driven investment to become a structural source of power demand by 2026. This demand will not be temporary. It will be embedded into the global energy system for years to come.

And the climate risk is straightforward. If data centers rely on fossil-fuel-heavy grids, emissions rise. If they run on clean power, AI can grow without pushing emissions higher. This makes energy sourcing one of the most important climate decisions in the AI economy.

Clean Power Becomes Core Infrastructure: Will Capital Allocation Shape Climate Outcomes?

AI is changing the role of clean energy across the global economy. Renewable power is no longer just a climate solution. It is becoming essential infrastructure for digital growth.

As AI systems scale, data centers require a stable, reliable, and continuous electricity supply. Solar, wind, nuclear, and energy storage offer long-term supply with lower carbon exposure. Because of this, companies are increasingly locking in long-term clean power agreements. These contracts help cut both price volatility and emissions risk.

From an investment perspective, this shift is already reshaping capital flows. AI-driven growth is accelerating investment in clean energy assets that are directly linked to digital infrastructure. Clean power is no longer treated as a sustainability add-on. Instead, it is emerging as a core business requirement.

AI investment
Source: BlackRock

More importantly, this trend highlights a deeper issue. Where capital flows will determine whether AI supports or undermines climate goals. Investment in clean generation, grid expansion, energy storage, and low-carbon baseload power will become increasingly critical as digital demand rises.

BlackRock’s report underscores the growing role of long-term capital in shaping sustainable outcomes. Climate-aligned finance can help steer AI growth toward cleaner and more resilient systems. However, this only works if investments follow clear standards and credible emissions reporting.

Without transparency, sustainability claims lose credibility. And without credibility, the link between AI growth and climate progress begins to weaken.

The Carbon Cost Comes First

While AI may support long-term efficiency, its early climate impact is not positive. Building AI infrastructure requires heavy upfront investment in data centers, servers, transmission lines, and advanced chips. These rely on steel, cement, and energy-intensive manufacturing.

Emissions rise during the construction phase. BlackRock highlights this imbalance clearly. Capital spending happens now, while productivity and efficiency gains arrive later.

This timing gap matters for climate strategy. Without efforts to cut emissions during construction, AI risks locking in higher near-term emissions even if long-term benefits follow.

us data center energy demand AI
Source: BlackRock

AI’s Role in Cutting Emissions

Despite these risks, AI also offers powerful tools to support decarbonization. AI systems can improve grid management, predict renewable output more accurately, and reduce energy waste across industries.

In transport, AI can cut fuel use through smarter routing and logistics. In manufacturing, it can optimize processes and lower energy intensity. Across supply chains, it can reduce waste and improve resource efficiency.

The climate benefit depends on scale. Small efficiency gains applied across large systems can deliver meaningful emissions reductions. BlackRock sees productivity growth as a key pathway for lowering emissions intensity over time.

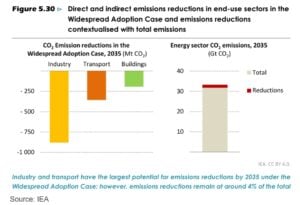
  • In the IEA’s “Widespread Adoption” case, AI-enabled solutions could cut up to 1.4 gigatonnes (Gt) of CO₂ emissions per year by 2035—about 5x more than data center emissions in that same year.

AI emissions

The Energy Transition Faces Pressure

AI and the energy transition are now tightly linked. One cannot advance without the other.

The report also warns that power grids, transmission networks, and permitting systems remain major constraints. If these systems fail to expand fast enough, AI demand could strain the electricity supply and slow decarbonization.

This risk is already visible in regions where data center growth outpaces grid upgrades. Without faster investment in clean generation and infrastructure, AI could compete with other sectors for limited low-carbon power.

Rethinking Diversification: Is Climate Risk Concentrated in AI Investments?

AI is changing how investors think about risk. Many assets now depend on the same digital and energy infrastructure, which makes them more vulnerable to climate events. Heatwaves, water shortages, or grid failures can disrupt multiple sectors at once, creating concentration risk that traditional diversification may not fully address.

BlackRock’s outlook highlights the need for investors to look beyond labels and focus on real-world dependencies and climate exposure. In an AI-driven economy, resilience is becoming just as important as returns, as the stability of digital and energy systems directly influences financial performance.

Private Markets as a Climate Accelerator

Much of the infrastructure required to support AI and sustainability sits outside public markets. Grid upgrades, energy storage, and efficiency improvements often rely on private capital, which can move faster and take on longer-term investment horizons.

This makes private markets well-suited to fund climate-critical infrastructure linked to AI growth. At the same time, strong governance is essential to ensure these investments meet emissions targets and genuinely support sustainable outcomes. Without oversight, the promise of private capital may fail to deliver real climate impact.

Redefining Growth in 2026: Can AI Deliver Sustainable Value?

Markets alone cannot resolve the tension between AI growth and climate goals. Government policy plays a decisive role in shaping outcomes. Faster permitting, modernized grids, and support for low-carbon power can remove bottlenecks and ensure digital expansion aligns with sustainability targets.

Thus, AI is redefining what sustainable growth means. It is no longer just about increasing economic output; it is about boosting efficiency, improving resilience, and reducing emissions intensity.

By 2026, AI will no longer be climate-neutral. Its environmental impact will depend on the energy systems behind it and the investment choices made today. BlackRock’s message is clear: AI can either exacerbate climate risks or help manage them. The difference lies in how quickly clean energy scales and how decisively sustainability is integrated into digital growth.

In the AI era, climate strategy is no longer optional. The alignment between policy, capital, and technology will determine whether AI strengthens or undermines the energy transition.

The post Why BlackRock Flags AI as a New Stress Test for Clean Energy in 2026 appeared first on Carbon Credits.
From Emissions to Removal: Why Carbon Sink Cities Are the Next ESG Frontier

Cities drive the world’s economy. They also drive most of its emissions. Urban areas account for more than 70% of global greenhouse gases, but a new roadmap says they can flip the script. Instead of being the biggest source of pollution, cities can become powerful climate solutions—functioning as carbon sink cities that actively remove more CO₂ than they emit.

The “Pathways to Carbon Sink Cities: Implementation Guide 2025,” released by the City CDR Initiative, lays out a practical plan to make that future real. The guide moves beyond vision statements and academic modeling. Instead, it focuses on implementation—how cities can integrate carbon removal directly into planning, infrastructure, finance, governance, and everyday urban life.

Rethinking Cities as Carbon Removers, Not Just Emitters

The core idea is simple but transformational. Cities no longer need to think only about reducing emissions. They can remove carbon at scale using:

  • Direct air capture systems on rooftops and public buildings
  • Enhanced rock weathering in streets and construction materials
  • Biomass strategies like biochar and algae systems
  • Nature-based sinks like urban forests, wetlands, and green roofs

This is the third report in a broader effort. Earlier editions mapped the vision and identified capability gaps. This new guide delivers the operational blueprint.

Crucially, the report stresses that urban carbon removal does more than fight climate change. It supports adaptation, improves air quality, boosts public health, enhances biodiversity, and strengthens city resilience. As global carbon markets tighten, the report argues that cities investing in CDR today stand to benefit economically tomorrow.

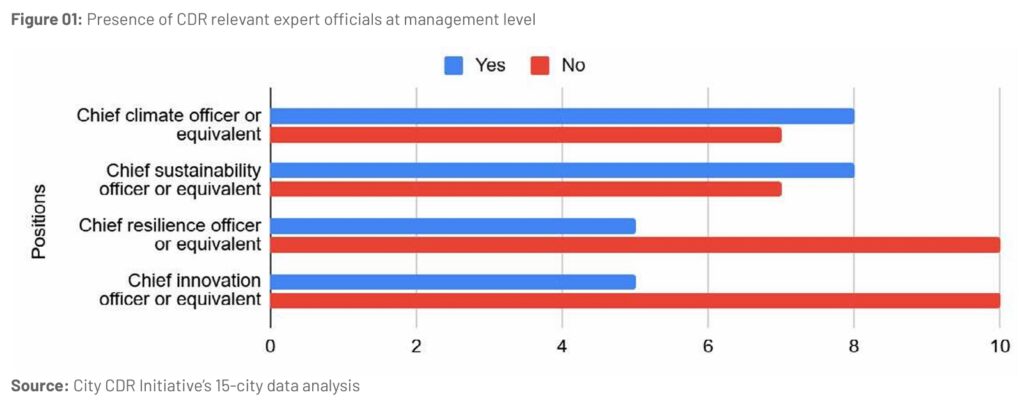
carbon sink cities CDR

Deployment Pathways: From Pilots to Gigaton-Scale Removal

Urban spaces may feel crowded, but the guide shows there is significant hidden potential. It highlights city-ready CDR pathways already close to commercial viability.

Engineered systems include modular DAC units that can integrate into rooftops, transport hubs, and energy facilities. Enhanced weathering can be embedded into pavements and parks. Meanwhile, biological approaches like algae bioreactors in wastewater plants and perennial biomass in vertical farms deliver added sustainability value.

The report outlines a realistic growth curve:

  1. Pilot Phase: Start with low-risk, low-cost installations in public spaces.
  2. Expansion Phase: Incentivize private sector adoption through tax benefits and carbon revenue.
  3. Integration Phase: Embed CDR directly into zoning, building codes, and infrastructure plans.

Beyond climate impact, many of these systems deliver co-benefits. DAC installations can help cool buildings. Urban forests improve mental health, reduce heat, and clean local air. These benefits strengthen community support and political momentum.

Governance: The Hardest Challenge—and the Biggest Enabler

Technology alone will not build carbon sink cities. Governance determines success.

The guide calls for multi-stakeholder coalitions, bringing together governments, utilities, real estate players, financial institutions, and local communities. It introduces a “City CDR Readiness Assessment” to help municipalities evaluate infrastructure suitability and regulatory gaps.

Key policy tools include:

  • CDR quotas built into building codes
  • Dedicated CDR funds using green bonds, grants, and carbon revenues
  • Digital MRV platforms using satellites, IoT sensors, and AI
  • Bulk procurement programs to reduce cost for smaller businesses

Case studies across 20 cities show that shared energy service contracts and pooled procurement dramatically accelerate uptake, especially for small and mid-sized companies.

Urban Carbon Credits: Turning City CDR into a Market Opportunity

Urban CDR is more than a climate goal—it is quickly becoming a strong market opportunity. The guide explains that city-based carbon credits could earn premium prices because they are easier to verify, offer long-term permanence, and deliver real community benefits. Instead of depending on one funding source, cities can use several routes.

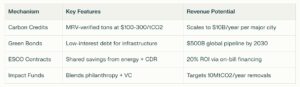
These include Article 6–aligned international crediting, blended finance supported by public funds and impact investors, performance-based contracts that pay only for verified removals, and large public-private partnerships like those already taking shape in Shanghai.

Investors Eye Urban CDR

Investors are paying attention. Rising compliance demand, a recovering voluntary market, and supportive policies such as the U.S. Inflation Reduction Act and EU frameworks are helping build confidence. Early projections suggest scalable pilots could deliver returns of 15% to 25%, turning CDR into both a climate solution and an attractive investment space.

With President Trump’s administration pushing energy dominance while IRA-backed incentives remain influential, U.S. cities could become major DAC hubs. At the same time, Asia’s mega-cities hold a strategic advantage thanks to strong industrial ecosystems and access to mineral supply chains, positioning them as powerful players in the next wave of urban carbon removal.

A Realistic Roadmap to 2040 Net-Sink Cities

The report lays out a three-phase roadmap:

  • Phase 1 (2025–2027):
    Cities prepare infrastructure, build workforces, and launch 10–20 pilots each.
  • Phase 2 (2028–2035):
    Policy mandates drive scale. Cities target removal equal to 1–5% of their emissions annually.
  • Phase 3 (by 2040):
    Urban CDR integrates fully with AI-enabled management, pushing cities into net-sink status.

Challenges remain. Land scarcity is real. Costs are uneven. But hybrid solutions—like DAC plus solar installations along highways—and equity funds for low-income communities help balance deployment.

Shanghai’s Qingpu New Town offers a glimpse of what’s possible. A study of its central business district showed that under a high-quality development pathway, emissions peak by 2028 and fall by over 47% by 2040. With integrated scenario planning, green buildings, smart mobility, storage, and urban sinks, its model can guide global replication.

CARBON CREDITS
Source: City CDR Initiative

The Investment Signal: Cities as the Next Frontier of Carbon Markets

Analysis suggests the CDR market, currently valued at approximately $2 billion, is projected to expand to $50 billion by 2030 and potentially exceed $250 billion by 2035. Compliance buyers, corporate climate commitments, and rapid urbanization would power it.

Risks exist—such as technology maturity, policy swings, and MRV complexity—but diversified deployment spreads exposure and strengthens resilience.

For ESG investors, infrastructure planners, and climate strategists, carbon sink cities are more than a climate concept. They represent a new class of climate asset—where sustainability, resilience, and financial returns align.

Cities built the modern world. Now they may be the ones that help save it.

The post From Emissions to Removal: Why Carbon Sink Cities Are the Next ESG Frontier appeared first on Carbon Credits.
How China’s Carbon Market Is Fueling Asia’s Biggest Climate Finance Opportunity

Asia is stepping into a powerful new phase of climate leadership. Once dominated by fragmented pilot programs and uneven policies, the region’s carbon markets are now evolving into ambitious, interconnected systems. Together, they could help bridge an estimated $800 billion annual climate finance gap while accelerating the global push toward net zero.

The latest World Economic Forum (WEF) report, “Asia’s Carbon Markets: Strategic Imperatives for Corporations 2025,” sends a clear message. Carbon markets are not just compliance tools. They are strategic engines that can deliver cost savings, innovation, risk protection, and competitive advantage. With China’s emissions trading system (ETS) projected to reach tens of billions in value by 2030 and regional cooperation accelerating, companies that move early could unlock big wins. Those who delay risk losing ground in the fast-moving decarbonization race.

Asia’s Carbon Markets: Big Emissions, Bigger Opportunity

Asia produces more than half of the world’s greenhouse gas emissions and drives around 55% of global GDP. Yet regional carbon markets currently cover only a fraction of Asia’s emissions. That gap signals massive untapped potential.

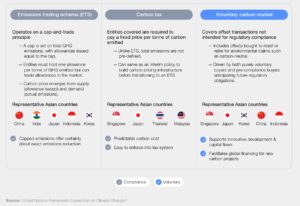
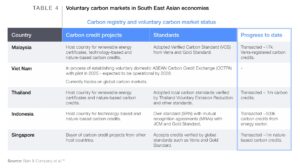
Today, Northeast Asia leads the charge. Japan runs cap-and-trade and voluntary mechanisms. South Korea operates a strong national ETS. China, the region’s heavyweight, continues to expand its national ETS and relaunched its Chinese Certified Emissions Reduction (CCER) program to support high-quality offsets. Meanwhile, Singapore’s carbon tax is gaining global attention, and ASEAN is pushing toward common frameworks to support cross-border trading. Japan’s Joint Crediting Mechanism (JCM) also showcases how bilateral cooperation can unlock climate finance while supporting partner countries.

China’s latest climate commitments mark a major turning point. The country aims to reduce economy-wide emissions below peak levels by 2035 while expanding ETS coverage to sectors like steel, cement, and aviation. Demand for CCER credits could reach 300–500 million tonnes per year by 2030, boosting liquidity while still keeping integrity in focus.

India, Indonesia, Vietnam, and other Southeast Asian nations are also pushing ahead. However, fragmentation, inconsistent rules, and uneven standards still hold back efficiency. This is where Article 6 of the Paris Agreement becomes essential. It provides the legal foundation to enable credible international carbon trading, prevent double counting, and facilitate market connections across borders.

The Path to Regional Carbon Market Integration

The WEF outlines a practical roadmap to transform Asia’s patchwork of systems into a powerful regional network. This approach centers on trust, transparency, and high-integrity climate outcomes.

  1. Build a Regional Carbon Market Council
    A coordinated governance body could align standards, share data, settle disputes, and push long-term collaboration. Think of it as an “ASEAN-plus” climate platform with real authority.
  2. Harmonize Rules and Methodologies
    Markets need a common language. Aligning monitoring, reporting, verification (MRV), additionality benchmarks, and eligibility rules would allow companies to trade with confidence across markets from Tokyo to Jakarta.
  3. Invest in Digital Infrastructure
    Digital registries, blockchain systems, and AI-driven verification tools can help reduce fraud, speed transactions, and build trust. Better technology means faster trading and cleaner data.
  4. Launch Cross-Border Carbon Trading Corridors
    Strategic bilateral pilots—such as expanding Japan-Singapore cooperation—can prove what works, create confidence, and show real economic value.
  5. Reward Early Movers
    A structured acceleration program could support companies that invest early in cross-border market initiatives, helping scale high-quality climate projects while unlocking fresh capital.

If done right, these steps could mobilize billions of dollars for Asia’s energy transition. They could also help direct investment to countries with lower-cost abatement options, creating a fairer and more efficient climate finance ecosystem.

Why Corporations Need to Act Now

For businesses, carbon markets are no longer simply about ticking regulatory boxes. They influence competitiveness, pricing, investment choices, and long-term business survival. The WEF identifies three key corporate imperatives.

Imperative 1: Engage Early
Companies that enter markets sooner gain strategic advantages. They can hedge price risks, secure high-quality offsets, and prepare for tighter future rules. Firms in China or Korea, for example, can already use offsets to meet part of their compliance needs—often at far lower costs than internal abatement.

Imperative 2: Reinvent Supply Chains
Carbon exposure does not stop at factory gates. Businesses need to understand emissions across suppliers and logistics chains. Partnering on climate projects—such as reforestation, renewable energy, biochar, or methane reduction—can create new value streams while managing regulatory risk. Early action may also shield exporters from potential cross-border carbon taxes in markets like Europe.

Imperative 3: Transform Business Strategy
Carbon must move from sustainability departments into boardroom decision-making. Companies are beginning to apply internal carbon prices, often around $50 per tonne, to guide investment. This shifts capital toward electrification, efficiency upgrades, carbon capture, and other future-proof technologies. Studies already show significant financial upside when firms integrate market strategy with decarbonization planning.

company net zero
Source: WEF Asia’s_Carbon Markets Strategic Imperatives for Corporations 2025

China: The Region’s Powerhouse

China remains the anchor of Asia’s carbon market story. Its ETS already covers power emissions at an unprecedented scale and is set to expand to heavy industries by mid-decade. Analysts expect coverage to reach 8.7–10.6 billion tonnes by the late 2020s.

china vcm
Source: WEF Asia’s Carbon Markets Strategic Imperatives for Corporations_2025.

Meanwhile, the CCER revival focuses on quality. Key areas include forestry, renewables, and methane capture. Many projects are being designed to align with Article 6 eligibility, opening the door to potential international demand as global buyers look for credible reductions.

China is also tightening rules. Benchmarks are expected to strengthen steadily by 2026, prompting industries to decarbonize more rapidly. That means corporate strategy matters. Companies preparing now—by improving efficiency and securing offsets—will stand stronger when compliance pressure rises.

Opportunities, Risks, and the Global Impact

Asia’s carbon integration could reshape global climate economics. The region has the potential to supply 1–2 gigatonnes of credits annually, helping cut global decarbonization costs and improving access to finance.

Yet challenges remain. Differences in baselines and accounting systems raise risks of double-counting. Political tensions could disrupt cooperation. Market credibility will depend on strong regulation, transparency, and trust.

Still, momentum is real. New coalitions, government partnerships, and private sector investments continue to build confidence. Asia is moving from experimentation to execution.

asia carbon mnarket

The Bottom Line: Move Now or Fall Behind

Asia’s carbon markets are accelerating toward a defining moment around 2026. Policies are tightening. Digital systems are improving. Cross-border cooperation is growing. And corporations are realizing that carbon strategy equals business strategy.

Companies cannot afford to wait. They should:

  • Audit emissions and compliance exposure
  • Explore trading opportunities and pilot projects
  • Engage policymakers and industry platforms
  • Invest in credible, high-quality climate solutions

Those who act early will shape markets, reduce risks, and build competitive strength in a trillion-dollar low-carbon economy. Those who hesitate may find themselves outpaced in a decarbonizing world.

Asia is no longer just part of the climate story. It is becoming the engine of the next chapter.

The post How China’s Carbon Market Is Fueling Asia’s Biggest Climate Finance Opportunity appeared first on Carbon Credits.

DOE’s $2.7 Billion Push for Uranium Enrichment Rebuilds U.S. Energy Security

The United States is taking a decisive step to rebuild its nuclear fuel supply chain. The Department of Energy has announced a $2.7 billion investment over the next decade to expand domestic uranium enrichment. This move aims to strengthen energy security, reduce dependence on foreign suppliers, and support the next phase of nuclear power growth.

The announcement also reflects a shift in how the U.S. views nuclear energy. Once seen mainly as a legacy power source, nuclear is now positioned as a strategic solution for rising electricity demand, artificial intelligence growth, industrial resilience, and long-term climate goals.

Secretary of Energy Chris Wright said:

“President Trump is catalyzing a resurgence in the nation’s nuclear energy sector to strengthen American security and prosperity. “Today’s awards show that this Administration is committed to restoring a secure domestic nuclear fuel supply chain capable of producing the nuclear fuels needed to power the reactors of today and the advanced reactors of tomorrow.”

To understand why this matters, it helps to look at how DOE is deploying the funding and at where the U.S. stands today.

How the DOE Is Deploying the Funding

Last year, the DOE signed contracts with six enrichment companies, allowing them to compete for future work. Now, the department has awarded task orders to three companies under a strict milestone-based structure to ensure accountability.

  • American Centrifuge Operating received $900 million to establish domestic HALEU enrichment capacity.
  • General Matter also received $900 million to develop HALEU production.
  • Orano Federal Services secured $900 million to expand LEU enrichment within the United States.

Together, these projects will help maintain fuel supplies for the nation’s 94 operating nuclear reactors. At the same time, they will create a foundation for future advanced reactors that are still moving through development and licensing.

Importantly, this funding not only supports fuel production. It also drives job creation, strengthens domestic manufacturing, and restores confidence in the U.S. nuclear ecosystem.

HALEU Changes the Nuclear Equation and the U.S. Must Act on Uranium Enrichment

Uranium enrichment plays a critical role in nuclear power. Most U.S. reactors operate on low-enriched uranium, or LEU. However, advanced reactors, including small modular reactors and next-generation designs, require high-assay low-enriched uranium, known as HALEU.

For years, the U.S. relied heavily on foreign enrichment services. In fact, the country currently performs less than 1% of global uranium enrichment. This reliance has raised serious concerns about energy security and supply reliability, especially as new rules will restrict imports of Russian uranium starting in 2028.

As a result, rebuilding domestic enrichment capacity has become urgent. The DOE’s $2.7 billion investment directly addresses this vulnerability by accelerating U.S.-based production of both LEU and HALEU.

us uranium nuclear reactor

Upstream Supply Remains a Weak Link

While enrichment capacity is expanding, upstream uranium production still faces challenges.

EIA revealed that, in the third quarter of 2025, U.S. uranium concentrate production fell to 329,623 pounds of U₃O₈, a sharp drop from the previous quarter. Production came from only six facilities, mainly located in Wyoming and Texas.

This decline highlights a broader issue. Rebuilding the full nuclear fuel cycle requires coordinated growth across mining, processing, enrichment, and fuel fabrication. Progress in one area must be matched by investment in others.

U.S. Uranium

Orano’s Oak Ridge Project Anchors to DOE Funding

One of the most significant projects tied to the DOE funding is Orano’s planned enrichment facility in Oak Ridge, Tennessee.

Known as the IKE project, the facility will provide a new domestic source of enriched uranium. Orano plans to finalize contracts and submit its license application to the U.S. Nuclear Regulatory Commission in the first half of 2026.

Once operational, the plant will help U.S. utilities comply with regulations that ban Russian uranium imports after 2028. It will also support rising electricity demand linked to AI, data centers, and broader electrification.

Nicolas Maes, Chief Executive Officer of Orano, commented,

“This is excellent news for Orano and a decisive step forward on our project for an enrichment plant in the USA! This recognition by the US authorities is an illustration of the confidence they have in our expertise and our capacity to deploy our technology to ensure robust security of supply to our customers.”

AI Growth Shows Why Nuclear Matters

Beyond energy security, another powerful force is shaping this investment: artificial intelligence.

As AI systems grow more complex, demand for computing power continues to surge. Data centers require vast amounts of electricity that must be reliable, affordable, and available around the clock. Renewable energy alone often cannot meet this need without firm backup power.

This is where advanced nuclear reactors come into play. General Matter has highlighted that AI leadership depends on expanding both compute capacity and electricity production. Gen IV small modular reactors, fueled by HALEU, can provide steady power either directly to data centers or through the grid.

By powering AI infrastructure behind the meter, nuclear reactors reduce pressure on public grids while delivering low-carbon electricity. As a result, nuclear fuel is increasingly seen as a critical input for the digital economy.

AI demand
Source: McKinsey

Keeps Industry and Remote Sites Running

Nuclear energy powers U.S. manufacturing, supplying factories, refineries, and heavy industries with stable, affordable electricity. Disruptions can slow production and raise costs, so a reliable LEU supply is essential. Today, reactors provide nearly 20% of U.S. electricity and almost half of emissions-free power.

Small, containerized microreactors fueled by HALEU are emerging for remote or harsh locations, including military bases, mining sites, and disaster zones. These systems run long with minimal maintenance, delivering dependable power and driving demand for HALEU, strengthening America’s domestic nuclear fuel infrastructure.

The Future of Enrichment Goes Laser-Fast

To support long-term innovation, the DOE also awarded $28 million to Global Laser Enrichment (GLE). The company is advancing the SILEX laser enrichment technology, which promises higher efficiency and lower energy use compared to traditional methods.

GLE has reached Technology Readiness Level 6 and has submitted a full license application for its Paducah facility. If deployed commercially, laser enrichment could significantly improve the economics and flexibility of nuclear fuel production.

Taken together, these developments signal a strategic reset. The DOE’s $2.7 billion investment reflects a clear decision to treat nuclear fuel as a national priority. By strengthening domestic enrichment, supporting advanced reactors, and backing innovation, the U.S. is positioning nuclear energy as a cornerstone of its future energy system.

In an era defined by AI growth, rising electricity demand, and climate pressure, nuclear power is no longer just part of the mix. It is becoming a central pillar of American progress.

The post DOE’s $2.7 Billion Push for Uranium Enrichment Rebuilds U.S. Energy Security appeared first on Carbon Credits.
Bitcoin ETFs Rebound with $697M as Blockchain Brings Trust to Carbon Markets

Bitcoin ETFs Rebound with $697M as Blockchain Brings Trust to Carbon Markets

Bitcoin ETFs are making a comeback, attracting billions in inflows, while blockchain is revolutionizing carbon markets. Both show how trust, transparency, and technology can reshape financial and environmental markets alike.

Bitcoin ETFs Are Back in the Spotlight

Bitcoin ETFs are back in the spotlight. These funds allow people to invest in Bitcoin through regular stock markets. No need to buy or store Bitcoin yourself.

On January 5, 2026, U.S. spot Bitcoin ETFs saw $697 million in new inflows. This was the biggest one-day gain in three months. BlackRock’s iShares Bitcoin Trust (IBIT) led with $287 million.

Other big funds like Fidelity and Ark added $471 million combined. Bitcoin’s price jumped to $92,500 right after. This shows that big investors are regaining confidence in crypto after a shaky 2025.

bitcoin price jan 2026

These ETF inflows signal real confidence. Big players like pension funds check everything twice before investing. ETFs offer rules, clear reports, and safe storage. This beats holding Bitcoin on your own.

To put it in perspective, in 2025, these ETFs reached $120 billion in total value. Year-to-date inflows already hit $1.1 billion, rebounding from last year’s large outflows. The story here is clear: investors want exposure to Bitcoin but in a safe, regulated way.

Trust is the Common Denominator

Bitcoin ETFs and carbon trading share one big need: trust.

ETFs win trust through regulators like the SEC. They report daily holdings and fees. Investors see exactly what they own. This transparency reassures big institutions and retail investors alike.

Similarly, carbon trading relies on trust. Companies trade carbon credits to cut pollution. One credit equals one ton of CO2 cut or removed. But old systems often use paper or weak databases. Hackers or errors can fake data. This undermines deals and confidence.

This is where blockchain comes in. Blockchain is a shared digital ledger: No one can change entries once added. Smart contracts are automatic programs on the blockchain. They execute trades instantly when rules are met, and so no middlemen are needed.

A new study proves this approach works.

Blockchain Powers Carbon Trading: Study Findings

Researchers Wang and Peng tested blockchain for listed companies’ carbon data. They used over 5,000 records from Kaggle on energy use, emissions, and prices. Their system achieved 97.5% data integrity. No tampering was possible. It also cut transaction times to 79 milliseconds per trade—literally milliseconds.

This shows blockchain doesn’t just secure data, it also speeds up markets. Smart contracts remove delays and automate verification.

Carbon Markets Go Digital

Carbon trading is a major tool to cut global emissions. In 2025, compliance markets hit $900 billion. That’s 95% from mandatory schemes like the EU ETS. Voluntary markets added another $2 billion. Over 70 countries now use carbon pricing.

Yet, problems slow things down. Manual checks take weeks, and fakes can slip through. Blockchain changes this. Every trade is stored forever safely. Smart contracts automatically check emission proofs, and credits move instantly to buyers.

The referenced study put this theory into practice. The researchers cleaned data with Z-score math, then used KPCA to spot key patterns in emissions and prices. Their DCSLSO algorithm optimized trades and outperformed rivals by 26.8% in cost savings.

flow of the carbon allowance performance

Key Wins From the Study

Their tests showed:

  • 97.5% data accuracy remains perfect.
  • 96% of trades are fully visible to regulators.
  • 21.34% better emission cuts achieved.
  • 15.72% higher trading profits.
  • 92.41% energy efficiency.

They also simulated real-world chaos: carbon prices from $20–35/ton, energy spikes, and multi-fuel mixes. The system stayed stable. Carbon prices trended around $30/ton, with mid-range trades (50–200 tons) dominating.

These results highlight that blockchain systems can handle real market conditions while maintaining transparency, speed, and efficiency.

From Lab to Real-World Markets

Pilots already show blockchain works. Toucan Protocol tokenized 50 million tCO2e on the blockchain in 2025. KlimaDAO trades nature credits instantly, with no fakes.

In the study, DCSLSO outperformed competitors. Table 1 illustrates clear savings and emission improvements. There are six in total; only three are chosen for quick comparison.

blockchain carbon trading benefits
Source: Weng & Pang study

Lower numbers are better. DCSLSO saved $710 on emissions alone versus the best rival.

Stacking the Benefits

Digital tools improve both markets with these advantages:

  • Security: Blockchain stops fraud; ETFs lock assets safely.
  • Speed: Trades execute in 79 ms; ETFs settle in T+1 days.
  • Access: Small firms can trade carbon; retail investors can buy ETFs.
  • Reporting: Auto-logs cut audit time by 50%.
  • Stability: Immutable data calms nerves; regulated ETFs attract $120B AUM.

Carbon credits update live with no delays. Moreover, ETFs make Bitcoin safer for investors of all sizes.

Hurdles on the Digital Highway

Even with these innovations, the road ahead is not without obstacles. Blockchain and ETFs bring clear benefits, but they also require careful management and planning. For instance, standards remain a key issue.

Blockchains only work efficiently when different networks and systems follow the same protocols. Without shared rules, it becomes difficult for companies and regulators to link systems, slowing adoption and limiting transparency.

Regulation is another hurdle. Governments must provide clear guidance to allow smart carbon trading to operate legally and safely. While ETFs already function under strict U.S. oversight, new blockchain-enabled carbon markets still need standardized laws to ensure credibility and protect participants.

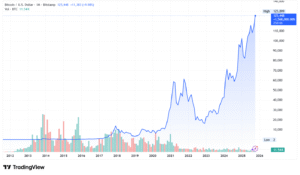
Volatility also poses challenges. Bitcoin ETFs are not immune to market swings. In the past months, Bitcoin prices have jumped to peaks of $126,000, then dipped again, reflecting how fast investor sentiment can change. Such fluctuations can affect both fund inflows and overall market stability.

bitcoin price

Energy use is another concern. Traditional Proof-of-Work chains consume significant power, which could counteract sustainability goals. Moving toward Proof-of-Stake or other energy-efficient protocols will be essential for green carbon markets. 

What the Future Holds for Blockchain and Carbon Credits

Still, the future looks promising for the industry. Blockchain can make carbon trading faster, safer, and more transparent, as the study shows. Thus, Bitcoin ETFs may continue attracting institutional and retail investors, bridging traditional finance with crypto.

As these systems mature, markets will be more reliable and inclusive. Small firms can trade carbon credits easily, and investors can access regulated ETFs. Ultimately, innovation in blockchain and ETFs is shaping a low-carbon future where trust, speed, and sustainability go hand in hand.

The post Bitcoin ETFs Rebound with $697M as Blockchain Brings Trust to Carbon Markets appeared first on Carbon Credits.

BYD Overtakes Tesla as World’s Biggest EV Seller in 2025

BYD Overtakes Tesla as World's Biggest EV Seller in 2025

In 2025, China’s automotive maker BYD became the world’s largest seller of electric vehicles (EVs), overtaking U.S. EV pioneer Tesla for the first time. Data from multiple industry trackers shows that BYD sold about 2.26 million battery electric vehicles (BEVs) in 2025.

In contrast, Tesla delivered about 1.64 million EVs in the same year, marking a decline from its 2024 figures. This shift marks a major change in the global EV market.

From Challenger to Market Leader: BYD’s Breakthrough Year

BYD’s EV sales showed strong momentum throughout 2025. Its pure battery electric vehicle deliveries rose by roughly 28% year on year, reaching more than 2.25 million units worldwide. This steady growth allowed BYD to move ahead of Tesla in total annual BEV sales.

Tesla, by comparison, reported a decline of about 9-10% in overall vehicle deliveries versus the previous year. As a result, 2025 marked the first full calendar year in which BYD sold more battery electric vehicles than Tesla.

BYD vs TESLA ev sales 2025

The gap became more visible in the second half of the year. Demand for EVs softened in some of Tesla’s key markets, particularly as higher interest rates and reduced incentives affected consumer spending. BYD, however, continued to benefit from strong demand in China and improving sales abroad.

By year’s end, the gap in total EV deliveries between the two companies grew to several hundred thousand units. This marked a clear shift in market leadership.

Quarterly data reinforced this trend. In the fourth quarter of 2025, Tesla delivered around 418,000 vehicles, representing a 15–16% drop from the same period in 2024. This decline reflected slower sales growth and increased competition.

BYD’s fourth-quarter BEV deliveries, in contrast, continued to rise. Its consistent quarterly growth helped push its full-year sales past Tesla’s and confirmed its position as the world’s largest EV seller by volume.

Why China’s EV Champion Is Scaling Faster

Several factors helped drive BYD’s expansion in global EV sales during 2025. A key driver was strong domestic demand in China, the world’s largest electric vehicle market.

Chinese automakers lead in local EV sales. This is thanks to consumer trust in domestic brands and a strong charging network in big cities. BYD benefited directly from this environment.

From January to November, industry estimates China’s NEV wholesale sales are about 13.78 million units. This shows a 29% increase compared to last year, and BYD captured a dominant 32% domestic share. This home-market strength fueled its global BEV leadership.​

China passenger new EV sales

The product range also played an important role. BYD offers a wide lineup of EV models, including many lower-priced options that appeal to cost-conscious buyers. These vehicles attracted customers looking for practical electric cars rather than premium models. This broader appeal helped BYD reach a larger customer base than some competitors.

At the same time, BYD’s exports hit 1.05 million units in 2025, up 200% from the previous year. Europe and Latin America are key drivers of this growth. Globally, BYD claimed 12.1% of the BEV market in 2025, ahead of Tesla’s 8.8% and Volkswagen’s 5.2%, cementing the competitive shift.

Competitive pricing and improving vehicle quality helped BYD gain traction in these markets. Policy support also contributed, as incentives and trade policies in several regions made imported EVs more competitive.

Together, these factors allowed BYD to sustain sales growth even as demand softened for some rival brands.

Tesla Under Pressure in a Crowded EV Arena

Tesla’s sales declines in 2025 were linked to several challenges, including:

  • Reduced demand after EV tax incentives ended in the United States, particularly the federal EV tax credit that expired in late 2025. This had encouraged buyers to purchase earlier in the year.
  • Stronger competition from Chinese brands, not only BYD but also other manufacturers, is entering global markets.
  • Market saturation in some regions, where potential customers postponed purchases or chose alternatives.

Tesla remains a major EV maker, but it saw its first consecutive annual drop in deliveries. By contrast, BYD increased its volume while expanding into new regions.

The EV Market Is Still Growing—But Leadership Is Shifting

The global EV market continues to grow, with total EV sales rising annually as more countries push toward cleaner transport. Analysts see strong demand for electric cars continuing this decade. Climate goals and stricter emissions rules in many areas support this trend.

Industry forecasts say global EV deliveries might keep growing until 2030. This growth is due to lower battery costs and more models from various automakers.

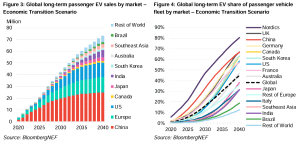
Industry forecasts project global EV sales reaching 40–50% of total car sales by 2030, up from ~20 million units in 2025. Battery pack prices have fallen to $115/kWh in 2024. They could further drop to $80–$99/kWh by 2026 (50% decline), enabling price parity with gas cars.

global long-term EV sales by market 2040

Nations in Europe and Asia are pushing zero‑emission vehicle targets as part of their climate commitments, which may further expand EV adoption.

Europe targets 90% CO2 cut by 2035 for new cars (easing from 100%, allowing some e-fuels/PHEVs). China aims for ~60–90% EV/NEV sales by 2030.

Still, challenges remain. EV buyer incentives vary by country and can affect sales patterns, as seen in the U.S. when federal credits expired. Some regions face infrastructure gaps, like limited charging networks, which can slow growth. Continued cost reductions and broader infrastructure rollouts will be key to sustaining EV adoption long term.

Emissions, Energy, and the Bigger Climate Picture

Electric vehicles are central to efforts to reduce greenhouse gas emissions from transport by 70–90% over their lifecycle compared to gasoline cars. This holds even with current grids.

  • For EVs, emissions range from 200–500 gCO2/km, while ICEVs emit 200–300 gCO2/km.

Global transport represents 24% of CO2 emissions (8 GtCO2e). EVs could slash this by 40% by 2030 at 40% adoption. Clean grids, renewables >60% by 2030, boost EV advantage to near-total decarbonization.

Source: IEA

Also, EVs produce zero tailpipe emissions and can lower overall carbon output when charged with renewable electricity. As more power grids shift toward clean energy sources, the lifetime emissions advantage of EVs grows.

BYD’s sales surge contributes to this global transition. As one of the largest EV producers, its growth means more EVs are on the road worldwide. This supports international efforts to cut emissions from passenger cars, which remain a major source of global greenhouse gases.

However, the environmental impact of EV manufacturing, especially battery production, remains a focus of industry and policy discussions. Sustainable practices in sourcing materials and recycling batteries will be crucial to maximizing the environmental benefits of EV growth.

A New Global Auto Order Takes Shape

BYD’s rise to the top reflects broader changes in the global auto sector:

  • Chinese carmakers are gaining ground internationally, not just in their home market.
  • Competition in EV segments is increasing, pushing companies to innovate faster on cost, range, and technology.
  • Tesla’s leadership is challenged, even as it pushes into areas like autonomous driving and energy products.

The shift also highlights how consumer preferences are evolving, with buyers showing strong interest in different EV brands and models beyond traditional market leaders. As EV technology matures, more brands are expected to capture market share and expand globally.

The post BYD Overtakes Tesla as World’s Biggest EV Seller in 2025 appeared first on Carbon Credits.

NTPC Partners with Rosatom and EDF, Sparking a Nuclear Energy Revolution in India

India is taking bold steps to expand its nuclear energy capacity, aiming to secure a stable, low-carbon power supply for the future. As per reports, India’s largest power producer, NTPC, recently signed non-disclosure agreements (NDAs) with Russia’s state-owned Rosatom and France’s Electricité de France (EDF) to explore collaborations on large-scale Pressurized Water Reactor (PWR) projects.

These exploratory agreements are intended to cover the full lifecycle of nuclear projects—from design and construction to operation and maintenance—while prioritizing domestic technology development and manufacturing.

The move reflects India’s growing electricity needs and its commitment to climate goals. Nuclear power is seen as a reliable complement to intermittent renewable sources like solar and wind, offering steady baseload energy. Analysts see NTPC’s engagement with Rosatom and EDF as a clear signal that India plans to accelerate nuclear growth through international partnerships. Through its nuclear arm, NTPC Parmanu Urja Nigam, the company targets 30 GW of nuclear capacity by 2047.

india nuclear
Source: Department of Atomic Energy, India

Global Expertise Meets Indian Execution

Rosatom and EDF are global leaders in PWR technology, with proven track records in large-scale nuclear projects. By combining their expertise with NTPC’s local execution capabilities, India hopes to create a model that maximizes local value and strengthens domestic nuclear know-how. While the NDAs are non-binding, they set the stage for detailed technical and commercial evaluations, including the potential localization of key components and training of Indian engineers.

Recent government reforms have also made nuclear energy more attractive to private and international players. Laws such as the SHANTI Bill, passed in late 2025, eased liability rules and opened doors for private sector participation in a sector historically dominated by public entities.

Union Budget 2025-26 and Nuclear Priorities

The Union Budget 2025-26 highlighted nuclear energy as a cornerstone of India’s long-term energy strategy. The government set an ambitious goal of achieving 100 GW of nuclear capacity by 2047. This vision aligns with India’s broader energy transition under the “Viksit Bharat” initiative, which aims for energy security, reduced fossil fuel dependency, and a cleaner environment.

A major feature of the budget was the launch of the Nuclear Energy Mission for Viksit Bharat. This initiative focuses on research, development, and deployment of advanced nuclear technologies, including SMRs.

Significantly, the government allocated $2.4 billion to develop at least five indigenously designed SMRs by 2033. These reactors are intended to provide flexible, scalable, and low-carbon power, especially in remote areas or for repurposing retiring coal plants.

Bharat Small Reactors: Local Solutions for Industrial Power

Alongside SMRs, India is expanding its use of Bharat Small Reactors (BSRs). These 220 MW Pressurized Heavy Water Reactors (PHWRs) are designed for safety, performance, and reduced land requirements, making them ideal for deployment near industrial hubs such as steel and aluminium plants. Private companies provide land, cooling water, and capital, while the Nuclear Power Corporation of India Limited (NPCIL) handles design, quality assurance, and operations. This model blends private investment with public oversight to accelerate nuclear deployment and support India’s decarbonization goals.

The development of BSRs complements India’s renewable energy targets. By 2030, India aims to generate 500 GW from non-fossil fuel sources and meet 50% of energy needs from renewables, as pledged at COP26.

Small Modular Reactors: A Flexible Future

SMRs offer a transformative approach to nuclear power. With capacities ranging from 30 to over 300 MWe, they are smaller, faster to build, and more adaptable than traditional reactors. SMRs can be manufactured in factories and deployed in modular units, reducing construction time and costs. Their flexible design allows them to serve both grid-connected and off-grid applications, helping stabilize India’s power supply while complementing renewables.

India’s expertise with PHWRs provides a solid foundation for developing indigenous SMRs. The government plans to integrate SMRs into the energy mix to address land constraints, reduce reliance on fossil fuels, and meet climate commitments under the Paris Agreement.

Expanding Nuclear Capacity Across India

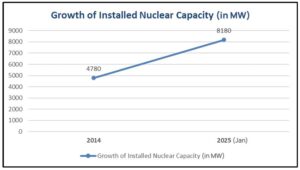
  • India’s nuclear capacity stood at 8,180 MW as of January 2025.

The government plans to increase this to 22,480 MW by 2031-32 through the construction of ten reactors across Gujarat, Rajasthan, Tamil Nadu, Haryana, Karnataka, and Madhya Pradesh.

Pre-project activities for ten more reactors are also underway, aiming for progressive completion by 2031-32. In addition, India signed a preliminary agreement with the USA to establish a 6×1208 MW nuclear power plant in Kovvada, Andhra Pradesh.

A milestone in domestic nuclear capability was achieved on September 19, 2024, when Rajasthan Atomic Power Project’s Unit-7 (RAPP-7) reached criticality. This marked a controlled fission chain reaction in one of India’s largest and third indigenous nuclear reactors, underscoring the country’s growing ability to design, build, and operate reactors.

Safety, Innovation, and Domestic Uranium Resources

Safety remains a core priority. Indian nuclear plants operate under strict protocols, with radiation levels consistently below international benchmarks. At the same time, India is exploring new technologies such as high-temperature gas-cooled reactors for hydrogen co-generation and molten salt reactors to harness thorium, which is abundant domestically.

Other recent developments include the discovery of new uranium deposits at the Jaduguda Mines, extending the life of India’s oldest uranium mine by over fifty years. Commercial operations have begun for two 700 MWe PHWR units at Kakrapar, Gujarat, and the Prototype Fast Breeder Reactor (PFBR 500 MWe) has achieved key milestones in 2024, including primary sodium filling and core loading.

NTPC and NPCIL have also signed a supplementary joint venture, ASHVINI, to develop new nuclear facilities, including the 4×700 MWe PHWR Mahi-Banswara Rajasthan Atomic Power Project. These initiatives illustrate India’s commitment to leveraging both international collaboration and domestic expertise to grow its nuclear sector.

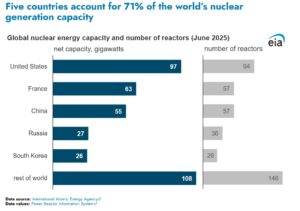
World nuclear generation

India is rapidly transforming its nuclear energy landscape. By combining global expertise with domestic innovation, promoting SMRs and BSRs, and easing regulatory barriers, the country is set to meet growing energy demand while cutting carbon emissions.

The Nuclear Energy Mission for Viksit Bharat positions India as a future leader in advanced nuclear technology, contributing to energy security, environmental sustainability, and long-term economic growth. With a clear roadmap and international partnerships, India’s nuclear power journey is poised for a significant surge toward its 2047 goals.

The post NTPC Partners with Rosatom and EDF, Sparking a Nuclear Energy Revolution in India appeared first on Carbon Credits.
China’s EV Export Explosion: How a Domestic Price War Is Reshaping the Global Auto Market

China’s electric vehicle (EV) industry entered 2026 with momentum—and mounting pressure. At home, a fierce price war cut margins to the bone. Abroad, Chinese automakers pushed harder than ever, flooding global markets with low-cost EVs and hybrids. The result was a historic export surge that is now reshaping trade flows, competitive dynamics, and the global auto hierarchy.

A Record Export Surge Signals a Strategic Shift

Bloomberg reported that China’s EV exports jumped 87% year-over-year to nearly 200,000 units in November, according to customs data. This was not a one-off spike. It reflected a deliberate pivot away from an overcrowded domestic market toward overseas growth.

Automakers faced brutal competition at home. Discounts deepened. Profitability shrank. As a result, exports became a lifeline. For many companies, overseas markets now serve as the main buffer against falling domestic sales.

This export push also revealed a sharp understanding of global trade rules. Chinese brands did not simply ship more cars. They shipped the right cars to the right places.

CHINA EV Sales
Source: EV talks

Mexico Emerges as an Unexpected Gateway

Mexico became the biggest surprise in China’s export map. Bloomberg further revealed that, in November alone, the country imported 19,344 Chinese electric vehicles. It marked a staggering 2,300% surge year-over-year, making it the top destination for Chinese EV exports that month

This growth reflected strategic timing. While the United States imposed a 100% tariff on Chinese EVs, Mexico maintained looser trade barriers. That made it an attractive entry point into North America’s broader automotive ecosystem.

Thus, Chinese manufacturers used Mexico not only as a sales market but also as a potential production and logistics hub. In a fragmented global trade environment, flexibility became a competitive advantage.

Europe’s Tariffs Fail to Stop Chinese Brands

Europe also remained a critical battleground. Despite new tariffs, Chinese carmakers captured a record 12.8% share of Europe’s EV market in November, the highest level ever recorded.

The European Union imposed extra duties ranging from 17% to over 35% on Chinese battery-electric vehicles after a subsidy investigation. In theory, the move aimed to shield European automakers from low-cost imports. In practice, it created a loophole.

Plug-in Hybrids Become the Trojan Horse

The tariffs targeted only fully electric vehicles. Plug-in hybrids faced just the standard 10% import duty. And Chinese brands reacted fast.

Chinese automakers shifted aggressively into plug-in hybrids. Exports of these vehicles to Europe soared, rising sixfold year-over-year at one point in 2025.

In hybrid categories, Chinese brands achieved a market share of over 13% across the EU, EFTA countries, and the UK. They also surpassed Korean automakers for the first time, marking a significant shift in the competitive landscape.

BYD led the charge. Its European registrations more than tripled year-over-year, nearly matching Tesla’s monthly sales. The BYD Seal U quickly became one of Europe’s top-selling plug-in hybrids. SAIC Motor’s MG brand also expanded rapidly, delivering hundreds of thousands of vehicles across the region.

European demand itself remained strong. EV registrations across the continent rose sharply, proving that growth was not coming at the expense of market expansion—but from intensified competition.

NEV sales

China Overtakes Japan in Global Auto Sales

The export boom contributed to a broader milestone. As per industry reports, in 2025, Chinese automakers are projected to sell around 27 million vehicles globally, surpassing Japan for the first time in over two decades.

This shift marks a historic turning point. Just three years earlier, Japan outsold China by millions of vehicles. Now, Chinese brands dominate growth charts, powered by EVs and plug-in hybrids that account for the majority of new passenger vehicle sales at home.

BYD and Geely both climbed into the global top ten automakers, signaling China’s arrival as a full-spectrum automotive superpower.

Pressure Builds Across Asia, Europe, and Emerging Markets

Chinese exports surged across Southeast Asia, Latin America, and Africa. In Thailand, long dominated by Japanese brands, market share erosion accelerated. In Latin America and Africa, Chinese vehicles gained ground as affordability and rapid rollout trumped brand loyalty.

Japanese automakers felt the strain. Profits declined. Capacity utilization weakened. The challenge went beyond tariffs—it cut to the heart of competitiveness in the EV era.

Export Growth Masks Domestic Weakness

While exports surged, cracks widened at home. BYD, China’s largest EV maker, recorded declining domestic sales for three straight months in late 2025.

To stay competitive, the company slashed prices across its lineup. Some models saw cuts of more than 30%. Entry-level EVs fell to prices once considered impossible, intensifying what industry analysts describe as “involution”—destructive competition that destroys value without creating new demand.

Exports helped offset these losses. In November alone, BYD shipped a record number of vehicles overseas, underlining how critical foreign markets have become to China’s EV giants.

The EV giant also began shipping production equipment to its new plant in Hungary in late 2025. Trial production is expected in early 2026, with mass manufacturing planned shortly after. The facility will initially focus on compact models designed for European buyers.

This move allows Chinese brands to sidestep import duties while embedding themselves deeper into regional supply chains. It also raises the stakes for European manufacturers already struggling with cost pressures and slower innovation cycles.

As tariffs pushed Chinese automakers to think beyond exports, local production emerged as the next phase of their global strategy.

The Bigger Picture: Trade, Technology, and Power

China’s EV export surge tells a larger story. Price wars at home forced companies to become leaner, faster, and more aggressive globally. Tariffs reshaped product strategies but failed to stop expansion. Plug-in hybrids, local factories, and emerging markets became tools of adaptation.

As 2026 unfolds, the global auto industry faces a new reality. China no longer competes only on volume. It competes on speed, strategy, and scale. And for rivals, the pressure is only beginning.

The post China’s EV Export Explosion: How a Domestic Price War Is Reshaping the Global Auto Market appeared first on Carbon Credits.