Chinese EV Makers Sell Carbon Credits to Porsche and Other Europe’s Auto Giants

Chinese EV Makers Sell Carbon Credits to Porsche and Other Europe’s Auto Giants

Chinese electric-vehicle makers are finding a new way to monetize their lead in electrification: selling regulatory carbon credits to global automakers that need them to meet emissions rules. XPENG is the latest example.

The Chinese EV maker has signed carbon credit agreements with Porsche and other international automakers covering the European Union, the UK, and Australia, according to recent reports. The total transaction value is expected to exceed 1 billion yuan ($149 million), while XPENG expects to receive more than 500 million yuan ($74.5 million) from carbon-credit trading in 2026. An XPENG vice president confirmed the figures publicly.

The development points to a wider shift in the global auto industry. Chinese manufacturers are no longer only exporting electric cars. Their growing EV sales are also creating regulatory assets that other automakers can use to manage fleet emissions.

Europe’s Carbon Rules Put a Price on EV Advantage

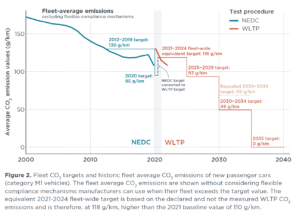
The European Union’s CO₂ rules are the main driver behind this market. Under the current framework, new passenger cars registered in the EU face a fleet-wide target of 93.6 grams of CO₂ per kilometer for 2025–2029. The target falls to 49.5 g/km from 2030 to 2034, before reaching 0 g/km from 2035 under the existing regulation.
EU-CO2-standards
Source: ICCT

Automakers can form emissions pools. This allows manufacturers with lower fleet emissions to combine their results with manufacturers that have higher emissions. The system creates a financial value for automakers that sell large numbers of zero-emission vehicles.

The EU also applies an excess-emissions premium of €95 for each gram of CO₂ per kilometer above the applicable target for each new vehicle, subject to the rules governing the relevant compliance period. For manufacturers selling large numbers of higher-emission vehicles, surplus credits from EV-heavy manufacturers can therefore have significant financial value.

The system is already operating at scale. In 2025, several major automakers formed pools involving Tesla, while Mercedes established a pool involving Volvo Cars, Polestar and Smart. 

XPENG is now entering this market as a supplier of compliance capacity.

XPENG and Porsche Open a New China-Europe Link

The most notable agreement involves Porsche.

According to an official European Commission filing cited in recent reporting, Porsche withdrew from the Volkswagen Group’s internal emissions pool and established an independent, open pool for 2026 and 2027, with XPENG as a key partner. Financial terms have not been disclosed.

The structure is important because Porsche has a large portfolio of performance and premium vehicles, while XPENG’s fleet is centered on battery-electric vehicles.

  • In a regulatory emissions pool, the calculation is straightforward: more zero-emission vehicles can lower the average emissions of the combined fleet.

XPENG therefore gains another source of revenue from its EV sales without needing to sell the credits as conventional voluntary carbon offsets. That distinction matters.

These are regulatory CO₂ compliance credits, created by vehicle-emissions rules. They are not the same as voluntary carbon credits generated by projects such as forests, methane capture, or direct air capture.

China’s EV Boom Is Creating the Credit Supply

XPENG’s ability to generate credits comes from the rapid expansion of its electric vehicle business. The International Energy Agency estimates that global electric car sales exceeded 20 million units in 2025, up 20% from 2024. One in four new cars sold worldwide was electric.

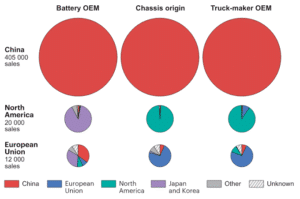
China remained the largest EV market, with more than 13 million electric cars sold in 2025. Nearly 55% of all new cars sold in China were electric. Chinese manufacturers also accounted for 60% of global electric car sales in 2025.
china ev market share
Source: IEA

The production advantage is just as large. China produced about 16 million electric cars in 2025, nearly 75% of global EV output. Chinese electric car exports more than doubled to over 2.5 million units.

Europe is becoming an increasingly important destination.

Sales of Chinese-made electric cars in Europe increased by almost 50% in 2025 to about 940,000 units, according to the IEA. Chinese brands accounted for more than 70% of Chinese-made EV imports into the EU, up from 50% in 2023. This expanding overseas EV fleet is also expanding the potential pool of regulatory credits.

XPENG’s Global EV Expansion Adds Another Revenue Stream

XPENG’s overseas business is expanding rapidly. The company delivered 45,008 vehicles outside China in 2025, up 96% year over year, while total deliveries reached 429,445, up 126%. It was selling vehicles in 60 countries and regions by year-end.

In Q2 2026, overseas sales topped 20,000 vehicles for the first time, up 81% year over year. Overseas revenue accounted for more than 25% of first-half revenue, with an average selling price above €40,000.

XPENG has also expanded its partnership with Volkswagen, which acquired a 4.99% stake for about $700 million in 2023. Their first jointly developed model entered mass production in March 2026.

The growing overseas EV business can therefore support both vehicle sales and XPENG’s ability to generate compliance value in regulated markets.

Leapmotor Shows XPENG Is Not Alone

XPENG is not the first Chinese automaker to monetize surplus emissions performance. Leapmotor transferred EU carbon credits to Stellantis for European and UK sales, generating 1.11 billion yuan ($165 million) in 2025. Its 2026 credit trading cap was later raised to 2.8 billion yuan ($417 million).

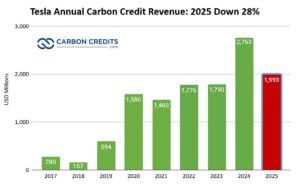
Tesla has used the same model for years, reporting about $2 billion in regulatory credit revenue in 2025, down from $2.76 billion in 2024.
Tesla carbon credit revenue 2025

For EV makers, regulatory credits can provide additional revenue. For automakers with higher fleet emissions, they can offer another compliance tool. However, their value remains dependent on emissions rules, pooling arrangements, and future regulatory changes.

XPENG’s Carbon Strategy Extends Beyond Credit Sales

XPENG’s carbon strategy extends beyond regulatory credits. Its 2025 ESG report targets a 9% reduction in lifecycle carbon emissions per passenger vehicle by 2027 from 2023 levels, alongside a 38% reduction in operational carbon emissions intensity.

The company aims for carbon neutrality across its product lifecycle and corporate operations by 2050.
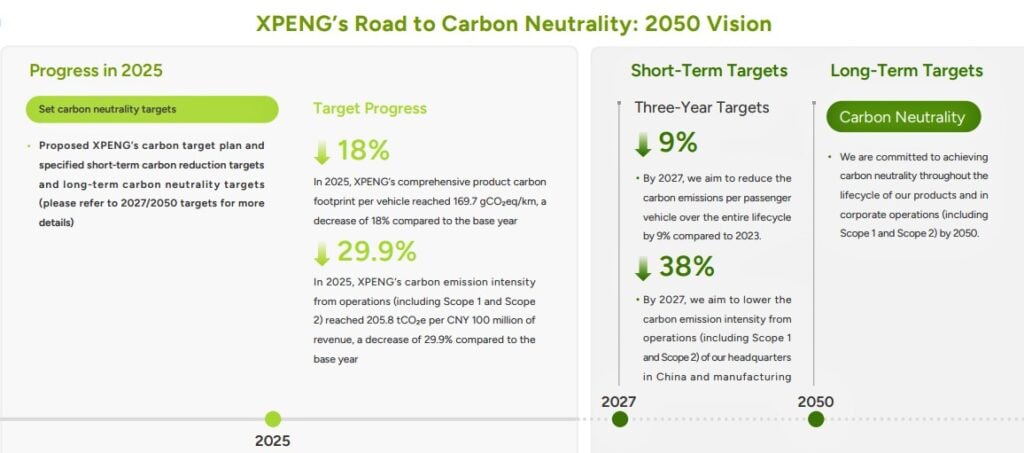
XPENG’s Road to Carbon Neutrality 2050 Vision
Source: XPENG

In 2025, XPENG reported a product carbon footprint of 169.7 grams of CO₂e per kilometer, down 18% from 2023. Operational carbon emissions intensity fell 29.9% to 205.8 tonnes of CO₂e per CNY 100 million.

It also recorded 73,000 MWh of clean energy consumption and 106,000 MWh of photovoltaic generation. XPENG estimates its 2025 vehicles will avoid more than 6 million tonnes of lifecycle greenhouse-gas emissions compared with conventional vehicles.

More EVs Mean a Bigger Compliance Credit Pool

The expanding EV market provides the underlying supply of these compliance assets. The IEA expects global electric-car sales to reach about 23 million vehicles in 2026, or roughly 28% of total car sales. EVs could account for about one-third of European sales and nearly 60% of China’s market.

  • By 2035, the global EV fleet could exceed 450 million vehicles under the IEA’s Current Policies Scenario.

Europe’s fleet is also becoming cleaner. Average CO₂ emissions from new passenger cars fell 28% between 2019 and 2024, while zero-emission vehicles accounted for 14.5% of new registrations in 2024.

As EV adoption rises and emissions rules tighten, the market for regulatory carbon credit transfers could expand.

Chinese EV Makers Are Turning Electrification Into a New Asset Class

XPENG’s agreements with Porsche and other international automakers show how China’s EV advantage is creating a new source of commercial value. Chinese EV exports exceeded 2.5 million vehicles, and Europe imported about 940,000 Chinese-made EVs.

Against this backdrop, XPENG expects more than 500 million yuan ($74.5 million) in carbon credit revenue in 2026. For European automakers, these credits provide another compliance tool as emissions standards tighten. For Chinese EV makers, they create an additional revenue stream from their growing zero-emission vehicle fleets.

Chinese automakers are therefore increasingly selling not only electric vehicles into Europe, but also the emissions-compliance value created by those vehicles.

The post Chinese EV Makers Sell Carbon Credits to Porsche and Other Europe’s Auto Giants appeared first on Carbon Credits.

How Canada’s New ITMO Framework Could Unlock International Carbon Markets

Canada is exploring a new policy framework that could let Canadian companies participate in international carbon markets by trading internationally transferred mitigation outcomes (ITMOs).

The federal government announced the initiative on September 24, saying an ITMO framework could attract investment into Canadian climate projects, expand demand for carbon removal and nature-based solutions, and create new export opportunities for Canadian companies.

The move comes as international carbon markets develop under Article 6 of the Paris Agreement. At the same time, countries and companies are looking for ways to finance emissions reductions and carbon removals as they work toward net-zero targets.

For Canada, the opportunity is particularly significant because the country combines large natural resources, geological storage capacity, clean electricity and established expertise in energy and industrial infrastructure.

Canada’s Emissions Create a Large Decarbonization Challenge

Canada still has a substantial emissions-reduction challenge.

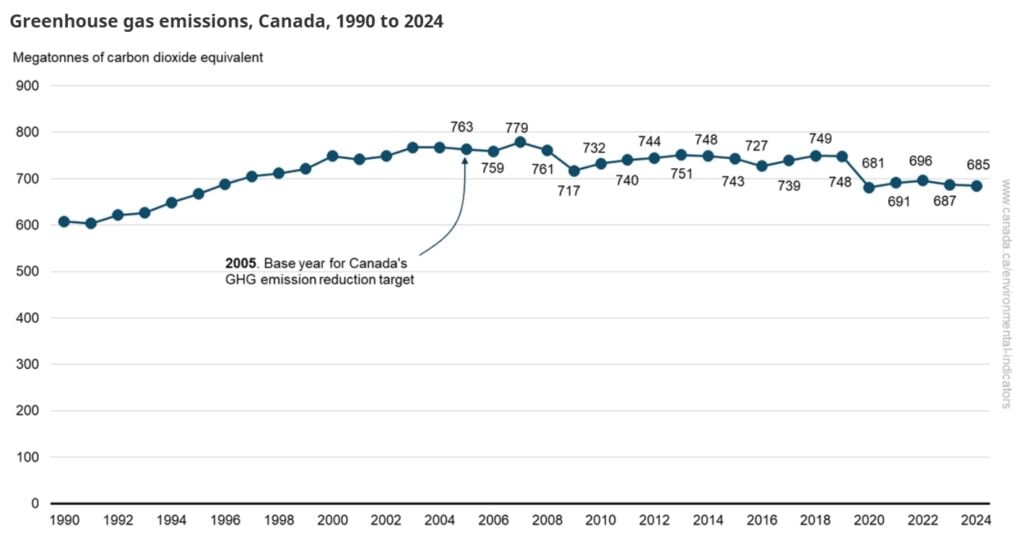
The country emitted about 685 million metric tons (Mt) of greenhouse gases in 2024, excluding emissions and removals from the land-use, land-use change and forestry sector. That was down 0.3% from 2023 and 10.3% below 2005 levels.

Oil and gas remained Canada’s largest source of emissions. The sector accounted for 208 Mt in 2024, although emissions have declined from their 2014 peak. Electricity emissions have fallen much more sharply, dropping 57% between 2005 and 2024 as Canada reduced coal-fired generation.

  • Canada’s government projects that emissions could fall to 600 Mt by 2030 under its “With Measures” scenario. Under a more ambitious “With Additional Measures” scenario, emissions could reach 546 Mt by 2030.

These figures show why Canada will need a combination of emissions reductions, carbon removal and other climate solutions to reach net zero.

An international market could provide another source of capital for some of those activities.

Canada emission

What Are ITMOs and Why Do They Matter?

ITMOs are internationally transferred mitigation outcomes created under Article 6.2 of the Paris Agreement.

In simple terms, one country can authorize the transfer of an emissions reduction or removal to another country under a cooperative approach. The receiving country can then use the mitigation outcome toward its climate target, subject to the applicable Article 6 accounting rules.

The system is designed to prevent the same emissions reduction from being counted toward the climate targets of both countries. This process, known as a corresponding adjustment, is central to maintaining the environmental integrity of international transfers.

Canada’s proposed framework would establish how these transfers could operate in the Canadian context.

The government said it will work with provinces and territories, Indigenous organizations and other stakeholders while developing the potential framework. It also said any ITMO trading would have to follow Article 6 rules, including requirements related to additionality, verification, permanence and avoiding double counting.

International Carbon Markets Are Expanding

Canada is considering the framework as carbon pricing and carbon-credit systems expand globally.

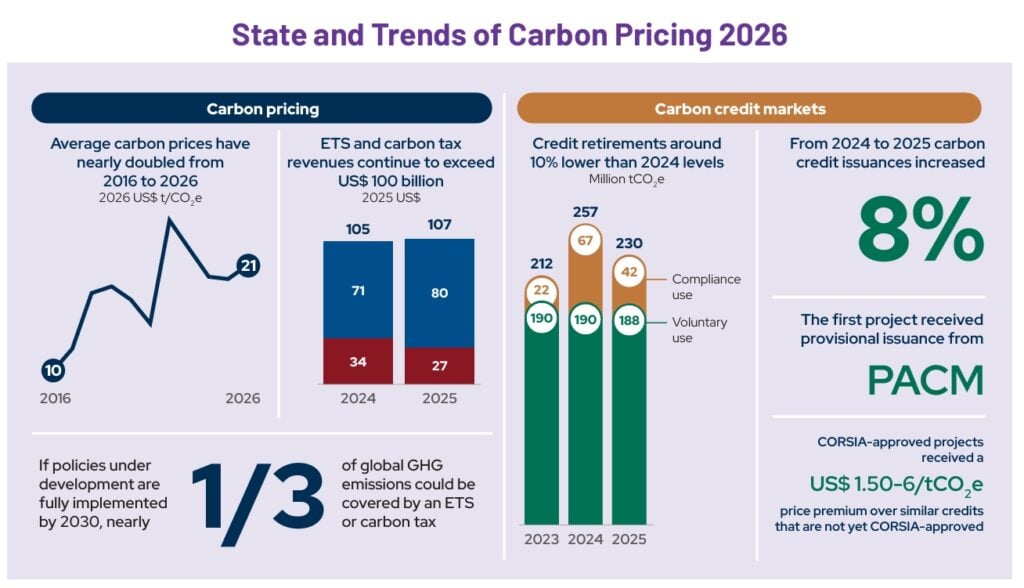
The World Bank’s 2026 State and Trends of Carbon Pricing report found that 87 carbon-pricing policies were operating worldwide, seven more than the previous year. Direct carbon pricing now covers nearly 30% of global greenhouse gas emissions, while carbon pricing generated more than $107 billion in public revenue in 2025.

The broader carbon-credit market is also attracting investment. The World Bank estimates that annual capital committed to future carbon-credit projects ranged from $12 billion to $16 billion in 2025.

The estimated annual value of traded carbon credits was about $535 million in 2024, although this figure covers a narrower segment of the overall carbon market than carbon taxes and emissions trading systems.

canada emission carbon market

The growth opportunity extends beyond today’s market.

The World Bank’s international carbon-market research has highlighted the potential for carbon markets to mobilize climate finance, particularly where domestic public funding cannot cover the investment needed for emissions reductions and removals.

Other market research has projected that voluntary carbon-credit demand could grow several-fold by 2030, while the World Bank’s Emission Reduction Program has cited estimates of a $10 billion to $40 billion voluntary carbon market by 2030 under one industry scenario.

This expanding market could create opportunities for countries that can supply credible emissions reductions and carbon removals.

Canada Sees Carbon Removal as an Economic Opportunity

Carbon removal is one area where Canada could potentially benefit from international demand.

  • Carbon Removal Canada has estimated that a large-scale domestic carbon removal industry could generate significant economic activity by 2050.
  • Its earlier modelling suggested that a Canadian industry capable of removing more than 300 Mt of CO₂ annually could create more than 330,000 jobs and add about $143 billion to GDP.
  • More recent modelling from the organization estimates that carbon removal could add $78 billion to Canada’s annual GDP by 2050 and create or support about 300,000 jobs.
canada carbon removal
Source: Carbon Removal Canada

Canada has several resources that could support this expansion. These include geological formations suitable for CO₂ storage, clean electricity, agricultural and forestry resources, industrial infrastructure and a workforce with experience in engineering, energy and large-scale construction.

Carbon removal technologies such as direct air capture and bioenergy with carbon capture and storage could therefore become part of Canada’s emerging clean-technology export industry.

ITMOs Could Bring More Capital Into Canadian Projects

The proposed ITMO framework could give developers another potential route to monetize verified emissions reductions and removals.

For example, a Canadian project could generate an eligible mitigation outcome, receive the required authorization, and transfer it internationally under an Article 6.2 agreement. Revenue from that transfer could help support project development and potentially improve the economics of technologies that remain expensive at early stages.

Nature-based projects could also benefit if they meet the requirements.

However, international transfers require more than simply creating a carbon credit. Countries need systems to authorize activities, track units, report transactions, and apply corresponding adjustments. These requirements are intended to ensure that a transferred mitigation outcome is not counted twice.

That accounting framework could also provide greater certainty for investors and buyers.

canada itmo

Canada Wants to Turn Climate Technology Into an Export Opportunity

The Honourable Julie Dabrusin, Minister of the Environment, Climate Change and Nature, said international ITMO trading could help Canadian companies attract capital and expand climate technologies.

She quoted:

“The trading of ITMOs under the Paris Agreement can unlock greater global climate action by making it easier to transfer emission reductions and removals between countries. This is about turning our natural advantages and homegrown climate innovation into investment, good jobs, and new export opportunities. A clear framework for international carbon credit transfers can help Canadian companies scale, attract capital, and bring more innovative technologies to market, strengthening our position as a leader in the global clean economy.”

$13 Billion in International Climate Finance

The government is also linking the initiative to more than $13 billion in international climate finance announced through the Spring Economic Update.

For Canada’s carbon market, the proposed framework could therefore represent more than a new trading mechanism. It could connect Canadian climate projects and technologies with international sources of demand and finance.

The framework is still under development, and its final rules will determine which projects and mitigation outcomes can participate. Canada will need to balance market access with rigorous accounting and environmental safeguards as it develops the system.

If implemented, the framework could give Canadian carbon removal developers, technology companies, and nature-based projects another potential pathway into the growing international market for emissions reductions and removals.

The post How Canada’s New ITMO Framework Could Unlock International Carbon Markets appeared first on Carbon Credits.
Salesforce and Milkywire Back 3,661 Tons of Carbon Removal Across 8 Projects

Salesforce is supporting new early-stage carbon dioxide removal (CDR) projects. The company aims to contract $100 million in durable carbon removal by 2030.

Through Milkywire, Salesforce has pre-purchased 3,661 tonnes of durable carbon removal from eight suppliers. This portfolio includes direct air capture (DAC), ocean alkalinity enhancement, and biomass storage. Projects are located in Europe, Canada, India, and the U.S.

The press release says these purchases follow a larger round announced in January, where Milkywire bought over 12,500 tonnes from 19 suppliers. That earlier portfolio featured biochar, BioCCS, enhanced rock weathering, mineralization, biomass storage, and next-generation DAC.

Therefore, the company is not only focusing on commercially available carbon removal. Instead, it uses Salesforce funding to support technologies that need testing and investment.

Salesforce Aims for Early-Stage Carbon Removal

Salesforce plans to contract $100 million in high-durability CDR credits by fiscal 2031, aligning with 2030. The company started investing in early-stage CDR suppliers through partners like Milkywire and Frontier in FY25.

The strategy addresses a major challenge in the carbon removal market. Many new technologies require years of development before they can deliver large volumes of verified removals. Startups often struggle to get funding during this early stage.

Early purchases can provide revenue and help developers prove their technology.

Salesforce carbon credits
Source: Salesforce

“Catalytic” Purchasing

Milkywire calls this approach “catalytic” purchasing. Instead of buying the most tonnes available, it targets projects where early funding can advance technology.

For Salesforce, these purchases fit into a broader climate strategy. The company plans to use durable carbon removal credits to offset its remaining emissions after reducing them across its value chain. It aims for durable carbon removals to equal 100% of its remaining Scope 1, 2, and 3 emissions by 2040.

salesforce emissions
Source: Salesforce

Four Projects Boost Direct Air Capture

Four of the eight purchases support direct air capture projects at various stages.

  • Sirona Technologies is developing a commercial DAC project that integrates a heat pump. The goal is to test if this can improve energy efficiency in DAC.
  • Yama operates France’s first DAC pilot and is creating a facility to remove 365 tonnes of CO₂ each year.
  • In the Netherlands, Brineworks combines electrochemical DAC with green hydrogen production. This method captures CO₂ while creating another low-carbon product.
  • Deep Sky in Canada is developing a DAC project that combines carbon capture with mineralization at Thetford Mines in Quebec. Mineralization stores CO₂ in solid forms for long-term storage.

These projects tackle the challenge of reducing energy use and costs in removing CO₂ directly from the atmosphere.

Ocean Carbon Removal Expands

The new portfolio also features two ocean alkalinity enhancement (OAE) projects.

OAE aims to boost the ocean’s capacity to absorb and store CO₂ by adding alkaline materials. This method is still emerging, with developers working to show its effectiveness and scalability.

PRONOE runs the EU’s first land-based OAE system linked to an industrial desalination plant.

In India, Alkamy Carbon is using wastewater treatment facilities in the Mumbai area to enhance alkalinity. This project should provide valuable data on wastewater-based alkalinity in tropical conditions.

The India project is crucial because carbon removal developers need more real-world data from diverse climates. This data helps researchers understand how these methods perform in different environments.

Biomass Storage Provides Another Pathway

The last two purchases focus on storing biomass in durable forms.

Carba converts waste biomass into stable biocarbon before burying it in landfills. This process prevents carbon in organic waste from quickly re-entering the atmosphere.

Cowboy Clean Fuels injects agricultural residues into unmineable coal seams in Wyoming. Microorganisms underground convert the biomass into CO₂, which binds permanently to the coal.

These projects illustrate how durable carbon removal can involve various technologies and storage methods.

The eight purchases are:

  • Alkamy Carbon: 667 tonnes
  • Brineworks: 500 tonnes
  • Carba: 816 tonnes
  • Cowboy Clean Fuels: 500 tonnes
  • Deep Sky: 394 tonnes
  • PRONOE: 131 tonnes
  • Sirona Technologies: 390 tonnes
  • Yama: 263 tonnes

This totals 3,661 tonnes.

                                                    Credit Issuance 

CDR purchases
Source: ClimeFi CDR Market Report

Why Early Buyers Matter for the CDR Market

These latest purchases come as the carbon removal industry faces challenges.

While the sector has seen significant investment, many companies developing new technologies encounter high costs, long timelines, and limited demand.

Milkywire says the market needs buyers who will back technologies early on. Without early demand, promising projects might find it hard to secure funding. They may also struggle to transition from pilot stages to commercial operations.

This approach can also yield technical insights. A first-of-a-kind project may remove small amounts of CO₂, but its operation can provide data to improve performance and reduce costs.

Notably, Milkywire has enabled more than $12 million in carbon removal purchases. This includes over 45 projects in 20+ countries.

The latest portfolio spreads funding across multiple technologies instead of focusing on one method.

                                                      CDR Market Growth

cdr Purchases cdr market
Source: ClimeFi CDR Market Report

For Salesforce, these purchases further its long-term carbon removal strategy. The company announced its $100 million durable CDR commitment in 2022 as part of the First Movers Coalition.

As the CDR market grows, these early purchases could help identify which technologies move from pilot to commercial deployment. For developers, funding means early buyers. For the industry, these projects offer real-world data on effective pathways for durable carbon removal at scale.

The post Salesforce and Milkywire Back 3,661 Tons of Carbon Removal Across 8 Projects appeared first on Carbon Credits.
Silver Falls 45% From Its 2026 Peak as Sierra Madre Scales Up Production

Silver Falls 45% From Its 2026 Peak as Sierra Madre Scales Up Production

Disseminated on behalf of Sierra Madre Gold & Silver Ltd.

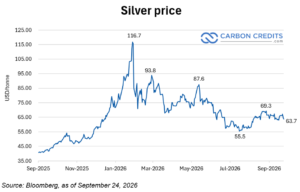
Silver has had a volatile 2026. It has pulled back sharply from its 2026 peak. The metal reached a 52-week high of about $115 per ounce in January before falling sharply during the year. 

By mid-September, silver futures had dropped to about $63 per ounce, roughly 45% below that peak. Prices later recovered to around $66.70 by September 18.

That move highlights an important shift for silver producers. The market is no longer simply a story of rising prices. Producers now have to operate through a much wider price range while managing costs, production growth, and capital spending.

The decline has changed the operating backdrop for silver producers, but the underlying supply picture remains tight.

According to the World Silver Survey 2026, global silver mine production increased 3% in 2025 to 846.6 million ounces. Recycling added another 197.6 million ounces. Yet, total demand reached 1.13 billion ounces, leaving the market with a 40.3 million-ounce deficit, the fifth consecutive annual shortfall.

Metals Focus expects another deficit in 2026, estimated at 46.3 million ounces. That backdrop matters for Sierra Madre Gold & Silver as it moves from restarting one mine to building a larger production base.

The changing silver price environment, therefore, tests the company’s strategy: how does an operating producer manage growth when the commodity price can move sharply in either direction?

Silver’s 2026 Rally Gives Way to a Sharp Reset

Silver entered 2026 at elevated levels after a strong run in late 2025 and early 2026, but it significantly dropped this month. The decline was not driven by one factor alone.

silver price

Higher U.S. Treasury yields, a stronger dollar, and changing expectations for Federal Reserve policy have affected precious metals. Silver can also experience larger price swings than gold because it combines investment demand with industrial uses.

Recently, silver had recovered to over $66 per ounce. That rebound, however, does not erase the earlier decline. Instead, it shows why mining companies must plan around changing commodity prices rather than rely on a single price environment.

For Sierra Madre, that distinction matters because the company is already generating revenue from an operating mine.

La Guitarra Is Already Generating Silver Revenue

La Guitarra is no longer simply a development project. Sierra Madre restarted commercial production at the Mexican mine on January 1, 2025. The operation includes an underground mine and a processing plant that previously operated at 500 tonnes per day.

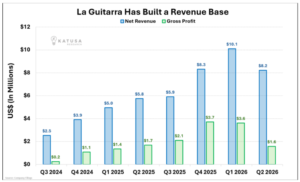
Moreover, the company reported 66,691 ounces of silver sold in Q2 2026, compared with 65,683 ounces in the same quarter of 2025.

The mine generated US$25 million of revenue and US$8.9 million of gross profit in 2025, its first full year back in production.

In the first half of 2026, La Guitarra generated another US$18.3 million of revenue and US$3.5 million of adjusted EBITDA. Sierra Madre also repaid its US$5 million First Majestic loan in July and ended June with US$22.2 million in cash and US$25 million in working capital.

The company received US$75.65 per silver-equivalent ounce sold in Q2 2026, compared with US$33.22 a year earlier.

Those figures show the effect that higher realized metal prices had on revenue. But they also highlight why future results cannot simply be extrapolated from the second quarter.

The spot and futures market has since moved below the $75.65 realized silver price reported for Q2. If lower prices persist, the company could face lower revenue per ounce even as production increases. That makes the production ramp-up increasingly important.

La Guitarra Is Already Generating Silver Revenue

That higher realized price helped offset higher costs during a development-heavy quarter.

Sierra Madre reported all-in sustaining costs of US$54.73 per ounce produced, up from US$32.54 a year earlier. The company attributed the increase to development ore, lower recoveries, power outages, a stronger Mexican peso, and higher royalties.

The cost increase shows why the silver price pullback matters. Higher metal prices can support revenue and margins, but production growth can also bring temporary cost pressure.

SEE MORE: Sierra Madre: Breathing New Life into Mexico’s Silver and Gold Heartland

Sierra Madre Pushes La Guitarra Toward Higher Throughput

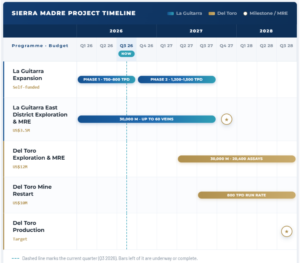
Sierra Madre is working to increase processing capacity at La Guitarra. The first phase is expected to bring capacity to about 750–800 tonnes per day, with the company expecting the expansion to come online before the end of Q3 2026. 

  • A second phase is planned to increase capacity to 1,200–1,500 tonnes per day by Q3 2027.
Sierra Madre Project Timeline
Source: Sierra Madre Gold and Silver Ltd. corporate presentation,

The company reported that throughput had reached as high as 672 tonnes per day in August, as it continued to ramp up the operation. This timing matters.

Higher throughput can increase the number of ounces produced and sold, although the actual financial benefit will depend on factors including grades, recoveries, operating costs, capital requirements and the silver and gold prices received.

Sierra Madre reported Q2 2026 cash costs of $49.28 per silver-equivalent ounce produced, compared with $26.89 in Q2 2025. Its all-in sustaining cash cost was $54.73 per silver-equivalent ounce, versus $32.54 a year earlier.

The company said it expects higher production from the expansion, along with a reduction in costs as the operation scales up. That makes the next stage of the ramp-up particularly important in a lower-price environment.

Del Toro Adds Another Mexican Silver Asset

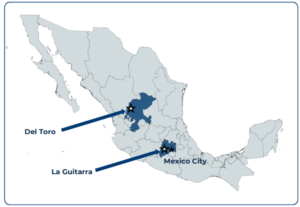
Sierra Madre added a second permitted silver mine to its portfolio in June 2026 with the acquisition of the Del Toro Silver Mine in Zacatecas, Mexico.

Del Toro

The company closed the deal with First Majestic Silver on June 22, 2026. First Majestic previously operated Del Toro from 2013 to 2019 and invested about US$175 million to build the operation.

The site includes three underground mines — San Juan, Perseverancia and Dolores — with more than 60 kilometres of underground development. It also has a 3,000-tonne-per-day flotation circuit and about 3,650 tpd of installed mill capacity.

Del Toro has a production history. It averaged 2.54 million silver-equivalent ounces per year from 2015 to 2018 under First Majestic.

Sierra Madre plans to restart the mine at a smaller scale. The company expects to spend about US$10 million initially, targeting 800 tpd, with a potential increase to 1,600 tpd. The restart is targeted for mid-2027, with production expected to begin in mid-2028.

Exploration will also be important. Sierra Madre has identified 23 deposits at Del Toro and plans about 30,000 metres of diamond drilling at a cost of roughly US$12 million.

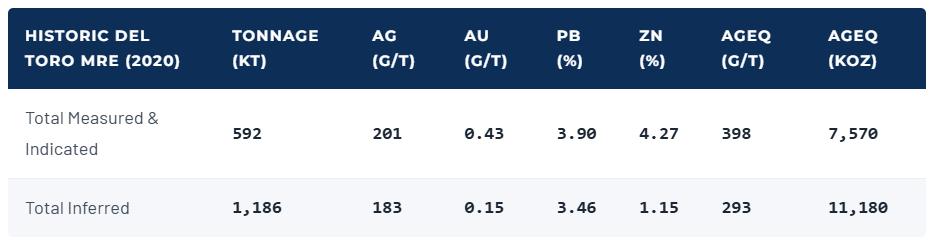
A 2020 historical estimate reported 7.57 million silver-equivalent ounces of measured and indicated material and 11.18 million ounces of inferred material. These figures are historical and are not current mineral resources. 

Historic Del Toro MRE (2020)

Sierra Madre plans new drilling and resource modelling to establish an updated resource.

The acquisition gives the company another developed Mexican silver asset with existing infrastructure, past production and exploration upside, while the company continues expanding La Guitarra.

Mexico Matters to the Silver Supply Story

Del Toro also places Sierra Madre in one of the world’s most important silver-producing countries.

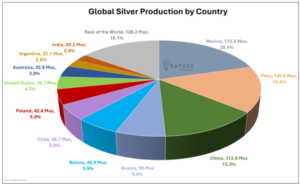
Mexico produced 172.9 million ounces of silver in 2025, down 5% from 181.1 million ounces in 2024. Still, it remained the world’s largest silver-producing country and accounted for about 20% of global mine supply.

global silver production

That makes Mexico an important part of the global supply story, while Zacatecas itself has a long history of silver production.

The Katusa Research report notes that roughly half of global silver production comes from Latin America, with Mexico accounting for about one-fifth of global output.

Sierra Madre’s strategy therefore combines existing Mexican infrastructure with a market where new supply remains difficult to bring online quickly.

Lower Silver Prices Put More Focus on Mine Execution

The silver pullback changes the economics of new production, even if the longer-term supply deficit remains. For Sierra Madre, the key issue is no longer simply whether silver prices are rising. The company now has to execute two different stages of growth.

La Guitarra needs to increase throughput while bringing costs under control. Del Toro needs to move through drilling, resource definition, mine planning, and restart work before it can contribute production.

The company is therefore entering a more demanding phase. The next stage of Sierra Madre’s story will depend on how efficiently it converts existing infrastructure, resources, and permits into production.

For now, La Guitarra provides an operating base while Del Toro offers a second potential source of growth. The silver price has pulled back, but Sierra Madre’s production strategy is moving forward. 


DISCLAIMER
New Era Publishing Inc. and/or CarbonCredits.com (“We” or “Us”) are not securities dealers or brokers, investment advisers, or financial advisers, and you should not rely on the information herein as investment advice. Sierra Madre Gold and Silver Ltd. (“Company”) made a one-time payment of $25,000 to provide marketing services for a term of one month. None of the owners, members, directors, or employees of New Era Publishing Inc. and/or CarbonCredits.com currently hold, or have any beneficial ownership in, any shares, stocks, or options of the companies mentioned.

This article is informational only and is solely for use by prospective investors in determining whether to seek additional information. It does not constitute an offer to sell or a solicitation of an offer to buy any securities. Examples that we provide of share price increases pertaining to a particular issuer from one referenced date to another represent arbitrarily chosen time periods and are no indication whatsoever of future stock prices for that issuer and are of no predictive value.

Our stock profiles are intended to highlight certain companies for your further investigation; they are not stock recommendations or an offer or sale of the referenced securities. The securities issued by the companies we profile should be considered high-risk; if you do invest despite these warnings, you may lose your entire investment. Please do your own research before investing, including reviewing the companies’ SEDAR+ and SEC filings, press releases, and risk disclosures.

It is our policy that information contained in this profile was provided by the company, extracted from SEDAR+ and SEC filings, company websites, and other publicly available sources. We believe the sources and information are accurate and reliable but we cannot guarantee them.

CAUTIONARY STATEMENT AND FORWARD-LOOKING INFORMATION

Certain statements contained in this news release may constitute “forward-looking information” within the meaning of applicable securities laws. Forward-looking information generally can be identified by words such as “anticipate,” “expect,” “estimate,” “forecast,” “plan,” and similar expressions suggesting future outcomes or events. Forward-looking information is based on current expectations of management; however, it is subject to known and unknown risks, uncertainties, and other factors that may cause actual results to differ materially from those anticipated.

These factors include, without limitation, statements relating to the Company’s exploration and development plans, the potential of its mineral projects, financing activities, regulatory approvals, market conditions, and future objectives. Forward-looking information involves numerous risks and uncertainties and actual results might differ materially from results suggested in any forward-looking information. These risks and uncertainties include, among other things, market volatility, the state of financial markets for the Company’s securities, fluctuations in commodity prices, operational challenges, and changes in business plans.

Forward-looking information is based on several key expectations and assumptions, including, without limitation, that the Company will continue with its stated business objectives and will be able to raise additional capital as required. Although management of the Company has attempted to identify important factors that could cause actual results to differ materially, there may be other factors that cause results not to be as anticipated, estimated, or intended.

There can be no assurance that such forward-looking information will prove to be accurate, as actual results and future events could differ materially. Accordingly, readers should not place undue reliance on forward-looking information. Additional information about risks and uncertainties is contained in the Company’s management’s discussion and analysis and annual information form for the year ended December 31, 2025, copies of which are available on SEDAR+ at www.sedarplus.ca.

The forward-looking information contained herein is expressly qualified in its entirety by this cautionary statement. Forward-looking information reflects management’s current beliefs and is based on information currently available to the Company. The forward-looking information is made as of the date of this news release, and the Company assumes no obligation to update or revise such information to reflect new events or circumstances except as may be required by applicable law.

For more information on the Company, investors should review the Company’s continuous disclosure filings available on SEDAR+ at www.sedarplus.ca.

Disclosure: Owners, members, directors, and employees of carboncredits.com have/may have stock or option positions in any of the companies mentioned: None.

Carboncredits.com receives compensation for this publication and has a business relationship with any company whose stock(s) is/are mentioned in this article.

Additional disclosure: This communication serves the sole purpose of adding value to the research process and is for information only. Please do your own due diligence. Every investment in securities mentioned in publications of carboncredits.com involves risks that could lead to a total loss of the invested capital.

Please read our Full RISKS and DISCLOSURE here.

The post Silver Falls 45% From Its 2026 Peak as Sierra Madre Scales Up Production appeared first on Carbon Credits.

NVIDIA’s AI Spending Surge to $279B as Infrastructure Commitments Hit Record Levels, NVDA Stock Gains

NVIDIA’s AI Spending Surge to $279B as Infrastructure Commitments Hit Record Levels, NVDA Stock Gains

NVIDIA (NASDAQ: NVDA) is moving deeper into the center of the global AI infrastructure boom as spending commitments across the industry reach unprecedented levels. The chipmaker is benefiting from rising demand for AI computing, while also helping finance and build the infrastructure needed to support future growth.

The trend is reflected in NVIDIA’s latest results. For the second quarter of fiscal 2027, revenue reached $96.2 billion, up 106% year over year. Data Center revenue rose 117% to $89 billion.

NVIDIA expects another record quarter, forecasting $108 billion in fiscal Q3 revenue. Behind those numbers is a much larger infrastructure cycle involving chips, data centers, networking, electricity, and financing.

The $2.7T AI Spending Wave Is Just Getting Started

The scale of AI investment has expanded sharply. Gartner forecasts worldwide AI spending at $2.7 trillion in 2026, up 49.5% from 2025. AI infrastructure is expected to account for about $1.48 trillion of that spending. Gartner forecasts total AI spending could reach approximately $3.64 trillion in 2027.

Data center investment is also creating a major new demand for electricity.

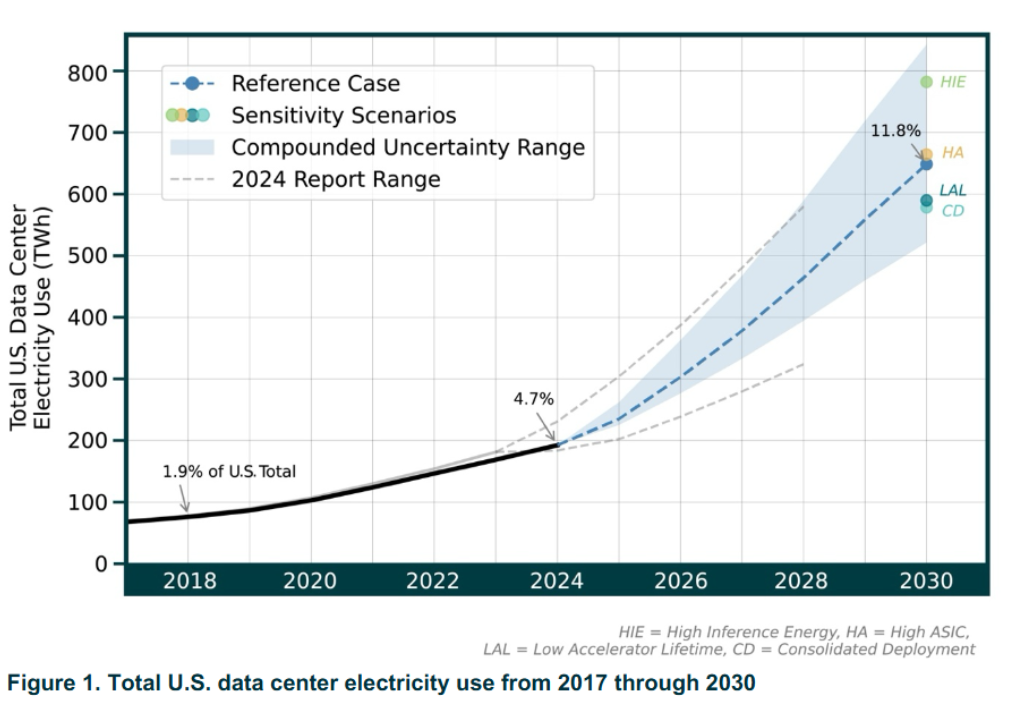
The International Energy Agency (IEA) estimates global data center electricity consumption will roughly double from 485 TWh in 2025 to 950 TWh in 2030. Electricity use from AI-focused data centers is expected to triple over the same period.

The IEA also expects data centers to account for about 3% of global electricity demand by 2030. In the U.S., they could account for almost half of electricity-demand growth through the end of the decade. This creates demand not only for GPUs but also for networking equipment, cooling systems, power infrastructure, and data center capacity.US data centers electricity use 2030

NVIDIA’s Results Show the Scale of Demand

NVIDIA’s latest financial results provide a direct measure of the AI infrastructure boom. For the quarter ended July 26, 2026, revenue reached $96.2 billion, compared with $46.7 billion a year earlier. Operating income climbed 124% to $63.7 billion, while net income increased 126% to $59.7 billion. GAAP gross margin was 75%.

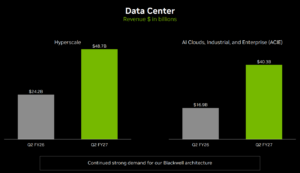
The Data Center segment remains the main growth engine. Revenue increased 18% from the previous quarter and 117% from a year earlier to $89 billion. NVIDIA’s Edge Computing revenue reached $7.2 billion, up 27% year over year.

Nvidia data center revenue Q2 2027
Source: Nvidia

For fiscal Q3, NVIDIA expects revenue of $108 billion, plus or minus 2%. Its forecast assumes no Data Center compute revenue from China. Gross margin is expected at 74%, plus or minus 50 basis points.

The company has also sharply increased its supply and capacity commitments. NVIDIA’s fiscal Q2 filing shows these commitments rose from $119 billion to $279 billion as of July 26, 2026. The company said the increase was intended to meet future demand.

These commitments are not the same as revenue. They represent future obligations and capacity arrangements. NVIDIA also warns that customers could delay purchases because of shortages of land, electricity, data center shells, or capital.

NVIDIA Moves Into AI Infrastructure Financing

The world’s most valuable company is also expanding beyond chip sales. In August, NVIDIA announced partnerships with Apollo, BlackRock, Blackstone, Brookfield, Goldman Sachs and KKR to establish independent financing platforms for AI infrastructure.

The platforms aim to mobilize more than $500 billion of third-party capital over time. The objective is to help fund large AI data centers and computing systems. This reflects a broader shift in the industry.

The IEA says data center investments have become too large to be funded entirely from company balance sheets, making capital markets increasingly important.

However, the $500 billion figure is a target for capital mobilization, not money already committed. NVIDIA’s announcement says the arrangements remain subject to definitive agreements. NVIDIA’s Q2 filing also shows $99 billion of equity investments and $25 billion of equity investment commitments as of July 26, 2026.

OpenAI’s 10-GW Plan Adds Fuel to the AI Buildout

One of the clearest examples of AI infrastructure demand is NVIDIA’s partnership with OpenAI. In September 2025, the companies announced plans for at least 10 gigawatts of NVIDIA systems for OpenAI’s next-generation AI infrastructure.

NVIDIA said it intended to invest up to $100 billion in OpenAI progressively as each gigawatt is deployed. The first gigawatt was targeted for deployment in the second half of 2026 using NVIDIA’s Vera Rubin platform.

NVIDIA’s broader infrastructure model now covers computing, networking, software and financing. The company’s fiscal Q2 results also highlighted its DSX platform, which is designed to help infrastructure builders design, build and operate large-scale AI factories. This suggests that NVIDIA’s role in the AI economy is expanding beyond supplying individual processors.

The Next AI Bottleneck: Finding Enough Power

The next challenge is increasingly physical. AI data centers require enormous amounts of electricity, and connecting new facilities to power grids can take years. The IEA says bottlenecks involving grid connections, transformers, gas turbines, advanced chips and other infrastructure are already slowing some projects.

NVIDIA’s own regulatory filing makes a similar point. It says access to land, power, data center shells and capital is crucial to customer deployment.

This creates a potential constraint on how quickly AI computing capacity can grow. Having demand for GPUs does not automatically mean the infrastructure exists to operate them. It also creates a larger connection between the technology and energy markets.

The IEA expects renewables and natural gas to supply much of the additional electricity needed by data centers, with nuclear also becoming more important later this decade.

NVIDIA’s AI Growth Comes With a Bigger Emissions Bill

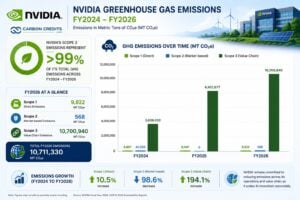
NVIDIA GHG emissions 2026

The infrastructure boom also raises environmental questions for NVIDIA and its supply chain. It has science-based emissions targets based on a FY2023 baseline, aiming to cut absolute Scope 1 and Scope 2 emissions by 50% by FY2030. It also targets a 75% reduction in Scope 3 emissions intensity from the use of sold GPUs per PFLOP by FY2030.

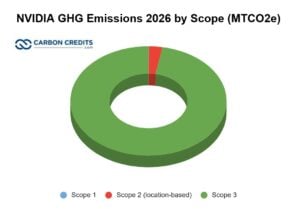
The company has made progress on operational electricity emissions. Its FY26 sustainability report shows 9,822 metric tons of Scope 1 emissions and 568 tons of market-based Scope 2 emissions. However, its wider supply chain footprint has increased sharply.

NVIDIA reported 10.7 million metric tons of Scope 3 emissions in FY26, compared with 6.9 million tons in FY25. Purchased goods and services accounted for 9.3 million tons. That increase highlights the environmental challenge created by rapid hardware expansion.

Nvidia GHG emissions 2026 by scope
Data source: Nvidia
  • The chipmaker is therefore pursuing two parallel goals: increasing computing efficiency while reducing emissions across its operations and value chain.

NVIDIA Stock Moves Higher as AI Spending Accelerates

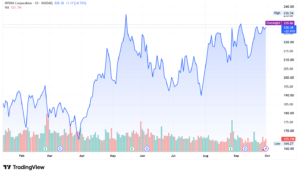
NVIDIA stock closed at $228.38 on September 30, 2026, gaining 0.5% for the session. The stock rose 1.7% on September 28 after NVIDIA announced a record $150 billion increase to its share-repurchase authorization. This lifts the total remaining authorization to about $235 billion.

Recent trading has therefore taken place alongside continued investor focus on AI infrastructure spending, NVIDIA’s earnings growth and its expanding capital-return program.

NVIDIA NVDA Stock

NVIDIA’s AI Infrastructure Cycle Keeps Expanding

NVIDIA enters the next phase of the AI buildout with several major infrastructure commitments already in place. OpenAI’s planned 10-GW deployment adds another large source of future demand.

At the same time, the industry faces physical and financial constraints. Electricity demand from data centers is projected to nearly double by 2030, while grid connections, power equipment, land, construction capacity and financing could limit the speed of new deployments.

For NVIDIA, the opportunity is therefore no longer limited to selling GPUs. The company is increasingly involved in the broader AI infrastructure stack, including computing, networking, software, capacity and financing.

The scale of those commitments shows how much capital is now moving behind AI. It also makes energy availability, infrastructure delivery, emissions, and the economic returns from AI spending increasingly important factors in the next phase of the market.

The post NVIDIA’s AI Spending Surge to $279B as Infrastructure Commitments Hit Record Levels, NVDA Stock Gains appeared first on Carbon Credits.
700+ Companies Commit to Net Zero by 2040, But Renewable Growth Still Falls Short

700+ Companies Commit to Net Zero by 2040, But Renewable Growth Still Falls Short

More than 700 companies have now committed to reaching net-zero carbon emissions by 2040 through The Climate Pledge, but the rapid growth of corporate climate action is running into a major global challenge: there is still not enough clean energy capacity being built to meet the world’s 2030 renewable target.

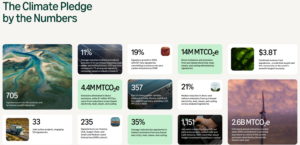
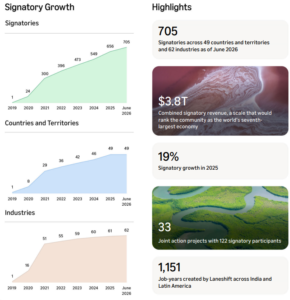
The Climate Pledge’s 2026 report counted 705 signatories across 49 countries and territories and 62 industries. The combined revenue of the companies is about $3.8 trillion. The current Climate Pledge website now lists 728 signatories.

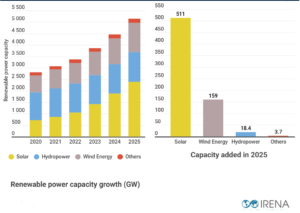
At the same time, the International Renewable Energy Agency (IRENA) says the world added a record 692 gigawatts (GW) of renewable power capacity in 2025, bringing total renewable capacity to 5,149 GW.

That is strong growth, but it is still below the pace needed to triple global renewable capacity by 2030. The gap matters for companies trying to cut emissions because corporate demand for clean electricity is growing faster than renewable supply in many markets.

Climate Pledge Companies Are Turning Net-Zero Targets Into Action

The new Climate Pledge report provides some evidence that corporate commitments are translating into action.

Among 119 signatories analyzed in the report, representing about 90% of publicly available signatory revenue, operational carbon emissions fell by an average of 11% between the measured periods. That compares with a 7% average decline among other companies in the dataset.

The Climate Pledge by numbers
Source: The Climate Pledge

The median reduction among the analyzed signatories was even higher at 21%. Three out of four companies reduced emissions from their direct operations and purchased energy. 

The biggest reduction came from Scope 2 emissions, which fell by an average of 35%. These are emissions linked to purchased electricity, heat, steam, and cooling. Renewable energy procurement was a major reason for that decline.

By comparison, Scope 1 emissions fell 4% on average. These come directly from company operations, including fuel use and industrial processes.

That difference highlights a major issue for the next stage of corporate decarbonization. Buying more renewable electricity can reduce power-related emissions, but cutting emissions from factories, fleets, buildings and industrial processes is often harder. 

Angel Hsu, Associate Professor and Founder of the Data Driven Envirolab at the University of North Carolina at Chapel Hill, wrote:

“Through the Net Zero Tracker, we spend our time scrutinizing whether corporate climate commitments are credible and actually hold up over time. What’s encouraging in the data is how many companies are not only staying the course, but in many cases strengthening their targets over time while backing them with measurable progress. That continued commitment is what turns a net-zero claim into a credible plan.”

Renewable Power Is Growing at Record Speed 

Global renewable deployment is nevertheless moving quickly. IRENA reports that 692 GW of renewable capacity was added in 2025, a 15.5% increase from the previous year. Renewables accounted for 85.6% of all new power capacity added globally.

Solar dominated the expansion, with about 511 GW added. Wind contributed another 158.7 GW. Together, solar and wind made up 96.8% of net renewable additions.

  • Renewables now represent about 49% of global installed power capacity, according to IRENA. 

The economics are also improving. IRENA says more than 85% of new renewable projects are now cheaper than fossil-fuel alternatives, while the cost of solar power has fallen 87% since 2010, onshore wind by 55%, and battery storage by 93%. 

The market is therefore no longer simply waiting for renewable technology to become competitive. The bigger challenge is deploying it fast enough and connecting it to consumers.

The World Still Has a 2030 Renewable Capacity Gap

At COP28, countries agreed to work toward tripling global renewable power capacity by 2030. IRENA estimates this means reaching about 11.2 terawatts (TW) by 2030. To get there, the world needs average annual additions of about 1,122 GW between 2025 and 2030, with renewable capacity growing about 16.6% a year. 

The 692 GW added in 2025 was therefore about 430 GW below that annual average pace. Put another way, 2025 deployment reached only about 62% of the average annual capacity addition needed to stay on the tripling path.

renewable power additions
Source: IRENA

IRENA’s latest data also shows that deployment remains highly concentrated. China, the United States and the European Union accounted for 79.5% of all new renewable capacity added in 2025, while Africa accounted for only 1.6%.

That imbalance is a major concern for companies operating across emerging markets, where access to renewable electricity can remain limited even as corporate climate targets become more demanding. 

Grids and Finance Are Becoming the Bottlenecks

The renewable gap is not simply a question of building more solar panels and wind turbines. IRENA’s 2026 analysis points to several practical barriers, including:

  • Grid capacity,
  • Energy storage,
  • Permitting,
  • Financing, and
  • Supply chains.

Grid upgrades are especially important because solar and wind projects can be built faster than new transmission and distribution infrastructure. This creates a growing problem for companies.

A business can have a target to use 100% renewable electricity, but achieving it depends on whether suitable projects exist in the markets where it operates and whether the grid can deliver the required power.

The Climate Pledge report reflects that challenge. Its signatories reduced purchased-energy emissions much faster than direct operational emissions, showing that renewable procurement can move relatively quickly while harder industrial reductions take longer.

That is why corporate demand can play an important role in the renewable market. Long-term power purchase agreements and other procurement contracts can provide developers with predictable demand and help projects secure financing.

Corporate Demand Could Boost Carbon Markets

The Climate Pledge is relevant to the carbon market as well. Its members commit to measure and report emissions, reduce them through operational changes and clean energy, and neutralize remaining emissions with additional, quantifiable, real and permanent offsets. 

Yet, that does not mean all 700-plus companies will rely heavily on carbon credits. The framework puts direct emissions cuts first. But as companies reduce their operational emissions, the remaining emissions become harder to eliminate. That could increase demand for high-quality carbon removals and other credible climate projects over time.

The Climate Pledge
Source: The Climate Pledge

The Climate Pledge report estimates that if its signatories collectively reach net zero, they could eliminate at least 2.6 billion metric tons of CO2e annually. The organization says this is roughly equivalent to one-third of the carbon absorbed by the world’s forests each year.

This is a projection, not a measured reduction already achieved, and the report notes that emissions overlaps between companies mean it should not be treated as a simple absolute emissions reduction. That distinction is important when assessing the real market impact.

The Next Decade Will Test How Fast Markets Can Scale

The two new data sets point to the same market challenge from different directions. Corporate climate commitments are expanding quickly. The Climate Pledge added 107 companies in 2025, a 19% increase from 2024. Signatories now span dozens of industries, including sectors that are difficult to decarbonize. 

Renewable power is also expanding at record levels, but the world still needs much faster deployment to reach the 2030 tripling goal. For companies, this creates both a challenge and a business opportunity.

More renewable capacity, stronger grids and better storage can make corporate emissions targets easier to deliver. Long-term corporate demand can, in turn, help finance new clean energy projects. The key issue is timing.

The Climate Pledge gives companies until 2040 to reach net zero, while the global renewable tripling target arrives in 2030. That leaves only a few years to close the renewable deployment gap. The latest numbers show progress, but they also show how much more infrastructure must be built.

The corporate climate market is growing. The renewable market is growing even faster. However, neither is moving fast enough to close the gap between today’s commitments and the clean energy system needed to meet them.

The post 700+ Companies Commit to Net Zero by 2040, But Renewable Growth Still Falls Short appeared first on Carbon Credits.
Gold Price Up 70%, Costs Up 16%: Miners’ Decarbonization Test

Gold Prices Near Record Highs Put Miners’ Sustainability Spending in Focus

Gold prices remain near historic highs, creating a major cash-flow opportunity for mining companies. The bigger question for the industry is what miners are doing with those stronger margins. Spot gold was around $4,183 per ounce on September 29, 2026, after reaching a record high earlier this year. The latest price is still well above the levels seen before the recent gold boom. 

Mining costs have also increased, but much more slowly than gold prices.

The World Gold Council (WGC) reported that the global average all-in sustaining cost (AISC) reached a record $1,785 per ounce in the first quarter of 2026, up 16% from a year earlier. Gold’s average price rose about 70% year over year during the same period. 

As a result, average AISC margins jumped 134% year over year to a record $3,076 per ounce. This creates an unusual opportunity for miners to invest more in cleaner operations.

The question is whether that money is actually flowing into decarbonization, renewable power, electrification, and other environmental projects.

gold spot price
Source: Bloomberg

Gold Prices Are Rising Faster Than Mining Costs

Gold remained extremely expensive in Q2 2026, even after pulling back from its early-year record. The LBMA Gold Price PM averaged $4,506.29 per ounce during Q2, down 8% from Q1 but still 37% higher than Q2 2025.

Mining costs have also risen, but at a slower pace. The latest global industry data from the World Gold Council, covering Q1 2026, put average all-in sustaining costs (AISC) at a record $1,785 per ounce, up 5% quarter over quarter and 16% year over year. The WGC has not yet published a global Q2 AISC figure.

  • The gap is still striking. Gold’s Q2 average was about $2,721 per ounce above the latest global AISC benchmark.

Gold prices have risen much faster. The difference gives miners substantial room between the revenue earned from each ounce and the cost of sustaining production.

The WGC says royalties were one of the biggest reasons costs increased. In Q1 2026, royalty payments rose 85% year over year and accounted for about 12% of average AISC, compared with around 6% in Q1 2021.

So miners are not keeping the entire benefit of higher gold prices. Governments are also capturing part of the windfall through royalties and taxes.

Even after those costs, however, margins remain exceptionally strong. That gives companies more capacity to fund mine development, debt reduction, dividends, share buybacks, and sustainability projects.

Fed Rate Hike Changes the Gold Equation

The biggest new market driver is the U.S. Federal Reserve.

On September 16, the Fed raised its benchmark interest rate range by 25 basis points to 3.75%–4.00%. It was the central bank’s first rate increase in three years. The Fed said inflation remains elevated and that the latest action would support a return to its 2% inflation goal.

The Fed’s latest projections point to a higher path for rates than previously expected. The median projection puts the federal funds rate at 4.1% at the end of 2026, compared with 3.8% in the June projection.

That is a problem for gold because the metal pays no interest. When Treasury yields rise, investors can earn more income from bonds while holding gold still carries no coupon. That increases the opportunity cost of owning bullion.

Markets are now also pricing in the possibility of another Fed increase later this year. Boston Fed President Susan Collins said she supported the September hike and warned that inflation risks remain elevated.

Gold-Fed hike

Major Gold Miners Are Generating Billions in Cash

Recent financial results show how large that cash generation has become.

Newmont generated a record $2.2 billion in free cash flow in Q2 2026. Its average realized gold price was $4,414 per ounce, while gold by-product AISC was $1,621 per ounce. That creates a $2,793-per-ounce spread before other corporate costs and financial items. 

Newmont returned $1.9 billion to shareholders during the quarter. Its 2026 plan also includes about $1.95 billion of sustaining capital, $1.4 billion of development capital and $525 million for exploration and advanced projects. 

Agnico Eagle reported a Q2 realized gold price of $4,483 per ounce and AISC of just $1,459 per ounce, producing a spread of about $3,024 per ounce. It generated record quarterly free cash flow and continued to fund growth projects while returning capital to shareholders.                                       

Barrick reported a Q2 realized gold price of $4,417 per ounce and AISC of $1,866 per ounce, a spread of about $2,551 per ounce. Operating cash flow reached $1.70 billion, up 28% year over year. 

These numbers show the scale of the windfall, but they also show that sustainability is competing with other uses of capital.

Gold Fields Puts $195M Into Renewable Power

Gold Fields provides one of the clearest examples of direct spending on cleaner energy. The company is building a $195 million renewable project at its St Ives operation in Australia, combining a 42-MW wind farm and a 35-MW solar plant. The project aims to reduce reliance on fossil-fuel power and strengthen the mine’s energy supply. 

gold fields renewable projects
Source: Gold Fields

In the first half of 2026, renewable electricity supplied 17.4% of Gold Fields’ group electricity consumption, while Scope 1 and 2 emissions were 4% lower than in H1 2025. At Agnew, renewable electricity already accounted for 43% of power supply.

Gold Fields also has a longer-term target of net-zero emissions by 2050. Its spending shows how higher mining cash flows can fund projects that reduce future fuel and power costs as well as emissions.

Other Miners Are Also Building Cleaner Operations

Gold Fields is not alone. Agnico Eagle has committed to reduce absolute Scope 1 and 2 emissions by 30% by 2030 and reach net zero by 2050.

Agnico Eagle 2030 emmissions target
Source: Agnico Eagle

Its new Hope Bay project in Canada’s Nunavut territory includes a planned 4-MW wind project and 4 MW of battery storage, supported by C$25 million in federal funding. Agnico says the system should cut diesel use by about 3 million litres per year.

Barrick has also included renewable power in its major growth projects. At its Reko Diq copper-gold project in Pakistan, the planned power system includes 150 MW of solar generation. Barrick targets a 30% reduction in emissions intensity by 2030 and net-zero greenhouse gas emissions by 2050.

There is an important catch, however.

Barrick says its expanding production base could cause absolute emissions to rise in the short and medium term, even as emissions per tonne of ore fall. That illustrates a wider challenge for miners: growing production can work against absolute emissions targets.

Shareholder Returns Compete With Decarbonization

The current gold boom is therefore producing a mixed capital-allocation picture. Miners are spending more on renewable power, energy efficiency, electrification and mine infrastructure. But they are also returning large amounts of cash to shareholders and funding new production.

The WGC noted that many producers entered 2026 with strong or even net-cash balance sheets. Newmont, for example, ended Q2 with $9.0 billion of cash and a $3.4 billion net-cash position, while continuing large share repurchases. 

Gold Fields also reported $2.225 billion of adjusted free cash flow in H1 2026, more than double the previous year’s $925 million. Its capital plans include both growth spending and renewable energy investment. 

This is why simply pointing to record gold margins does not prove miners are becoming greener. The stronger test is how much capital is being directed toward measurable emissions reductions.

Why Gold’s Energy Intensity Creates a Big Climate Opportunity

The opportunity is significant because gold mining is energy intensive. Diesel is used for haul trucks and other mobile equipment, while electricity is needed for crushing, grinding, ventilation, pumping, and processing.

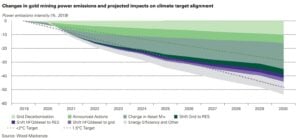
gold mining power emissions

Renewable electricity, battery storage, electrified equipment, and lower-carbon fuels can reduce these emissions. They can also protect miners from volatile fuel prices over time.

Gold Fields already links renewable investment to energy security, lower emissions and cost resilience. The current price environment provides miners with the financial capacity to accelerate that transition. However, the evidence so far points to a mixed picture rather than a single industry-wide trend.

Some companies are making large renewable investments. Others are directing more cash toward production growth and shareholder distributions. Most are pursuing a combination of the two. That makes the next few years important.

The Real Test Is Where the Windfall Goes

Gold’s current price strength has created exceptional margins for many producers. The industry now has more financial room to invest in cleaner mines. But major miners are also returning billions to investors and funding new mines.

The key question for the sector is therefore not whether gold producers have more money to spend. They do.

It is how much of that financial capacity is being converted into lower emissions, cleaner energy and more resilient mining operations. That is where the next phase of the gold boom could have a lasting impact on the mining sector—and its carbon footprint.

The post Gold Price Up 70%, Costs Up 16%: Miners’ Decarbonization Test appeared first on Carbon Credits.
Verra CCS Methodology Gets ICVCM Approval as Carbon Removal Market Grows

Verra’s carbon capture and storage (CCS) methodology has been approved by the Integrity Council for the Voluntary Carbon Market (ICVCM) under its Core Carbon Principles (CCPs).

The approval adds a major technology-based carbon removal method to the growing list of methodologies that meet the ICVCM’s high-integrity requirements.

Mandy Rambharos, CEO of Verra, says:

“Carbon capture and storage is one of the hardest, most technically demanding technologies in the market, and it has to be done right. The ICVCM’s approval confirms that VM0049 and its accompanying modules meet the highest bar for integrity in the industry, giving buyers and governments confidence in VCS projects that apply an approach essential to reaching net zero. Tackling climate change will take every tool in the toolbox. More credible credits in more sectors means more impactful climate action.”

Inside Verra’s VCS Methodology VM0049 

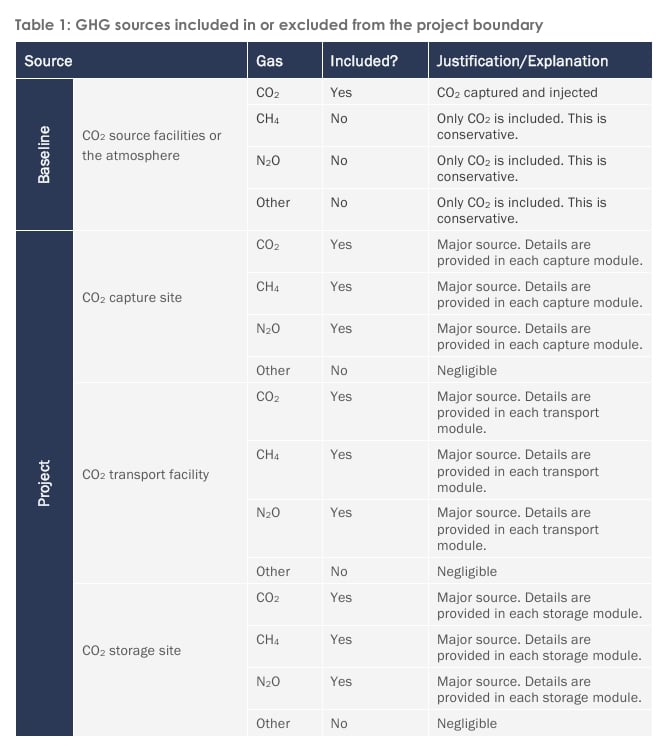
Verra’s Verified Carbon Standard (VCS) methodology VM0049 Carbon Capture and Storage, v1.0, sets rules for measuring greenhouse gas emission reductions and carbon dioxide removals from projects that capture CO₂ and store it permanently.

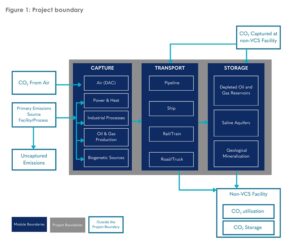
The framework also includes modules for direct air capture (DAC), CO₂ transport, CO₂ storage and bioenergy with carbon capture and storage (BECCS).

The approval comes at an important time for the voluntary carbon market. Buyers are paying more attention to whether carbon credits represent real and lasting climate benefits. For CCS projects, this is especially important because capturing CO₂ is only one part of the process.

Projects must also account for emissions from energy use and transportation and show that the captured CO₂ will remain safely stored.

emissions CCS
Source: Verra

Why ICVCM Approval Matters

The ICVCM created the Core Carbon Principles to set a common standard for high-quality carbon credits.

The organization reviews carbon-crediting methodologies to determine whether they meet requirements designed to support credible climate benefits.

This process matters for CCS because these projects can involve several stages and technologies. A project may capture CO₂ at an industrial facility, move it through a pipeline, and then store it deep underground.

Each stage can create emissions or other risks that need to be measured.

As explained before, VM0049 provides rules for accounting for these activities. It is designed to calculate the emissions reductions and carbon removals linked to eligible CCS projects.

Thus, the ICVCM approval gives the methodology an additional credibility signal in the carbon market.

However, the approval applies to the methodology, not automatically to every project using it. Individual projects still need to meet the relevant VCS requirements and verification rules.

That distinction is important as companies look for higher-quality carbon removal credits.

One Framework Covers Several Technologies

One of the main features of VM0049 is its modular design.

Instead of requiring a completely separate methodology for every type of CCS project, Verra created a main framework that can work with different modules.

The approved modules include:

  • VMD0056: Direct air capture
  • VMD0057: CO₂ transport
  • VMD0058: CO₂ storage
  • VMD0059: Bioenergy with carbon capture and storage (BECCS)

This approach gives project developers more flexibility.

For example, a project could capture CO₂ at one location, transport it through a shared pipeline, and store it at a separate geological site. Multiple facilities could also potentially use the same transportation or storage infrastructure.

The framework can also support projects as they grow or add new technologies.

VM0049 has been active since June 2024 and can be used for eligible projects involving geological carbon storage around the world. The methodology was developed by the CCS+ Initiative, South Pole Carbon Asset Management and Perspectives Climate Group, with support from Verra.

verra ccs
Source: Verra

Energy Use Is Also Important

Carbon capture can require large amounts of energy. Therefore, the source of that electricity matters when calculating the overall climate benefit of a project.

VM0049 includes specific requirements for projects that use renewable electricity.

Projects must show that their renewable electricity comes from newly developed renewable sources dedicated to the CCS project. They cannot simply rely on existing renewable generation and assume that the power has no additional climate impact.

This requirement is important because the amount of CO₂ captured does not tell the full story.

A project could capture a large amount of carbon but still have significant emissions from the energy needed to operate its equipment. A robust methodology therefore needs to look at the project’s wider emissions rather than only the captured CO₂.

CCS Could Support the Growth of Carbon Removal

CCS is becoming an important part of the technology-based carbon removal market.

Direct air capture is one example. DAC systems remove CO₂ directly from the atmosphere. The captured carbon can then be transported and stored underground.

BECCS takes a different approach. It uses biomass-based processes to generate energy or products while capturing the resulting CO₂ and storing it.

Both technologies depend on permanent storage and accurate measurement. This makes clear accounting rules important as the industry moves from small demonstration projects toward larger commercial facilities.

VM0049’s modular approach could help developers use one overall framework for different combinations of capture, transport and storage.

At the same time, the methodology can account for emissions linked to each stage of the process.

cdr

What the Approval Means for the Carbon Market

The ICVCM approval gives CCS developers another methodology that has met the organization’s Core Carbon Principles requirements.

For carbon-credit buyers, the approval can make it easier to identify methodologies that have gone through the ICVCM’s integrity assessment.

However, buyers will still need to examine individual projects. Factors such as the technology used, energy source, monitoring system, storage site, and verification process can affect the actual climate benefit of a project.

This will become increasingly important as the carbon removal market expands.

CCS projects are often complex and require significant infrastructure and capital. A clear methodology can help developers measure their climate benefits and give buyers a common framework for evaluating the resulting credits.

The ICVCM approval therefore marks an important step for technology-based carbon removal. It does not remove the need for project-level due diligence, but it gives the market another methodology that has passed an independent integrity assessment.

As more CCS, DAC, and BECCS projects move toward commercial scale, these standards could play an increasingly important role in building confidence in the carbon removal market.

The post Verra CCS Methodology Gets ICVCM Approval as Carbon Removal Market Grows appeared first on Carbon Credits.
CORSIA Credit Crunch: Base Carbon Adds 640,000 Rwanda Credits to Aviation Market

CORSIA Credit Crunch: Base Carbon Adds 640,000 Rwanda Credits to Aviation Market

Toronto-based Base Carbon has secured a major expansion of its aviation-compliance carbon inventory. Verra tagged 639,609 previously issued carbon credits from its Rwanda cookstoves project as eligible for the first phase of CORSIA.

The tagging, announced September 28, 2026, brings the total number of CORSIA-eligible credits issued to date from the project to 1,959,812. The credits use Verra’s VM0050 Energy Efficiency and Fuel-Switch Measures in Cookstoves methodology.

The timing is important. The first phase of CORSIA covers 2024–2026, and aviation operators will soon face their first major compliance cycle under the scheme.

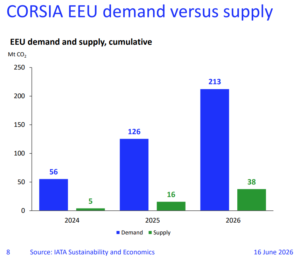
At the same time, the supply of eligible units remains much smaller than expected demand. IATA’s June 2026 estimate shows first-phase CORSIA demand at 213 million tonnes of CO2. In contrast, there’s only 38 million tonnes of eligible-unit supply. This creates a potential shortfall of 175 million tonnes. 

That shortage gives eligible credits a different market value from ordinary voluntary carbon credits.
One Rwanda Project Nears the 2M-Credit Mark

The newly tagged credits come from Base Carbon’s Rwanda Cookstoves Project, developed with the DelAgua Group. The company funded the distribution of about 250,000 fuel-efficient cookstoves to rural Rwandan households. Distribution was completed in late 2022. The project has since moved to Verra’s VM0050 methodology and is now in its issuing phase.

Base Carbon's Rwanda Cookstoves Project
Source: Base Carbon

Base Carbon shared that the project was re-quantified under VM0050 after Verra approved the methodology change in 2025. The revised project is expected to generate about 4.6 million carbon credits over its crediting period.

The September tagging is therefore more than a registry milestone. It increases the portion of the project’s issued inventory that can potentially serve an aviation compliance market.

Base Carbon had already received CORSIA eligibility for earlier credits. In July, Verra tagged 342,356 more credits. This raised Base Carbon’s CORSIA-eligible inventory to about 1.1 million credits. The latest issuance pushes the project’s cumulative CORSIA-eligible tagged volume to almost 2 million tons.

Michael Costa, Chief Executive Officer of Base Carbon, said:

“Today’s announcement further demonstrates the maturity and reliability of our Project through the regular cadence of issuance and eligibility. DelAgua’s consistent operational expertise and execution of the Project continue to strengthen our market position, with fully CORSIA-eligible inventories available to meet aviation compliance demand.”

Why CORSIA Credits Are in Short Supply

The market opportunity comes from CORSIA’s strict eligibility rules. CORSIA is the International Civil Aviation Organization’s global market-based system for addressing the growth of international aviation emissions. It is being implemented in phases, with the first phase running from 2024 to 2026 and the second phase beginning in 2027.

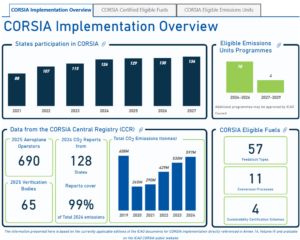
CORSIA implementation overview ICAO
Source: ICAO

Under CORSIA, airlines must cancel approved eligible emissions units to meet their offsetting obligations, but not every carbon credit qualifies. ICAO approved eight emissions-unit programs for the first phase. These include:

  • Verra’s Verified Carbon Standard
  • Gold Standard
  • American Carbon Registry
  • Architecture for REDD+ Transactions
  • Climate Action Reserve
  • Global Carbon Council
  • Isometric
  • Thailand’s voluntary program

Even within those programmes, only certain credits and project types are eligible. For credits generated from 2021 onward, host-country requirements can also apply.

ICAO encourages governments to issue Letters of Authorization. These letters will confirm that credits used under CORSIA won’t count toward national climate targets. This makes CORSIA-eligible supply much narrower than the broader voluntary carbon market.
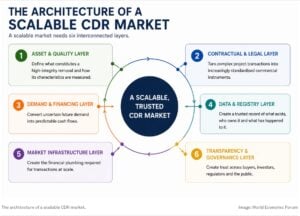
A 175M-Ton Gap Puts a Premium in Play

The shortage is already attracting market attention. IATA’s June estimate showed 213 million tonnes of first-phase demand against 38 million tonnes of supply.

CORSIA EEU demand versus supply

The forecast showed annual demand climbing from around 56 million tonnes in 2024 to 126 million tonnes in 2025. By 2026, it could hit 213 million tonnes. However, supply was only about 38 million tonnes.

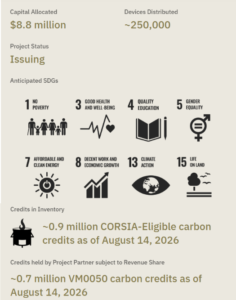
Base Carbon also reported in July that its market data showed the ICE December 2026 CORSIA Phase 1 futures contract had risen about 39% since June 30. The company said the European Commission’s proposal to integrate CORSIA into EU law had added confidence to the market. 

Base Carbon said the new EU framework might create at least 29 million tonnes of CORSIA demand in the first phase. This is compared to an estimated 40 million tonnes of globally tagged Phase 1 supply announced in July. These figures suggest why tagging can materially change the commercial value of previously issued credits.

A credit once just for voluntary use can now benefit a smaller group of regulated aviation buyers if it meets CORSIA requirements.

Beyond Aviation: The Climate Case for Cookstoves

The Rwanda project also illustrates why clean-cooking projects remain important to carbon markets. Traditional cooking with wood and other solid fuels can drive deforestation while creating high levels of household air pollution.

Verra states that its VM0050 methodology offers a better way to measure emissions reductions. This is specifically for improved cookstoves and fuel switching. The Integrity Council for the Voluntary Carbon Market (ICVCM) approved the methodology under its Core Carbon Principles framework.

Verra states that improved cookstoves in its Rwanda projects can cut firewood use by about 71%. This helps lower household air pollution and eases pressure on forests.

The climate benefit comes from lower fuel consumption and the resulting reduction in greenhouse gas emissions. That makes the Rwanda project relevant to both the climate and development sides of the carbon market.

The Credits Are Not All Held by Base Carbon

Another important detail is ownership. As of May 2026, Base Carbon held around 1.1 million VM0050 credits from the project. Additionally, about 700,000 credits were issued to project partner DelAgua through its revenue-sharing agreement.

The September announcement talks about the 639,609 credits issued from the project. It doesn’t say that Base Carbon owns all 639,609 now. This distinction matters because the project’s economics are shared between Base Carbon and DelAgua.

Base Carbon has already monetized part of the eligible inventory. In early 2026, DelAgua sold around 200,000 CORSIA-eligible credits. This marked the first time credits were monetized after the VM0050 transition. The new tagging could create more opportunities to sell credits into the aviation market.

More Rwanda Credits Could Follow

Base Carbon expects the project to continue generating credits. The company estimates that about 2.6 million more credits could be issued. These would be released every six months for the rest of the project’s crediting period. It expects those future credits to become CORSIA-eligible as well. 

That potential future supply is significant when compared with the current market. If delivered as expected, the additional volume would exceed the 1.96 million CORSIA-eligible credits already issued from the project. However, future issuance remains a company forecast. Actual volumes will depend on project performance, verification and continued compliance with CORSIA and Verra requirements.

The company has also warned that future results can differ from its projections because of factors outside its control.

Base Carbon CORSIA credits

CORSIA Phase Two Could Expand the Demand Pool

The Rwanda tagging arrives just months before CORSIA’s second phase begins. From 2027, participation will expand based on ICAO’s criteria, with 134 states participating according to the current ICAO list.

The second phase will run from 2027 through 2035, with some countries exempt under the programme’s rules. That broader participation could increase the need for eligible units.

ICAO has approved four programs to provide credits for the 2027–2029 second phase:

  • American Carbon Registry
  • Architecture for REDD+ Transactions
  • Gold Standard
  • Verra’s Verified Carbon Standard/Jurisdictional Nested REDD Programme.

However, the eligibility window and project-level requirements still apply. This means the market could face a continuing difference between the number of carbon credits in existence and the number that airlines can actually use.

CORSIA Is Turning Eligibility Into a Market Asset

Base Carbon’s latest announcement highlights a major change in the carbon market. For years, the key question for a credit was whether it represented a credible emissions reduction. Increasingly, another question matters: where can that credit legally and credibly be used?

CORSIA eligibility can turn an ordinary voluntary market credit into a unit with access to a regulated aviation market. As CORSIA moves deeper into its first compliance cycle and prepares for broader participation from 2027, credits with verified eligibility could become an increasingly important segment of the global carbon market.

The post CORSIA Credit Crunch: Base Carbon Adds 640,000 Rwanda Credits to Aviation Market appeared first on Carbon Credits.