Philips Breaks New Ground With Healthcare Industry’s First EU Green Bond

Royal Philips has entered the European green bond market with a €650 million issuance that marks a significant step for sustainable finance in the healthcare industry.

The health technology company has priced fixed-rate notes due in 2034 under its European Medium Term Note program. More importantly, Philips says the issuance is the first green bond from the healthcare industry to be issued under the European Union’s European Green Bond Standard, or EuGB.

The move gives Philips access to green financing while setting a higher bar for how healthcare companies can connect debt financing with measurable environmental objectives.

A New Standard for Green Financing

The European Green Bond Standard was created by the European Union to strengthen credibility and reduce greenwashing in the rapidly expanding sustainable finance market.

Unlike conventional green bonds, an EuGB must meet specific requirements linked to the EU Taxonomy. The framework requires issuers to direct bond proceeds toward economic activities that meet defined environmental criteria. It also introduces detailed disclosure requirements and external review.

The standard is voluntary, but it is designed to provide investors with a more consistent way to assess whether green bonds are actually financing environmentally sustainable activities. The European Commission describes the framework as a “gold standard” for green bonds.

The regulatory framework has also continued to develop. In 2025 and 2026, the EU introduced additional rules covering external reviewers, reporting templates and other implementation requirements, strengthening the infrastructure around the EuGB market.

For Philips, issuing under the standard therefore represents more than a green label. It places the company’s financing plans within one of Europe’s most closely defined sustainable finance frameworks.

Where Philips Will Put the Money

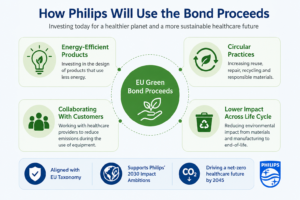
The press release revealed that the company plans to use an amount equivalent to the gross proceeds to finance economic activities aligned with the EU Taxonomy.

  • Its green bond framework focuses heavily on the circular economy and on reducing the environmental impact of healthcare products and operations.
  • It includes supporting the design of more energy-efficient products, increasing the use of circular practices, and working with customers to reduce emissions generated during the use of Philips equipment.

philips green bond S

This approach is particularly relevant to healthcare because medical equipment can remain in service for many years. Energy consumption, materials, maintenance and end-of-life treatment can therefore influence a product’s environmental footprint long after it leaves the factory.

Philips has been incorporating these considerations into its product development strategy through its EcoDesign approach. The company says its product design work focuses on areas including energy efficiency, packaging, materials and circularity.

The green bond can help bring that strategy closer to the company’s capital allocation decisions.

The Financing Fits Philips’ Broader Climate Strategy

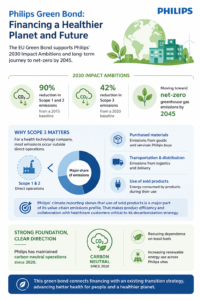
The bond comes as Philips begins implementing its new 2030 Impact Ambitions.

The company aims to reduce its absolute environmental impact across its value chain while moving toward net-zero greenhouse gas emissions by 2045. Its 2030 targets include a 90% reduction in Scope 1 and 2 emissions from a 2015 baseline and a 42% reduction in Scope 3 emissions from a 2020 baseline.

The focus on Scope 3 is particularly important.

philips emissions net zero

For a health technology company, a large share of emissions can sit outside its direct operations. Purchased materials, transportation, distribution and the energy consumed by products during their use can all contribute to the overall footprint.

Philips’ climate reporting shows that use of sold products is a major part of its value-chain emissions profile. That makes product efficiency and collaboration with healthcare customers important components of its longer-term decarbonization strategy.

The company has also said it has maintained carbon-neutral operations since 2020 while working to reduce its dependence on fossil fuels and increase renewable energy use across its sites.

The new green bond therefore connects financing with an existing transition strategy rather than creating a standalone sustainability initiative.

Strong Investor Backing Could Boost EU Green Bond Market

Investor demand for the issuance was another notable feature. The 2034 notes carry a 4% coupon and were priced at 99.655%, producing a yield of 4.055%. The transaction was 2.7 times oversubscribed, indicating demand for the offering exceeded the amount Philips planned to issue.

The demand is significant because the EuGB market is still developing. A large order book for a healthcare issuer using the new standard could help demonstrate that investors are willing to support bonds with stricter environmental requirements.

For companies, this could eventually make credible green financing a more attractive way to fund capital-intensive sustainability investments.

Philips also said the transaction is not expected to increase net debt. Gross debt will temporarily rise before the company’s 2027 bond maturity is repaid. The notes are scheduled to settle on August 28, 2026, with an application made for listing on the regulated market of the Luxembourg Stock Exchange.

Why Healthcare Matters

The issuance comes at a time when healthcare systems face pressure to improve patient outcomes while managing rising costs, resource consumption and climate risks. Healthcare itself has a substantial environmental footprint. Hospitals consume large amounts of electricity and materials, while medical equipment, pharmaceuticals, transportation and supply chains add further emissions.

That creates an opportunity for health technology companies to reduce emissions not only within their own facilities but also through the products they sell. Philips has positioned energy-efficient and circular products as part of that opportunity. The company says its sustainability strategy is designed to help healthcare customers lower environmental impacts while improving efficiency and maintaining quality of care.

Green financing could reinforce this model by directing capital toward technologies and product development that support those goals.

A Potential Blueprint for Other Companies

The bigger significance of the transaction may extend beyond Philips.

The EU green bond framework is designed to make sustainable debt easier for investors to compare and assess. Its taxonomy requirements, transparency rules and external-review provisions aim to reduce uncertainty around what qualifies as genuinely green investment.

Philips’ transaction demonstrates how the framework can be applied to an industry where environmental benefits are not limited to renewable energy or clean infrastructure. Healthcare companies can also use green finance to support energy efficiency, circular economy models, sustainable product design and lower-carbon supply chains.

That could broaden the role of green bonds as companies across traditionally hard-to-decarbonize sectors look for financing mechanisms that support their transition plans.

For Philips, the €650 million bond provides capital for its sustainability strategy while giving investors exposure to a new category of EU-regulated green debt.

As the European green bond market develops, the transaction could become an important reference point for how healthcare companies use sustainable finance to connect climate commitments with real-world investment.

The post Philips Breaks New Ground With Healthcare Industry’s First EU Green Bond appeared first on Carbon Credits.

Tesla’s Cybercab, Robotaxi Push and Solar Pivot Point to a Broader Clean Energy Play

Tesla's Cybercab, Robotaxi Push and Solar Pivot Point to a Broader Clean Energy Play

Tesla is moving deeper into autonomous transport and energy as it prepares to launch its purpose-built Cybercab robotaxi and rebuild its residential solar business around batteries.

Three recent developments show the shift. Tesla is preparing to launch the Cybercab in Austin; Nevada regulators have approved a limited 10-vehicle robotaxi operation, and the company is reshaping its solar business around its Powerwall 3 home battery.

For the clean energy market, the story goes beyond electric cars. Tesla is increasingly combining electric mobility, solar power, and energy storage into a single business model.

Cybercab Moves Closer to Commercial Launch

Tesla appears to be nearing the launch of its Cybercab, a purpose-built electric vehicle designed for autonomous ride-hailing. The EV giant plans to launch the Cybercab in Austin, Texas, on September 3. The company has already tested Cybercabs on public roads and begun preparing for the rollout.

The Cybercab differs from Tesla’s current robotaxi vehicles because it was designed specifically for autonomous operation. That could make it more important to Tesla’s long-term strategy than simply adding self-driving software to existing vehicles.

Tesla has already identified the Cybercab as part of its future autonomous mobility business. The company’s latest annual filing states it is developing a purpose-built Robotaxi. This effort aims to expand its autonomous driving capabilities.

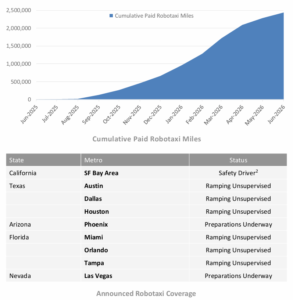
The company reported almost 2.5 million cumulative paid robotaxi miles driven as of June 2026.  If Tesla scales the service, electric robotaxis could lower emissions per passenger trip. This is especially true when they use cleaner electricity, compared to traditional gasoline cars.

Tesla robotaxi plans
Source: Tesla

The climate impact will depend on a few factors. It hinges on how much the vehicles are driven, the electricity used for charging, and whether autonomous ride-hailing replaces private car trips or creates more trips.

Nevada Gives Tesla a 10-Car Autonomous Test

Tesla has also gained regulatory progress in Nevada, although the initial approval is far smaller than the company wanted. Nevada regulators approved Tesla to operate 10 robotaxis in a limited area. The company had sought approval for as many as 5,000 vehicles in Clark County.

The permit limits the initial operation to a defined geographic area. That makes the approval more of a test than a full commercial rollout.

Still, regulatory approval gives Tesla another market in which to test its autonomous technology. The company will need to show that its vehicles can operate safely and reliably before regulators are likely to allow a much larger fleet.

For Tesla, that scale-up matters. A successful robotaxi network could turn electric vehicles from products that consumers buy into a mobility service that generates recurring revenue.

Tesla Puts Solar on a New Battery-First Track

Tesla’s other major shift is happening in solar. Its residential solar business has declined for years since Tesla absorbed SolarCity in 2016.

Electrek reports that Tesla is now trying to rebuild the business around its own solar panels and Powerwall 3, while moving away from the Solar Roof product.

Tesla’s Solar Roof never reached large-scale adoption. Electrek says the company installed about 3,000 Solar Roofs in the U.S. by the end of 2022. This is around 0.17% of all residential solar setups that year.

The new strategy puts more focus on conventional solar panels paired with batteries. That fits Tesla’s wider energy business because customers can generate electricity during the day, store it, and use it later.

Tesla says Powerwall can store solar energy for use at night or during power outages. The model could also help households reduce their reliance on grid electricity and increase their use of renewable power.

Batteries Emerge as Tesla’s Energy Star

While residential solar has struggled, Tesla’s energy storage business has grown much faster.

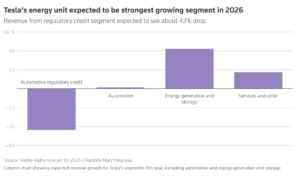
Tesla’s 2025 annual report shows that energy generation and storage revenue rose 27% to $12.77 billion in 2025. Energy storage deployments reached 46.7 GWh, up from 31.4 GWh in 2024.

The business also became more profitable. Tesla reported $3.80 billion in gross profit from energy generation and storage in 2025, compared with $2.64 billion in 2024. Its gross margin rose from 26.2% to 29.8%.

Tesla energy storage business growth 2026

That makes energy storage an increasingly important part of Tesla’s business. The company is expanding beyond household batteries with Megapack, its utility-scale battery system.

The EV maker says more than 77 GWh of Megapack capacity is operational globally, with projects operating in more than 65 countries.

Megapack can store electricity when renewable generation is high and release it when demand rises. This helps grids use more solar and wind power without relying as heavily on fossil-fuel plants during periods of peak demand.

From Robotaxis to Powerwalls: Tesla’s Bigger Energy Play

These three developments may look unrelated, but they point toward a common strategy.

  • Cybercab targets electric transportation. Solar produces renewable electricity. Powerwall and Megapack store that electricity.

Together, they create a broader clean energy ecosystem.

Tesla’s own filings describe energy storage as a way to improve the use of existing generation and transmission capacity. The company also says its storage products can support grids as electricity demand rises.

That becomes especially relevant as electricity demand grows from electric vehicles, data centers, and industrial electrification. Large batteries can help shift electricity from periods of high renewable generation to periods when demand is higher.

For carbon markets, this matters because greater renewable generation and storage can help reduce fossil fuel use in power systems. Yet, battery deployment itself does not automatically create carbon credits. The emissions benefit depends on the electricity sources the batteries charge from and the grid services they provide.

Tesla Stock Slips as Investors Watch the Transition 

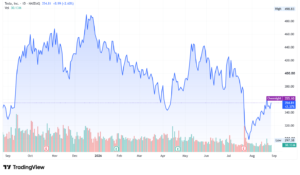
Tesla shares were down on August 26 from the previous session. The TSLA stock was around $345.62 in overnight trading early on August 27. The modest decline came even as Tesla moved forward with its robotaxi plans and energy strategy.

Tesla TSLA stock price

Investors continue to weigh the firm’s large spending on autonomous driving and AI against the growth of its energy business and the potential for new revenue from robotaxis.

Tesla’s stock remains highly sensitive to expectations around autonomous vehicles, rather than only its traditional car business.

The Bigger Clean Energy Story

Tesla’s latest moves show a company trying to expand beyond selling electric cars. The Cybercab could turn electric vehicles into an autonomous transport service. The Nevada permit gives Tesla a small but important regulatory test.

Meanwhile, the solar business is shifting toward a simpler solar-plus-battery model, while energy storage is already producing billions of dollars in annual revenue.

If Tesla can continue scaling batteries while adding renewable generation and autonomous electric transport, it could build a much broader clean energy platform.

The key question is whether the automaker can turn its growing mix of electric vehicles, robotaxis, solar and batteries into a scalable system that cuts emissions while also creating durable growth.

The post Tesla’s Cybercab, Robotaxi Push and Solar Pivot Point to a Broader Clean Energy Play appeared first on Carbon Credits.

Microsoft and Aker Solutions Join Forces to Accelerate Carbon Removal Projects

Aker Solutions and Microsoft (MSFT) are joining forces to help move carbon capture and storage (CCS) and carbon dioxide removal (CDR) projects from early-stage concepts to construction and operations.

The companies signed an agreement at ONS 2026 in Stavanger, Norway, as the carbon management industry faces a familiar challenge: plenty of proposed projects, but not enough financing, firm buyers and execution-ready developments.

Aker Solutions Targets Faster, More Bankable CCS and CDR Projects

Under the agreement, Aker Solutions will work with project developers, industrial emitters, transport and storage companies, governments and other stakeholders. The goal is to improve project economics, reduce execution risks and make projects more attractive to investors.

The partnership also aims to help projects reach final investment decisions (FID) faster.

Microsoft brings digital technology, artificial intelligence (AI), data, carbon markets and monitoring, reporting and verification (MRV) expertise. Aker Solutions brings techno-economic advisory services and engineering, procurement and construction capabilities.

Together, the companies intend to create a more integrated path from feasibility studies to project delivery and operations.

Kjetel Digre, CEO at Aker Solutions, said,

“Many carbon capture and removal projects face similar challenges as they move from concept to reality. As the market matures, success will depend on strong collaboration across the value chain. Joining forces with Microsoft, we aim to help project developers navigate complexity, strengthen business cases, and support the next wave of CCS and CDR projects.” 

Microsoft’s Carbon Challenge Is Growing

The partnership comes as Microsoft faces a tougher emissions challenge from the rapid expansion of artificial intelligence and cloud infrastructure.

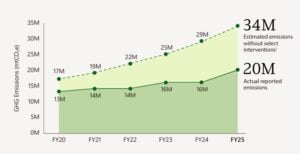
  • Microsoft’s latest Environmental Sustainability Report shows that its total Scope 1, 2 and 3 emissions rose 25% year over year in fiscal 2025.
  • The company reported about 20.3 million metric tons of CO2 equivalent in FY25, up from roughly 16.2 million tons in FY24.

The increase was primarily due to the expansion of its data center infrastructure and a change in its use of non-additional, unbundled renewable energy certificates.

Scope 3 emissions remain the largest part of Microsoft’s footprint. At the same time, Scope 2 emissions increased sharply as the company expanded its electricity demand. Scope 2 accounted for about 13% of total emissions in FY25, compared with nearly 2% in the previous year.

microsoft emissions
Source: Microsoft

Microsoft said it matched 100% of its annual global electricity consumption with renewable energy in FY25. However, the company is increasingly focused on adding new carbon-free electricity to grids rather than relying on unbundled certificates alone.

The rise in emissions makes carbon removal an increasingly important part of Microsoft’s strategy. It has committed to becoming carbon negative by 2030 and removing the equivalent of all its historical emissions by 2050. But the company has also stressed that removals cannot replace direct emissions reductions.

That puts pressure on Microsoft to expand both its clean-energy investments and its carbon removal portfolio.

Darryl Willis, corporate vice president, energy and resources at Microsoft, said:

“Microsoft supports collaborations that look holistically across the entire value chain, connecting physical infrastructure with trusted data, AI and digital MRV to help projects reduce risk, and move from ambition to execution. We are working with Aker Solutions to bring these complementary capabilities together and help accelerate credible CCS and carbon removal projects globally.”

Microsoft Has Become the Biggest CDR Buyer

Microsoft has played an outsized role in building the market for durable carbon removal.

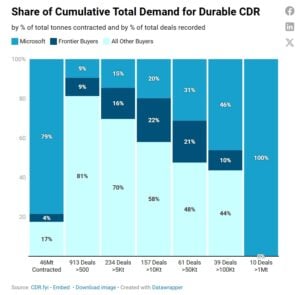
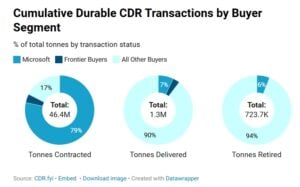
CDR.fyi estimates that Microsoft had contracted 36.4 million tonnes of durable carbon removal by April 2026. That represented 78.5% of all disclosed durable CDR tonnes contracted at the time.

Frontier-linked buyers accounted for another 4%, while all other buyers represented 17.5%.

microsoft CDR

Its position is even more significant when looking at large-scale deals. CDR.fyi says Microsoft is the only buyer to have signed disclosed purchase agreements exceeding 1 million tonnes.

Its portfolio is also heavily concentrated in bioenergy with carbon capture and storage, or BECCS, which represented about 76% of its disclosed durable CDR volume as of April.

Microsoft continued buying carbon removal in 2026. In the first quarter, it signed a 1-million-tonne agreement that helped push total durable CDR contracting to 2.3 million tonnes, the largest first quarter on record. Microsoft accounted for about 43% of Q1 contracted volume.

The company has also expanded into other removal approaches. In January 2026, Microsoft signed a 12-year agreement to purchase 2.85 million soil carbon removal credits from Indigo Ag. The deal was described as the largest voluntary soil carbon transaction to date.

CDR Supply Still Faces a Financing Gap

The growing number of purchases does not mean enough carbon removal capacity is ready to meet future demand.

Carbon Direct’s 2026 State of the Voluntary Carbon Market report analyzed 288 million tonnes of credits and found that more than 80% of high-durability CDR supply planned for 2030 is at risk of not being realized without additional offtake commitments and financing.

The report also identified an estimated $18 billion financing gap across CDR pathways.

microsoft cdr
Source: Carbon Direct

That creates a major bottleneck for technologies such as direct air capture, BECCS and other forms of durable carbon removal. Developers need long-term buyers before they can secure financing, while buyers need confidence that projects will actually be built and deliver verified removals.

This is where the Microsoft-Aker Solutions agreement could become important.

From Carbon Credits to Bankable Projects

Aker Solutions will help developers improve project maturity and bankability before construction begins.

That could include assessing project economics, engineering requirements, infrastructure needs and execution risks. Microsoft can complement this work with digital tools, AI, data systems, carbon-market knowledge and MRV capabilities.

The companies will also work across the wider CCS and CDR value chain.

That matters because carbon management projects are not standalone facilities. A CCS project needs an emitter, capture technology, transportation infrastructure, a storage site and a system for measuring and verifying the captured CO2.

CDR projects face similar challenges. Developers need reliable technology, financing, monitoring systems, storage or durable carbon sinks, and buyers willing to sign long-term contracts.

Aker Solutions and Microsoft aim to connect these pieces earlier in the development process.

If projects move successfully through FID, the companies plan to provide integrated engineering and execution support through construction and into operations.

A Critical Test for the CDR Market

The partnership arrives at a turning point for carbon removal.

CDR demand is growing, but the market remains heavily concentrated among a small number of buyers. CDR.fyi found that buyers other than Microsoft and Frontier accounted for 90% of delivered and 94% of retired durable CDR tonnes, despite representing a much smaller share of contracted volume.

demand of CDR credits

That highlights the market’s central challenge: large future purchase agreements do not automatically translate into delivered removals. And for the wider industry, the partnership reflects a shift in focus from announcing carbon removal projects to making them financeable, buildable and operational.

The next phase of the CDR market will depend less on ambitious targets and more on whether developers can secure capital, buyers and infrastructure to deliver real, verified removals at scale.

The post Microsoft and Aker Solutions Join Forces to Accelerate Carbon Removal Projects appeared first on Carbon Credits.

Nvidia Earns $96B in Q2 FY2027 as AI Demand Surges, But Emissions Keep Rising

Nvidia Earns $96B in Q2 FY2027 as AI Demand Surges, But Emissions Keep Rising

Nvidia’s latest results show that the artificial intelligence boom is still accelerating, with revenue more than doubling from a year earlier. But the company’s rapid growth also highlights a growing climate challenge: Nvidia’s Scope 3 emissions reached 10.7 million metric tons of CO2e in fiscal 2026, driven largely by its expanding supply chain.

Nvidia reported its second-quarter fiscal 2027 results on August 26, 2026, with revenue of $96.2 billion, up 106% year-on-year. Data Center revenue reached $89.0 billion, up 117%, as demand for AI computing continued to drive sales.

Jensen Huang, founder and CEO of Nvidia, remarked during the earnings call:

“AI has reached its inflection point. It’s doing useful work. Its tokens are productive and profitable. Now, compute is revenue. And demand is accelerating. This time last year, one lab alone was driving the buildout; today, we have a golden age of new AI labs and startups, multiple frontier labs scaling in parallel, a thriving open-model ecosystem and physical AI coming online — with strong momentum across the U.S. and around the world. The AI infrastructure buildout is at full steam. Vera Rubin, now in full production, was built to power exactly this moment.”

The results show the strength of Nvidia’s business. Yet, they also raise a bigger question for the clean energy market: can AI infrastructure grow this quickly while companies reduce the emissions tied to that growth?

Nvidia’s AI Engine Blasts Past $96 Billion

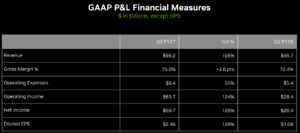
Nvidia’s Q2 revenue jumped to $96.221 billion, compared with $46.743 billion a year earlier. Net income rose 126% to $59.688 billion, while diluted earnings per share climbed 128% to $2.46.

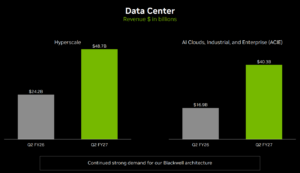
The Data Center business remains the main growth engine. Revenue from the segment reached $89.0 billion, up 117% from a year earlier and 18% from the previous quarter. That means Data Center sales accounted for about 92% of Nvidia’s total quarterly revenue.

Nvidia data center revenue Q2 2027
Source: Nvidia

Nvidia also maintained a 75% gross margin in the quarter. The tech giant expects the momentum to continue. It forecasts $108 billion in revenue for the third quarter, plus or minus 2%. Nvidia does not include any Data Center computing revenue from China in that forecast.

The company also returned about $26 billion to shareholders through share buybacks and dividends during the quarter.

Nvidia financial results q2 2027
Source: Nvidia

The AI Boom Is Also an Energy Boom

Nvidia’s earnings matter to the carbon market because its chips sit at the center of the expanding AI infrastructure system. AI data centers need large amounts of electricity to run and cool servers. Nvidia’s own latest sustainability report acknowledges that AI demand will increase energy use and says energy is the foundation of the AI infrastructure stack.

The company is trying to address part of this problem through more efficient computing.

The chipmaker says its Vera Rubin NVL72 platform can deliver up to 10 times the energy efficiency of its previous Blackwell architecture. Its Vera CPU can also run up to 50% faster with twice the energy efficiency of traditional CPU infrastructure.

Nvidia also says its Groq 3 LPX combined with Vera Rubin NVL72 can deliver up to 35 times more inference performance per watt than the Blackwell GB200 NVL72 for trillion-parameter models.

These improvements matter because higher performance per watt can reduce the electricity needed for a given amount of computing. But efficiency gains do not automatically reduce total emissions if companies deploy far more AI computing.

Scope 3 Emissions Hit 10.7 Million Tons

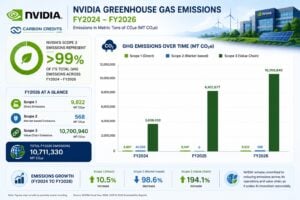
This is where Nvidia’s latest sustainability data becomes important. Its FY2026 Sustainability Report shows Scope 3 emissions of 10,700,940 metric tons of CO2e, up from 6,912,577 tons in FY2025 and 3,638,432 tons in FY2024.

That means Scope 3 emissions increased about 55% in one year and almost threefold in two years. Scope 3 covers indirect emissions across a company’s value chain. For Nvidia, the largest source comes from purchased goods and services.

Category 1 emissions reached 9,301,735 metric tons of CO2e in FY2026. That represented about 87% of Nvidia’s reported Scope 3 emissions.

NVIDIA GHG emissions 2026

The increase reflects the scale of Nvidia’s hardware business and the emissions linked to manufacturing the components and systems needed for its products.

This is important because Nvidia operates mainly as a fabless semiconductor company. Much of the physical manufacturing takes place through suppliers rather than inside Nvidia-owned factories.

Direct Emissions Are Much Smaller

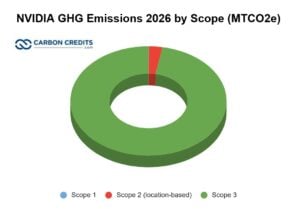
Nvidia’s direct operational emissions remain far below its Scope 3 footprint, as shown in the chart above.

In FY2026, the company reported 9,822 metric tons of Scope 1 emissions. Its market-based Scope 2 emissions were 568 tons. Together, Scope 1 and market-based Scope 2 emissions totaled 10,390 tons. Nvidia also reported 308,891 tons of location-based Scope 2 emissions.

The difference comes from the way the company accounts for purchased electricity. Nvidia says it matched 100% of its global electricity use with clean electricity in FY2026 through sources including on-site solar, long-term power purchase agreements, renewable electricity tariffs and energy attribute certificates.

That helped reduce its market-based Scope 2 figure. But it does not remove the much larger emissions connected to its supply chain. The data shows why Nvidia’s biggest climate challenge sits outside its own offices and facilities.

Nvidia Sets 2030 Climate Targets as Emissions Keep Climbing

The world’s most valuable company does have science-based emissions targets.

From a FY2023 base year, the company aims to cut absolute Scope 1 and Scope 2 market-based emissions by 50% by FY2030. It also aims to reduce Scope 3 emissions intensity from the use of sold GPU products by 75% per petaFLOP by FY2030. The Science Based Targets initiative has validated both targets.

The Scope 3 goal is an intensity target, not an absolute emissions target. This distinction matters.

Nvidia can reduce emissions per unit of computing performance while its total emissions continue to rise if it sells enough additional GPUs and systems. The FY2026 figures show why that issue is important.

Nvidia’s Scope 3 emissions rose from 6.91 million tons to 10.70 million tons in one year, even as the company continued to improve the efficiency of its products.

Nvidia GHG emissions 2026 by scope
Data source: Nvidia

Nvidia Pushes Clean Power and Grid Flexibility

Nvidia says it has matched 100% of its global electricity use with clean electricity for two consecutive years. However, its biggest emissions source remains its supply chain, so the company is using more supplier-specific data to better track Scope 3 emissions and identify areas for cuts.

Nvidia is collaborating with Emerald AI, the Electric Power Research Institute (EPRI), and energy firms. They aim to create AI data centers that adjust power use according to grid conditions.

The company says this approach could help unlock up to 100 gigawatts of U.S. power capacity by using existing infrastructure more efficiently. Nvidia is also exploring onsite power generation and energy storage to help data centers connect faster and reduce grid pressure.

For the clean energy market, the strategy shows how AI companies are moving beyond clean electricity purchases toward more flexible power systems.

Nvidia (NVDA) Stock Jumps After Earnings, but Expectations Remain High

Nvidia stock initially dipped after its earnings release before jumping 4.2% in heavy after-hours trading, with more than 50 million shares changing hands, according to LSEG data. Investors responded to Nvidia’s stronger-than-expected results and its forecast for 70% revenue growth in fiscal 2028.

The company also expects $108 billion in third-quarter revenue, while Data Center revenue rose 117% to $89 billion in the latest quarter.

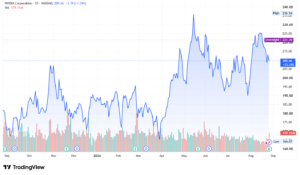
Nvidia NVDA stock

Despite the rebound, Nvidia stock remain up only more than 12% this year, compared with a more than 60% gain for the Philadelphia Semiconductor Index. Reuters noted that investor expectations have become so high that simply beating forecasts may no longer be enough to drive the stock higher.

AI’s Carbon Challenge Is Moving Upstream

Nvidia’s latest earnings make the AI boom look stronger than ever. But its latest sustainability report tells another part of the story.

The company is improving energy efficiency, matching its electricity use with clean power, and working on grid-friendly AI infrastructure. It also has science-based 2030 emissions targets. Still, the rapid rise in Scope 3 emissions shows the scale of the challenge.

Nvidia’s next sustainability test will not simply be whether each new GPU uses less energy. It will be whether the company can make its fast-growing AI supply chain cleaner as demand for computing continues to surge.

The post Nvidia Earns $96B in Q2 FY2027 as AI Demand Surges, But Emissions Keep Rising appeared first on Carbon Credits.

Japan Advances Maritime CCS Hub to Ship 3.43M Tons of CO2 a Year

Japan Advances Maritime CCS Hub to Ship 3.43M Tons of CO2 a Year

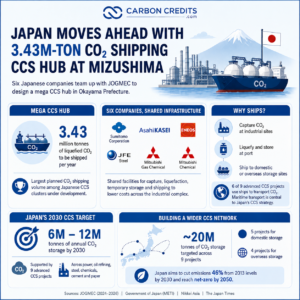
Japan is moving ahead with plans for a major carbon capture and storage (CCS) hub at the Mizushima Industrial Complex in Okayama Prefecture. Six Japanese companies have signed a contract with the Japan Organization for Metals and Energy Security (JOGMEC) to design facilities that will capture, liquefy, temporarily store and ship carbon dioxide. The planned hub could ship about 3.43 million tonnes of liquefied CO2 a year.

The project is part of Japan’s wider push to build a commercial CCS industry by 2030. It also shows how Japan plans to use ships to connect industrial areas with underground CO2 storage sites.

Six Companies Team Up on a Mega CCS Hub

The project brings together Sumitomo Corporation, Asahi Kasei, ENEOS, JFE Steel, Mitsubishi Gas Chemical and Mitsubishi Chemical. They will design facilities for CO2 capture, liquefaction, temporary storage and shipping.

The project covers the Mizushima industrial area in Kurashiki City, a major industrial center in western Japan. The companies plan to share infrastructure across the industrial area instead of having each company build its own system.

That could help lower costs and make CCS more practical for several industrial facilities at once.

The planned hub would ship about 3.43 million tonnes of liquefied CO2 per year when shipping starts. The companies say this would be the largest planned CO2 shipping volume among Japanese CCS clusters currently under development.

Why Japan Is Putting CO2 on Ships

CCS involves more than capturing carbon.

Companies must move the captured CO2 to a site where they can store it underground. But many of Japan’s large industrial centers do not sit close to suitable storage sites. Ships can solve part of this problem.

Captured CO2 can be turned into a liquid, stored at a port, and loaded onto specialized ships. The ships can then move the CO2 to domestic or overseas storage sites.

JOGMEC selected nine advanced CCS projects in 2024. Together, they aim to store about 20 million tonnes of CO2 a year. Six of the nine projects use ships to transport liquefied CO2, while three use pipelines. This makes maritime transport a key part of Japan’s CCS strategy.

Japan Targets 6M to 12M Tons of CO2 Storage by 2030

Japan wants to start commercial CCS operations by 2030.

JOGMEC’s nine advanced projects support a government target of 6 million to 12 million tonnes of annual CO2 storage by 2030. The nine projects cover industries such as power generation, oil refining, steel, chemicals, cement and paper.

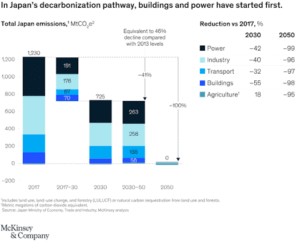
Japan also aims to reach net-zero greenhouse gas emissions by 2050. It has set a 2030 target of cutting emissions by 46% from fiscal 2013 levels. McKinsey & Company shows below how the country could reach its climate goals. 

Japan carbon neutrality 2050 McKinsey
Source: McKinsey & Company

The Mizushima project could make a large contribution to the country’s CCS infrastructure if it reaches its planned shipping volume.

However, 3.43 million tonnes refers to CO2 shipped, not CO2 permanently stored. The climate benefit will depend on how much captured CO2 ultimately reaches approved storage sites and remains underground.

Shared Infrastructure Could Bring CCS Costs Down

Cost is one of the biggest challenges for maritime CCS. Ship-based systems require extra equipment to liquefy and temporarily store CO2 before shipping. JOGMEC says these steps can add costs compared with pipeline systems. Ship transport can also be more expensive.

Japan is therefore trying to build larger hubs.

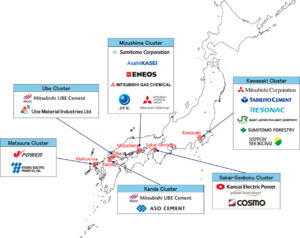
In June 2026, JOGMEC selected six emitter clusters to study shared facilities for CO2 capture, liquefaction, temporary storage and shipping. The goal is to collect CO2 from several nearby facilities and share infrastructure.

JOGMEC six selected CCS hub clusters
Source: JOGMEC

Mizushima follows this same approach. A shared hub could spread the cost of expensive equipment across several companies. It could also make it easier to add new emitters later.

Mizushima Aims Hard-to-Cut Emissions

The Mizushima industrial area includes companies from sectors such as chemicals, steel and energy. These industries face a difficult emissions challenge. Some emissions come directly from industrial processes and cannot be eliminated simply by switching to renewable electricity.

CCS can provide another tool.

Companies can capture CO2 at industrial facilities, transport it and store it underground. This could help reduce emissions from operations that are difficult to fully electrify.

The six companies say the project will also support the green transformation of the Mizushima industrial complex. For Japan, that links CCS with both climate policy and industrial competitiveness.

Japan Is Building a Wider CCS Network

Mizushima is only one part of Japan’s developing CCS system. JOGMEC began supporting advanced CCS projects in 2023. The first seven projects aimed to store about 13 million tonnes of CO2 per year.

The agency later expanded the program to nine projects with a combined target of about 20 million tonnes a year. The projects cover several regions and industries.

Some plan to store CO2 in Japan. Others will ship captured CO2 to storage sites elsewhere in the Asia-Pacific region. Four of the nine 2024 projects target overseas storage.

This approach could eventually create a regional CO2 transport network linking Japan with storage resources in other countries.

Japan Has Already Tested CCS

Japan has experience with both carbon storage and CO2 transport. At the Tomakomai CCS demonstration project in Hokkaido, the country injected about 300,000 tonnes of CO2 underground between 2016 and 2019. The government continues to monitor the stored CO2.

Japan has also tested technologies for transporting liquefied CO2 by ship. These projects have helped the nation develop experience with the equipment and processes needed for a larger CCS industry. The government is now moving from demonstration projects toward commercial-scale systems.

Japan CCS hub carbon shipping

A New Legal Framework Supports CCS 

Japan also created a legal framework for the industry. In May 2024, the country’s parliament passed the Act on Carbon Dioxide Storage Business. The law created a licensing system for companies that want to operate CO2 storage businesses. That framework is important because CCS projects require large investments and long operating periods.

Companies need clear rules covering storage rights, monitoring, safety, and responsibility for stored CO2. Government support also remains important as companies develop the first commercial projects.

JOGMEC is supporting the full CCS chain, from capture and transport to underground storage.

CCS Must Move Beyond Capture

The Mizushima project still has several steps to complete. The current agreement covers design work, so the 3.43-million-tonne figure is a planned shipping volume rather than operating capacity. The companies still need to complete engineering work, develop the business model and make further investment decisions.

The storage side is also critical. Capturing millions of tonnes of CO2 has little climate value if companies cannot transport and permanently store the gas safely.

Japan’s long-term goal shows the scale of the challenge. JOGMEC estimates that Japan could need 120 million to 240 million tonnes of annual CO2 storage by 2050 to support its net-zero goal. That means Mizushima would be an important step, but only one part of a much larger system.

Mizushima Could Set the Course for Asian CCS

Japan’s planned 3.43-million-tonne annual CO2 shipping hub shows how quickly the country is trying to build a commercial CCS network. The project combines several large industrial companies, shared infrastructure and maritime CO2 transport. That model could help lower costs and connect industrial regions with storage sites that are far away.

The key test will be whether Japan can move from design to investment and then to reliable, large-scale CO2 storage. And if it succeeds, Mizushima could become an important model for hub-based maritime CCS in Japan and across Asia.

For now, the project is another sign that Japan sees carbon capture and storage as a major tool for cutting emissions from heavy industry while building a new carbon-management infrastructure.

The post Japan Advances Maritime CCS Hub to Ship 3.43M Tons of CO2 a Year appeared first on Carbon Credits.

Microsoft Taps Qcells to Power AI Growth as Data Centers Stress the Grid

Microsoft Taps Qcells to Power AI Growth as Data Centers Stress the Grid

Microsoft is expanding its partnership with solar manufacturer and clean energy company Qcells to explore a new way of powering the growing (artificial intelligence) AI infrastructure boom.

The companies announced that they will work on ways to pair Microsoft’s expanding data center footprint with new energy generation and flexible energy resources. The goal is to add power capacity alongside AI infrastructure instead of simply placing more demand on existing local grids.

Andy Park, CEO of Qcells, remarked:

“Our relationship with Microsoft began with American-made solar manufacturing and construction. Now we’re exploring how we can build the energy capacity needed for AI while creating lasting value for the communities that share the grid.” 

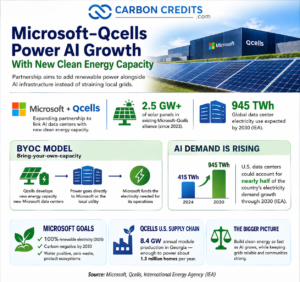
The partnership comes as AI pushes electricity demand higher. The International Energy Agency (IEA) expects global data center electricity use to more than double to about 945 terawatt-hours (TWh) by 2030. AI is the main driver of that growth.

For Microsoft, the deal also fits into a wider effort to expand AI while meeting its climate goals.

BYOC: New Power Model Could Take Pressure Off Local Grids

Microsoft and Qcells teamed up in 2023. Their alliance includes over 2.5 gigawatts (GW) of solar panels. It also covers engineering, procurement, and construction services for solar projects.

The new agreement goes beyond solar equipment. The companies now want to explore a model that links AI data centers with new energy capacity.

Instead of simply adding AI-related electricity demand to the grid, the companies want to develop new generation and flexible energy resources at the same time. They say this could support grid reliability while allowing AI infrastructure to grow.

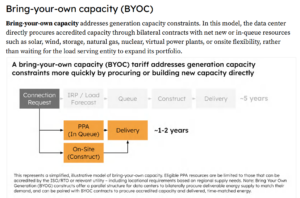
The companies are exploring a “bring-your-own-capacity” (BYOC) model. Under the plan, Qcells could develop and build new energy capacity near Microsoft’s data centers. The power could go directly to Microsoft or to the local utility, with Microsoft funding the electricity needed for its operations.

The partnership will also explore virtual power plants (VPPs) that connect thousands of residential and commercial batteries into one flexible grid resource. The batteries could support the grid during peak demand while customers continue using them normally at other times. Participants could also receive lower electricity bills or payments for supporting the grid.

bring your own capacity BYOC model
Source: Brancucci, C. et al., Flexible Data Centers: A Faster, More Affordable Path to Power, 2025.

Qcells plans to prioritize income-qualified households in the VPP program. The companies say this could help spread some of the economic benefits of AI infrastructure to the communities where data centers are built.

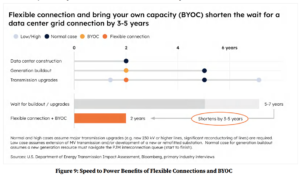
Qcells says the approach could include new generation and flexible energy resources that support Microsoft’s growing data center network across the United States. Moreover, paired with flexible connection, the BYOC model could significantly help reduce the time needed for power generation.

BYOC and flexible connection model
Source: Brancucci, C. et al., Flexible Data Centers: A Faster, More Affordable Path to Power, 2025.

The companies have not announced a specific amount of new generation capacity under the expanded agreement. This is an important point. The partnership is currently an effort to develop and test a new approach. It is not yet a commitment to build a specific number of gigawatts of new power plants.

AI Is Creating a New Power Challenge

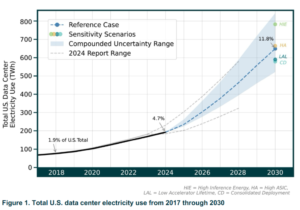
The need for new energy is growing with AI. The IEA estimates that data centers consumed about 415 TWh of electricity in 2024. Under its base case, that figure could reach around 945 TWh by 2030. Data center electricity use would then account for just under 3% of global electricity consumption.

The United States faces an even larger challenge. The IEA expects U.S. data centers to account for nearly half of the country’s electricity demand growth through 2030.

US data centers electricity use 2030

AI data centers can also have very high power needs at individual sites. This can put pressure on transmission networks, local distribution systems and available generation.

That makes Microsoft’s new approach important. The companies want to see data center growth as a chance to add energy resources, not just a demand for the existing grid to handle.

Microsoft Has Already Expanded Renewable Energy

The Qcells deal builds on Microsoft’s broader renewable energy strategy. Microsoft says it matched 100% of its global electricity consumption with renewable energy in 2025. The company uses power purchase agreements and other long-term contracts to support renewable projects.

A power purchase agreement, or PPA, is a long-term contract to buy electricity from an energy project. Microsoft says these agreements can help developers secure financing for new wind, solar, and other carbon-free energy projects.

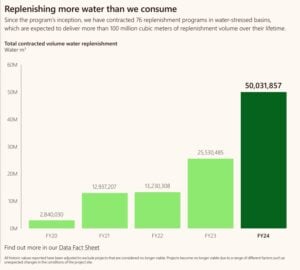
The company has also set a goal of becoming carbon negative by 2030. That means Microsoft aims to remove more carbon from the atmosphere than it emits. Its other 2030 goals include becoming water positive, reaching zero waste, and protecting ecosystems.

water replenishment
Source: Microsoft

These targets are becoming harder to achieve as Microsoft builds more AI infrastructure.

AI Growth Is Making Microsoft’s Emissions Challenge Harder

Microsoft’s sustainability data show the challenge. The company’s latest Environmental Sustainability Report covers fiscal year 2025 and measures progress against its 2020 baseline. Microsoft says the rapid growth of AI is changing the environmental impact of its infrastructure.

The company’s supply chain is also a major source of emissions. Microsoft says about 70% of its emissions come from purchased goods, services, and capital goods, according to its 2026 sustainability report. That includes the materials and equipment needed to build data centers and AI infrastructure.

This creates a difficult balance.

Microsoft needs to build more data centers to meet demand for AI services. At the same time, the company must reduce the emissions linked to construction, electricity use, equipment, and its wider supply chain.

Adding new renewable energy alongside that infrastructure could help address part of the problem.

Qcells Builds the Solar Supply Chain Behind the Deal

Qcells also brings a growing U.S. manufacturing base to the partnership. The company has been building a vertically integrated solar supply chain in Georgia. Its Cartersville facility is designed to bring Qcells’ annual module production capacity to 8.4 GW. The company says that it is enough to produce nearly 46,000 panels per day and power about 1.3 million homes annually.

The expansion supports a broader effort to build more solar manufacturing capacity in the United States. For Microsoft, working with a domestic solar manufacturer could help connect its data center growth with new U.S. energy supply.

Still, the partnership’s new phase is broader than solar panels alone. The companies are looking at how generation and flexible resources can work together with AI infrastructure.

Microsoft Qcells partnership

Could Microsoft’s Model Help Build Power as Fast as AI?

Microsoft and Qcells are testing a model that could build new energy supply alongside AI data centers, rather than placing all new demand on existing grids. The approach could combine solar generation, batteries and other flexible resources to support grid reliability as data center demand grows.

The need is significant. The IEA expects electricity for data centers to grow from 460 TWh in 2024 to over 1,000 TWh by 2030. It might even hit 1,300 TWh by 2035. That growth will require closer coordination between data center developers, utilities and energy companies.

Microsoft has already matched 100% of its electricity consumption with renewable energy and aims to become carbon negative by 2030. The Qcells partnership could take that strategy further by linking new clean energy capacity directly with new AI demand.

The companies have not disclosed how much generation or storage the partnership could ultimately add. Its success will depend on whether the model can scale while supporting communities, strengthening local grids and meeting the growing power needs of AI.

The post Microsoft Taps Qcells to Power AI Growth as Data Centers Stress the Grid appeared first on Carbon Credits.

Carbon Credit Prices Explained: What Determines the Value of a Carbon Credit?

Carbon Credit Prices Explained: What Determines the Value of a Carbon Credit?

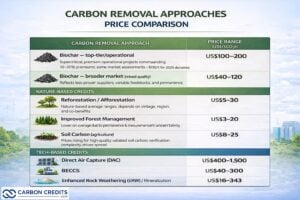
Carbon credits do not have one fixed price. Their value can range from less than $1 to hundreds or even thousands of dollars per metric ton of carbon dioxide equivalent (tCO₂e), depending on the type of credit, its quality, and market demand.

This wide price range can make carbon credits difficult for newcomers to understand. Why does one credit cost a few dollars while another can cost hundreds?

The answer is that carbon credits are not interchangeable products. They can represent different types of emissions reductions or carbon removals, come from different locations and years, and have different levels of environmental integrity.

Understanding these factors is important for companies, investors, and other buyers looking to purchase carbon credits.

What Is the Average Price of a Carbon Credit?

There is no single global carbon credit price because the voluntary carbon market (VCM) includes credits from thousands of different projects.

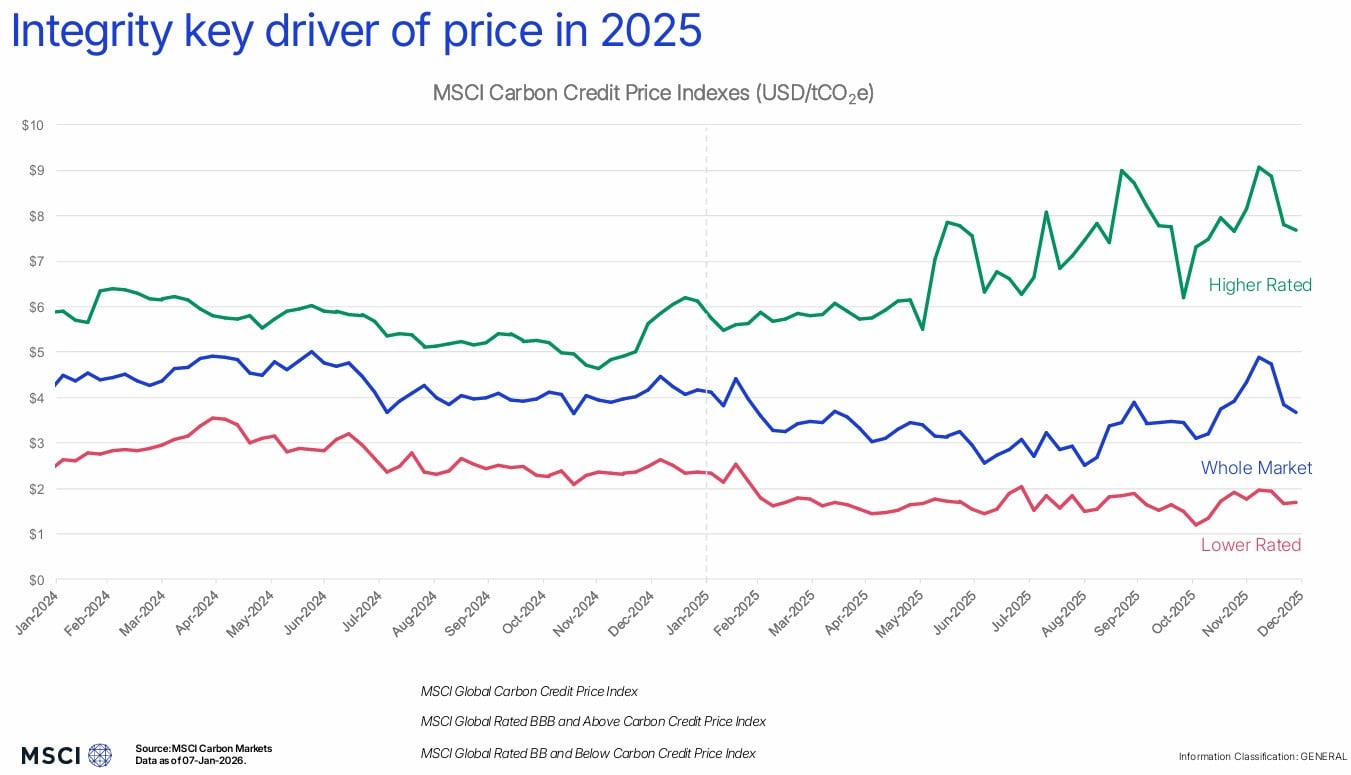
In 2025, the MSCI Global Carbon Credit Price Index averaged $3.50 per tCO₂e, down from $4.30 in 2024. However, credits rated BBB or above averaged $6.80/tCO₂e, showing the premium buyers can pay for credits with stronger quality characteristics.

Prices can vary even more by project type. MSCI’s data showed many voluntary carbon credits trading from below $1/tCO₂e to nearly $50/tCO₂e. Engineered carbon removal credits can cost far more, with some selling for more than $1,000/tCO₂e.

carbon credit price 2025 MSCI

These figures show why an “average carbon credit price” can be misleading. The type and quality of the credit matter greatly.

What Determines the Price of a Carbon Credit?

Several factors influence how much buyers are willing to pay.

Project Type

The type of project generating the credit is one of the biggest pricing factors.

Some projects focus on avoiding or reducing emissions. Examples include methane capture, renewable energy, and clean-cooking projects. Others remove carbon dioxide from the atmosphere, such as reforestation, biochar, direct air capture, and other carbon removal technologies.

Removal credits can command higher prices because they physically remove carbon from the atmosphere. Some removal methods also require significant investment, energy, or specialized technology.

Credit Quality

Quality is becoming one of the most important factors in carbon credit pricing.

Buyers increasingly assess whether a project creates a real, measurable, and additional climate benefit. They may also consider how long the carbon remains stored, how accurately the emissions reduction or removal is measured, and whether the project creates risks of leakage or double counting.

Credits that perform better on these factors can command a premium.

Market data found that the price gap between higher- and lower-rated carbon credits widened significantly in 2025. This suggests that buyers are becoming less willing to treat all carbon credits as equivalent.

Why Do Carbon Removal Credits Cost More?

Carbon removal is particularly important to the future of the carbon market, but removing carbon from the atmosphere is often more expensive than avoiding or reducing emissions.

For example, a forest restoration project may remove carbon through natural growth, while direct air capture uses specialized equipment to extract carbon dioxide directly from the atmosphere.

These approaches have very different costs and technical requirements. As a result, some engineered carbon removal credits can cost more than $1,000/tCO₂e, compared with less than $1 for some conventional carbon credits.

biochar price omparison carbon removal methods

However, higher prices do not automatically mean a project is better. Buyers still need to examine the project’s methodology, measurement, permanence, verification, and other quality factors.

Does Location Affect Carbon Credit Prices?

Yes. The location of a project can influence its price because different regions have different project costs, risks, regulations, supply levels, and buyer preferences.

Projects can also generate additional environmental or social benefits. For example, a forest project may protect biodiversity and support local communities in addition to reducing or removing emissions.

These benefits can make certain credits more attractive to buyers, particularly companies looking to support broader environmental or social goals.

However, a credit should not command a higher price simply because it comes from a particular country or region. Buyers should assess the actual quality and impact of the project.

Does the Vintage of a Credit Matter?

The vintage refers to the year in which the underlying emissions reduction or carbon removal occurred.

Vintage can affect price because buyers may prefer newer credits or credits from particular years. Older credits may trade at discounts depending on the project type, market demand, and buyer requirements.

However, newer does not automatically mean better. The quality of the underlying project remains more important than the vintage alone.

How Does Supply and Demand Affect Carbon Prices?

Like other markets, carbon credit prices are influenced by supply and demand.

If many buyers want a limited supply of credits from a particular project type, prices can rise. Conversely, credits with abundant supply and limited demand may trade at lower prices.

Demand is also becoming more selective. Rather than simply looking for the cheapest available credit, some companies are seeking higher-quality credits and durable carbon removals.

This is contributing to a more differentiated market in which credits with different characteristics can command very different prices.

Are VCM Prices Higher or Lower Than Compliance Carbon Prices?

Voluntary carbon credit prices should not be directly compared with compliance market prices because the two markets use different instruments and operate under different rules.

The VCM is largely driven by voluntary corporate and institutional demand. Compliance markets, such as emissions trading systems (ETSs), create demand through legal emissions obligations.

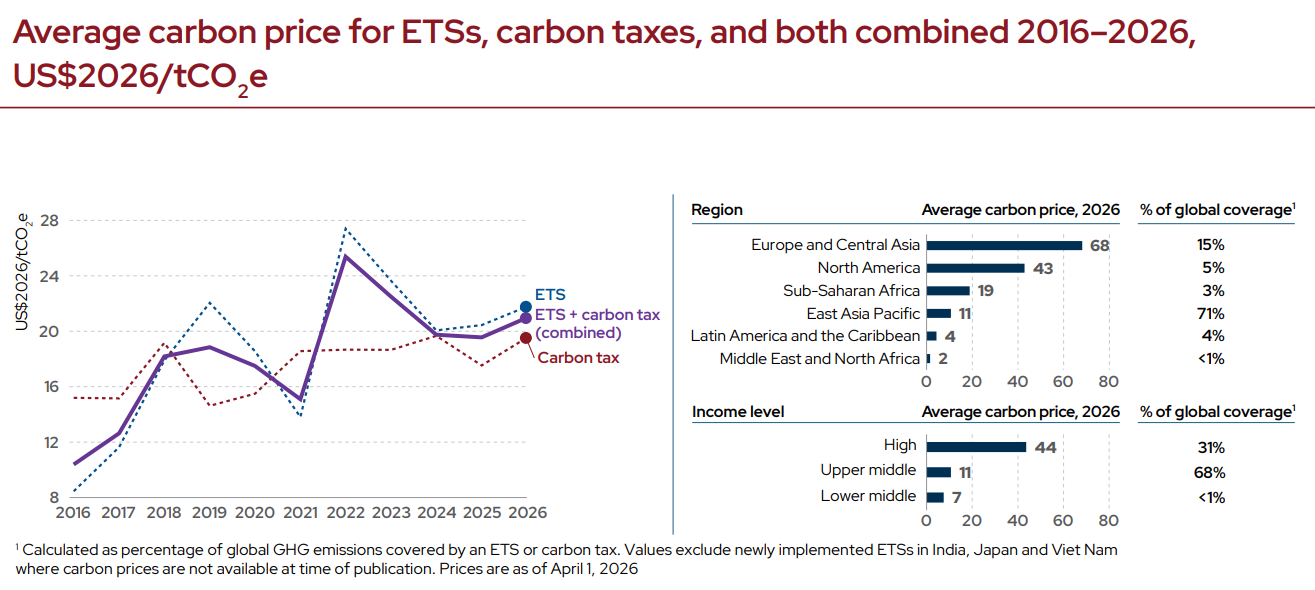
The World Bank reported an average direct carbon price of nearly $21/tCO₂e in 2026 across implemented carbon taxes and ETSs. But individual compliance markets can be significantly higher or lower than this average.

carbon price average ets carbon tax World Bank 2026
Source: World Bank

This means it is incorrect to say that compliance carbon is always more expensive than voluntary carbon, or vice versa.

Does a Higher Price Mean a Better Carbon Credit?

Not necessarily.

Price can provide a useful signal, but it should not be the only factor buyers consider. A more expensive credit may represent a high-quality removal project, but buyers still need to examine the evidence behind its claimed climate benefit.

Before purchasing a credit, buyers should consider:

  • Additionality: Would the emissions reduction or removal have happened without carbon-credit revenue?
  • Permanence: How long will the carbon remain stored?
  • Measurement: How accurately are emissions reductions or removals quantified?
  • Verification: Has an independent body assessed the project’s reported results?
  • Leakage: Could emissions simply shift elsewhere because of the project?
  • Double counting: Is the same emissions reduction or removal being claimed more than once?

These factors help buyers understand what they are actually purchasing rather than relying on price alone.

The Bottom Line

Carbon credit prices vary because carbon credits are not all the same. Project type, quality, location, vintage, supply and demand, and the durability of carbon removal can all affect value.

In 2025, the average price across the MSCI Global Carbon Credit Price Index was $3.50/tCO₂e, but higher-quality credits averaged $6.80, while some engineered carbon removal credits cost more than $1,000/tCO₂e.

As the carbon market develops, buyers are increasingly looking beyond the cheapest available credits. Quality, transparency, and the strength of the underlying climate benefit are becoming increasingly important factors in determining what a carbon credit is worth.

The post Carbon Credit Prices Explained: What Determines the Value of a Carbon Credit? appeared first on Carbon Credits.
Lithium Prices Up 92% Year Over Year as PLS Group Posts A$526M Profit

Lithium Prices Surge 92% as PLS Group (Pilbara Minerals) Hits Record Q2 2026 Results and Bets on a Tighter Market

Lithium’s recovery is giving Australia’s largest independent lithium producer a reason to become more aggressive about growth. PLS Group, formerly Pilbara Minerals, expects the lithium market to tighten in the coming years and is preparing to expand its flagship Pilgangoora operation in Western Australia.

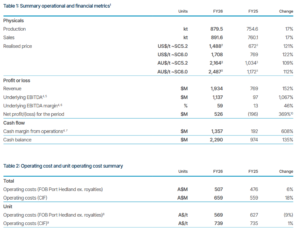
The company also returned cash to shareholders for the first time since 2023 after higher lithium prices helped drive a sharp recovery in FY2026 earnings. PLS reported an A$526 million net profit for the year ended June 30, compared with an A$196 million net loss a year earlier.

Revenue reached A$1.934 billion, while underlying EBITDA, a measure of operating earnings, climbed to A$1.137 billion.

The stronger results reflect both higher lithium prices and record production. They also show how quickly lithium miners can recover when prices turn after a prolonged downturn.

Lithium Price Rebound Puts PLS Back on the Front Foot

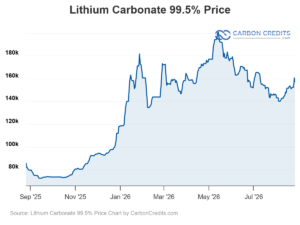
Lithium prices have staged a major recovery in 2026 after several years of weak conditions. It reached about CNY 157,000 per tonne on August 26, down 2.18% from the previous day but still 92% higher than a year earlier. The price had also gained about 7.2% over the previous month.

Lithium Carbonate 99.5% Price - CarbonCredits (7)

The recovery has changed the outlook for producers such as PLS.

The company’s FY2026 results clearly show the effect. PLS increased spodumene production by 17% to 879,500 tonnes and sales by 17% to 891,600 tonnes. Higher realized prices and tighter cost control helped push revenue to almost A$1.93 billion.

The company also ended FY2026 with A$2.29 billion in cash, giving it more room to invest in new capacity.

PLS financial results June 2026
Source: PLS Group

PLS Sees a Stronger Lithium Cycle Ahead

PLS CEO Dale Henderson has taken a bullish view of the market. He said the company believes lithium has entered a new part of its cycle, supported by strong demand and limited supply growth. He specifically noted:

“Lithium is a volatile market, and our strategy is designed to use that cycle to our advantage rather than as a limitation.”

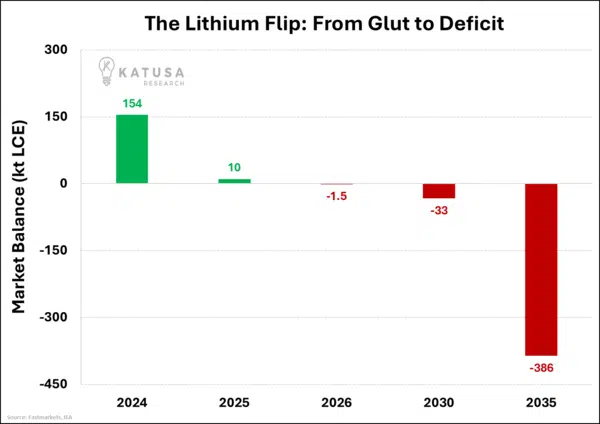
PLS expects a supply shortfall to develop in the coming years, according to Bloomberg’s report on the company’s results. That view contrasts with the oversupply that weighed on lithium prices through much of 2024 and 2025.

The recent improvement has come as battery demand strengthens, while some producers remain cautious about bringing capacity back online after the price downturn.

PLS has already responded by restarting idled capacity and moving growth projects forward. The company said it entered FY2027 “larger, lower-cost, and financially stronger” than a year earlier.

Still, lithium remains a highly cyclical commodity. A new wave of supply could again pressure prices if production grows faster than battery demand. 

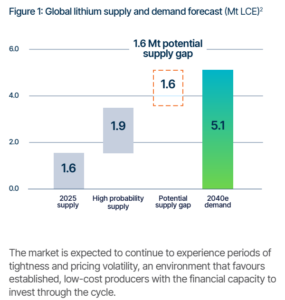
The Australian miner estimates that there would be around 1.6 Mt potential supply gap to meet the 2040 demand, growing from 1.5 million tonnes of lithium in 2025 to 5.1 million tonnes by 2040.

PLS global lithium demand and supply market outlook
Source: PLS Group

PLS Plans to Double Pilgangoora Capacity

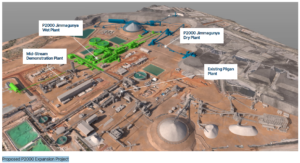
The biggest growth opportunity is P2000, a proposed expansion of the Pilgangoora operation. PLS is studying a brownfield expansion that could lift spodumene concentrate capacity to about 2 million tonnes per year. The company expects to complete its feasibility study in the December quarter of 2026.

PLS has already approved about A$175 million in pre-final investment decision spending to keep the project moving. The spending covers engineering, long-lead equipment, early site work, and infrastructure.

A final investment decision could follow the feasibility study, subject to the results, funding capacity, and market conditions. If approved, P2000 could produce its first ore in mid-2029.

The lithium miner estimates the project may need over A$1.2 billion in investment. It could create more than 1,000 construction jobs and support around 500 ongoing operational roles. The expansion would give PLS substantially more exposure to a stronger lithium market.

Pilbara Proposed P2000 Expansion Project
Source: PLS Group

The Company Is Bringing Capacity Back Online

PLS is not relying only on P2000. During FY2026, the company restarted the Ngungaju processing plant, which had been placed on care and maintenance during the lithium downturn. It is also progressing the Colina lithium project in Brazil and other growth initiatives.

This marks a clear change from the defensive strategy PLS used when lithium prices were weak.

During the downturn, producers focused on reducing costs, preserving cash, and cutting production where needed. As prices recovered, PLS began bringing capacity back and preparing for longer-term growth.

The company’s financial position now gives it more flexibility to do so. Its FY2026 cash balance reached A$2.29 billion, while it also completed its first US$600 million bond offering during the year.

That combination of stronger prices, higher production, and a larger cash position puts PLS in a stronger position to fund expansion.

First Dividend Since 2023

The lithium recovery is also flowing back to shareholders. PLS declared a fully franked final dividend of 5 Australian cents per share, representing a distribution of about A$161 million. It is the company’s first dividend since 2023.

The full-year dividend suggests the board now has greater confidence in cash generation. However, PLS still needs to balance shareholder returns against the large capital requirements of P2,000 and its other growth projects.

EVs, Batteries and the Next Wave of Lithium Demand

The long-term case for lithium rests heavily on demand from electric vehicles and energy storage. PLS has also pointed to growing demand from stationary batteries and emerging electric mobility markets, including electric trucks.

In April, CEO Henderson said customer discussions in China showed a broader recovery in lithium demand.

Energy storage is becoming particularly important. As grids add more solar and wind power, batteries can store electricity and supply it when renewable generation falls. That creates another source of lithium demand beyond electric cars.

The market, however, remains exposed to changes in battery chemistry, technology, and regional EV demand.

China’s growing use of sodium-ion batteries also creates a longer-term competitive risk for lithium in some applications, particularly lower-cost energy storage.

The Supply Crunch That Could Keep Lithium Prices Rising

PLS’s bullish outlook depends on supply failing to keep pace with demand. That is possible, but it is not guaranteed.

The lithium market has shown how quickly new supply can change prices. When prices surged in 2022 and 2023, producers and developers rushed to expand. The resulting supply growth helped push prices sharply lower.

Now, years of weak prices have forced some projects to slow, suspend, or delay development. That creates the potential for a tighter market if demand rises faster than producers can respond.

lithium supply deficit KR

PLS is positioning itself for that possibility. Its P2000 project could eventually double Pilgangoora’s capacity to about 2 million tonnes a year, but the company will make the final investment decision only after completing its feasibility work.

This gives PLS some flexibility if market conditions weaken again.

PLS Shares Ride the New Lithium Bull Case

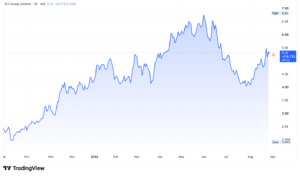
Investors have also responded to the stronger lithium outlook. PLS shares rose as much as 8.1% in Sydney on August 24 after the company released its FY2026 results, reversing an early decline.

The move reflects renewed confidence in lithium prices, PLS’s stronger earnings and its expansion plans. The stock’s performance also shows how closely PLS remains tied to the lithium cycle.

PLS stock price

Stronger prices can quickly lift revenue and margins, while another supply-driven downturn could have the opposite effect.

The Hard Part: Can Lithium Stay Tight?

PLS’s FY2026 results show how much the lithium market has changed in a year. Production reached a record 879,500 tonnes, revenue climbed to A$1.934 billion, net profit reached A$526 million, and the company restored its dividend.

At the same time, PLS is preparing for a potential supply shortage and considering a major expansion that could take Pilgangoora to about 2 million tonnes of annual capacity.

The key question now is whether lithium demand can stay ahead of new supply.

If it does, PLS could enter a stronger growth phase with the balance sheet and production base to benefit. If new supply returns faster than expected, the company could again face the price pressure that defined the previous downturn.

For the broader lithium market, PLS’s decision to expand is itself a sign of how quickly sentiment has shifted from oversupply and cost-cutting toward tighter supply and renewed investment.

The post Lithium Prices Up 92% Year Over Year as PLS Group Posts A$526M Profit appeared first on Carbon Credits.
US Biofuel Credit Market Faces Major Shake-Up From EPA Exemptions

us biofuel

Reuters reported that prices for U.S. ethanol blending credits plunged on Monday after the Environmental Protection Agency (EPA) extended a key compliance deadline and said it would rule on long-pending small refinery exemption requests by the end of August.

The move sent a shock through the U.S. biofuel credit market. Conventional ethanol Renewable Identification Numbers (D6 RINs) fell to $1.75 each, down 34 cents from Friday and their lowest level since April 15, according to Argus Media. The credits had traded as high as $2.50 on July 7.

Prices for 2026 biomass-based diesel RINs also weakened. They were last assessed at around $1.92 each, their lowest level since late April.

The sharp decline shows how closely the U.S. biofuel market depends on federal blending rules and the supply of compliance credits.
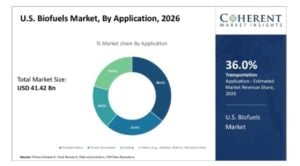
us biofuel market

What Are RINs and Why Do They Matter?

Renewable Identification Numbers, or RINs, are tradable credits created under the U.S. Renewable Fuel Standard (RFS).

The RFS requires obligated fuel companies, mainly refiners and importers, to demonstrate that they have met federal renewable fuel blending requirements. Companies can generate RINs by blending eligible biofuels into the fuel supply or buy credits from other market participants.

RINs therefore create a financial value around renewable fuel use.

When refiners need more credits than they can generate through their own blending activities, they must buy RINs. Higher compliance obligations or tighter credit supplies can push prices higher.

The opposite can also happen.

If the EPA grants exemptions that reduce the number of RINs refiners need, the market can suddenly have more credits available. That is what traders are now anticipating.

US Biofuel Market Remains Large

The United States is the world’s largest producer and consumer of fuel ethanol and one of the biggest markets for biodiesel and renewable diesel.

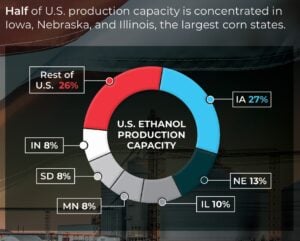
us ethanol
Source: ethanolrfa.org

Corn-based ethanol dominates the U.S. biofuel market. Most gasoline sold in the country contains some ethanol, with E10, a blend containing about 10% ethanol, forming the backbone of the market.

Higher ethanol blends such as E15 and E85 also contribute to demand, although their use remains much smaller.

The U.S. ethanol industry produces billions of gallons of fuel each year. That creates a large and established market for corn, ethanol production, transportation, blending and RIN generation.

The diesel side of the market has also expanded. Biodiesel and renewable diesel provide another major source of renewable fuel and compliance credits.
Renewable diesel is particularly important because it can be used in existing diesel infrastructure and is increasingly produced from feedstocks such as vegetable oils, animal fats and used cooking oil.

Demand for Biofuel Credits Is Driven by Federal Rules

The biggest source of demand for RINs is not simply fuel consumption. It is the federal compliance system.

Each year, the EPA establishes Renewable Volume Obligations (RVOs) that determine how much renewable fuel the market must account for.

Refiners and fuel importers receive obligations based on their share of the U.S. transportation fuel market. They then need enough RINs to demonstrate compliance.

That makes RIN demand closely tied to EPA policy.

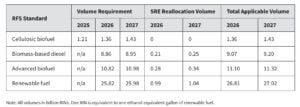
The EPA recently finalized record-high renewable fuel blending requirements for 2026 and 2027. Those requirements have increased compliance pressure on refiners and helped support RIN prices.

But the market is now facing a potential reversal.

biofuel renewable fuel EPA
Source: EPA

EPA Exemptions Could Add Billions of Credits

The EPA is reviewing 34 small refinery exemption petitions, with some dating back to July 2024.

Small refinery exemptions allow qualifying facilities to receive relief from their renewable fuel obligations when they can demonstrate that compliance would impose disproportionate economic hardship.

The market expects the EPA’s decisions to free up a significant number of RINs.

Representatives from the refining and ethanol industries, along with an analyst, estimate that the exemptions could free between 1.2 billion and 1.8 billion RINs for small refiners to use toward their 2025 compliance obligations.

The EPA had previously indicated that it could reallocate about 990 million RINs associated with exemptions. This potential supply is large enough to materially change the balance between RIN supply and demand.

Why RIN Prices Fell So Quickly

The selloff is largely about expectations.

Jessica Dell, head of U.S. biofuel pricing at Argus Media, said RIN prices lost substantial value during Monday’s session as the market reacted to the pending exemption decisions.

RIN prices had already fallen 5% on Friday. The EPA’s decision to extend the September 1 compliance deadline has added another layer of uncertainty.

Under the RFS, refiners must show that they met their 2025 biofuel blending obligations by September 1. They can do this by generating RINs through renewable fuel blending or purchasing credits from other market participants.

Giving refiners more time to comply could reduce immediate buying pressure.

More importantly, the deadline extension has been interpreted by some market participants as a possible signal that refiners could receive broader relief from their 2026 and 2027 obligations.
Agricultural economist Scott Irwin of the University of Illinois described the move as potentially signaling some form of “RIN relief” for future obligations.
Ethanol Producers Face a Different Equation

Lower RIN prices are not necessarily positive for the ethanol industry. Ethanol producers can generate RINs when they blend their fuel into the transportation system. Those credits provide an additional source of revenue.

When RIN prices fall, the value of that revenue stream also declines.

That can put pressure on producer margins, particularly when corn prices, energy costs, transportation expenses or other operating costs are high. Furthermore, the impact can vary across producers because ethanol economics depend on several factors, including corn prices, ethanol selling prices, distillers grains revenue and energy costs.

Still, the RIN market remains an important part of the broader economics of U.S. ethanol production.

Supply Could Become the Market’s Biggest Concern

The immediate question is how many credits will become available if the EPA grants the pending exemptions.

  • A release of 1.2 billion to 1.8 billion RINs would represent a significant addition to the pool of credits available for compliance. This could create a supply overhang and keep prices under pressure.

It could also reduce the incentive for some refiners to purchase additional credits in the spot market.

For the ethanol industry, this creates a difficult environment. Demand for renewable fuel may remain strong, but the value of the compliance credits attached to that fuel can fall when regulatory relief increases RIN availability.

What Happens Next?

The EPA’s decisions on the 34 exemption petitions will be the next major catalyst for the market. If the agency grants a large number of exemptions, RIN prices could face additional pressure as more credits become available or obligations are reduced.

On the other hand, if fewer exemptions are granted, the market could tighten again, particularly given the record renewable fuel requirements for 2026 and 2027.

The outcome will also influence the economics of U.S. refiners and biofuel producers.

For refiners, lower RIN prices can reduce the cost of meeting federal obligations. For ethanol and renewable diesel producers, however, weaker credit prices can reduce the value of an important revenue stream.

The episode highlights a central feature of the U.S. biofuel market: fuel demand, government mandates and carbon-related compliance markets are closely connected.

The U.S. can continue consuming large volumes of ethanol, biodiesel and renewable diesel while RIN prices fall sharply if regulatory changes increase credit supply.

For carbon and clean energy investors, the RIN market is therefore worth watching alongside traditional biofuel production data. Changes in EPA policy can quickly reshape the economics of renewable fuels, alter demand for compliance credits and influence investment decisions across the U.S. bioenergy sector.

The post US Biofuel Credit Market Faces Major Shake-Up From EPA Exemptions appeared first on Carbon Credits.