Base Carbon: A Rising Force in the Voluntary Carbon Market

Base Carbon: A Rising Force in the Voluntary Carbon Market

Base Carbon Inc. (NEO: BCBN) has rapidly become a significant player in the voluntary carbon market (VCM). The company is showing strong financial performance, strategic growth initiatives, and a growing portfolio of carbon offset projects that contribute meaningfully to global sustainability efforts.

Through a combination of innovative projects, careful asset management, and strategic partnerships, Base Carbon is positioning itself as a leader in an increasingly critical industry. Let’s uncover how the company is becoming a strong force in the VCM.

Financial Performance and Strategic Moves

In the first quarter of 2025, Base Carbon reported an income of almost $518,000. This is a huge turnaround from a loss of $19.8 million during the same time last year. This improvement came mainly from net cash of $789,621, which was earned by selling carbon credits from the Vietnam water purifier project.

The ability to convert carbon credits into a reliable cash flow is a key indicator of Base Carbon’s maturity and market relevance.

Additionally, the company has a strong balance sheet. Total assets are $112.3 million, which includes $13.4 million in cash reserves and $25.6 million in carbon credits. This large inventory shows the company’s commitment to generating carbon credits.

To boost shareholder value, Base Carbon bought back over 0.7 million shares in Q1 2025. After the quarter, it repurchased another 3.75 million shares. These buybacks show confidence in Base Carbon’s value and future. Plus, it also helps boost earnings per share over time.

Backed by Belief: Why Insiders and Investors Are All In

Abaxx Technologies Inc., a key stakeholder in Base Carbon, showed strong support by buying 3.7 million common shares in a private deal in May 2025. Abaxx’s increased investment shows its confidence in Base Carbon’s strategy and growth.

Moreover, insiders, like company management and related entities, hold a big part of the company’s shares. This close tie between leaders and shareholders shows that Base Carbon’s executives care about the company’s success. In turn, this builds trust with outside investors.

The company has strategic partnerships with tech providers and local stakeholders. These partnerships help deploy and verify carbon offset projects. These partnerships are key to building trust and growing Base Carbon’s efforts in the voluntary carbon market.

Project Portfolio: Diverse Initiatives Driving Carbon Credit Generation 

Base Carbon has a growing portfolio, featuring projects that create high-quality carbon credits. These projects tackle important environmental challenges in various regions.

Base Carbon carbon credit investments
Source: Base Carbon financial report
  • Vietnam Water Purifier Project: This project deploys affordable water purification systems in rural Vietnam, reducing the need to boil water with firewood or charcoal. Cutting household CO₂ emissions generated about $35.2 million in cash payments. This fully paid back the investment and created a profit of $14.4 million.

Base Carbon vietnam project
Note: Vietnam carbon credit project
  • Rwanda Cookstoves Project: Aimed at reducing emissions and improving indoor air quality, this initiative distributes efficient cookstoves that require less fuel. It tackles deforestation and health issues. It also generates carbon credits and helps Base Carbon’s social impact goals.

  • India ARR (Afforestation, Reforestation, and Revegetation) Project: This forest restoration project helps absorb atmospheric CO₂ through large-scale tree planting in degraded regions. It helps biodiversity, protects watersheds, and plans to issue its first carbon credits by late 2025.

Base Carbon’s Role in the Voluntary Carbon Market

The voluntary carbon market allows companies, governments, and individuals to purchase carbon credits voluntarily to offset their greenhouse gas emissions. The VCM works through voluntary participation, unlike compliance markets that are regulated by law. This enables various actors to invest in carbon reduction projects around the globe.

base carbon revenue model
Source: Base Carbon

Base Carbon’s role in this market is multifaceted:

Project Developer:

Base Carbon initiates and manages carbon offset projects. This produces verified carbon credits that meet strict international standards. These include the Verified Carbon Standard (VCS) and the Gold Standard. These certifications ensure the environmental integrity and additionality of the credits.

Carbon Credit Monetizer:

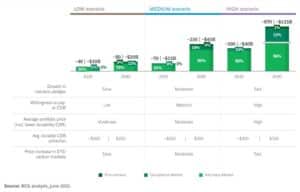
Base Carbon makes money by selling carbon credits. This is shown by its recent success with credits from the Vietnam project. This ability to turn carbon assets into cash boosts the company’s finances while also providing funds for future projects. The chart below shows the volume of traded carbon credits in the VCM in 2024.

carbon credit trading volume 2024
Source: Data from Ecosystem Marketplace SOVCM 2025 Report

Market Participant and Innovator:

The company trades carbon credits and looks for new market ways to boost liquidity and help with price discovery in the VCM. Base Carbon is also involved in new projects like blockchain carbon registries. These digital marketplaces boost transparency and lower transaction costs.

The company’s stock price has risen sharply lately. CEO Michael Costa credits this to strong execution and a disciplined approach to creating value.

Base Carbon stock
Source: Yahoo Finance

In a recent call, Costa said the stock has “almost nearly doubled” in a short time. This shows the market is starting to see the company’s intrinsic value. He stressed that this momentum isn’t just from market speculation. It’s a response to Base Carbon’s steady delivery on its promises. He noted that:

“We’ve executed, we’ve delivered our three projects on time and on budget…We’re focused on generating dollars and significant value creation…We are a public equity cost-to-capital business, and we always think about it that way…”

Looking ahead, Costa is optimistic about the VCM over the next two to three years. He highlighted a shrinking supply of high-quality credits, especially in afforestation and reforestation (A/R) projects. He said, “High-quality A/R is just starting to gain recognition in the market.

Base Carbon’s early-mover advantage is evident: the company has secured the first Article 6 Letter of Authorization on the Verra registry and maintains a diversified project portfolio across multiple regions.

Costa highlighted the company’s “pre-compliance” credits. These credits are ready for the changing rules and rising demand for carbon credits worldwide. He also mentioned the company’s right to expand the India project, which could add up to 10 million trees. It shows how Base Carbon can grow as the market expands.

Sustainability Initiatives and Future Growth Prospects

Beyond its core project, Base Carbon also invests in sustainability projects. These efforts strengthen its role as a responsible environmental steward.

  • Community Engagement. Base Carbon focuses on partnering with local communities. This way, projects can provide social and environmental benefits. This includes training and education programs, health improvements, and economic opportunities linked to project activities.

  • Technology Integration. The company uses technology to improve monitoring, reporting, and verification (MRV) of carbon offsets. Tools such as satellite images, IoT sensors, and blockchain improve the accuracy and trust of carbon credit data.

  • Expansion Pipeline. Base Carbon is looking at new projects in areas with high emissions reduction potential. This includes Latin America and Southeast Asia. Expanding its geographic reach will diversify carbon credit sources. This helps reduce risks linked to project concentration.

  • Carbon Market Advocacy. The company joins industry forums and works with policymakers. They aim to promote strong standards and transparency in the VCM.

Why Base Carbon May Be the Next Big Carbon Market Leader

Base Carbon’s recent financial turnaround and share buybacks show it’s on the rise in the voluntary carbon market. Insider investments also support this upward trend. Its expanding and diversified project portfolio — spanning Asia and Africa — generates tangible environmental benefits while delivering economic value for investors.

The carbon offset company stands out for its strong partnerships and innovative ways to monetize carbon credits. It also shows a clear commitment to sustainability. As the voluntary carbon market grows in importance amid global climate goals, Base Carbon’s proactive strategies and solid foundations position it well for sustained growth and leadership in the carbon offset space.

The post Base Carbon: A Rising Force in the Voluntary Carbon Market appeared first on Carbon Credits.

Can Fast Fashion Go Green? SHEIN’s Net-Zero Ambitions Under Scrutiny

Can Fast Fashion Go Green? SHEIN’s Net-Zero Ambitions Under Scrutiny

SHEIN has become one of the biggest names in fast fashion, selling affordable clothes online to customers around the world. The company had revenues of around US$30–32 billion in 2023 and offered nearly 600,000 items for sale at any given time. However, SHEIN is also facing criticisms over its rising carbon footprint and net-zero initiatives. 

The Fast Fashion Industry’s Environmental and Carbon Footprint

The fast fashion industry is one of the most carbon-intensive sectors in the world. According to the United Nations Environment Programme, the global fashion industry accounts for up to 10% of annual carbon emissions—more than all international flights and maritime shipping combined.

The sector also uses large amounts of water, energy, and raw materials, while producing significant textile waste. Fast fashion brands like SHEIN depend on quick production, low-cost materials, and worldwide distribution. This approach raises their environmental impact.

Most fast fashion emissions still come from the upstream supply chain. This includes raw material extraction, dyeing, sewing, packaging, and shipping. Even with more consumers aware, the impact remains high. Many garments are worn only a few times before being discarded, contributing to landfill waste.

fast fashion environmental impact
Source: Green Match

Sustainability initiatives, like using recycled fabrics or reducing transport emissions, are steps forward. However, experts argue that true impact requires slowing down production and rethinking the fast fashion model altogether. So, how does Shein perform on this ground?

SHEIN’s business model uses artificial intelligence (AI) to spot fashion trends and produce clothes quickly in small batches. Items are then shipped directly to consumers, often by air. This model helps reduce the amount of unsold inventory, giving the company huge revenues. However, this approach also adds significantly to the company’s carbon footprint.

leading fast fashion brands by revenue 2024
Source: Green Match

SHEIN’s 2023 Sustainability Report shows that total greenhouse gas emissions increased. They rose from 9.17 million metric tons of carbon dioxide equivalent (Mt CO₂e) in 2022 to 16.68 Mt CO₂e in 2023. That’s an 81% increase in just one year.

Shein GHG carbon emissions 2023
Source: Shein 2023 Sustainability Report

To put that into perspective, this is more than the annual emissions from 4 average coal-fired power plants. Most emissions come from the company’s supply chain and transportation. These areas are hard to control, but they cause most of its environmental impact.

Where SHEIN’s Carbon Emissions Come From

Greenhouse gas emissions are categorized into three groups or “scopes.” Scope 1 refers to emissions from a company’s direct operations, like its offices and warehouses. Scope 2 covers indirect emissions from the energy it purchases, like electricity. Together, these made up less than 1% of SHEIN’s total emissions in 2023.

The company reports that 72% of the electricity used at its facilities came from renewable sources last year, an increase from 68% in 2022. However, the bulk of SHEIN’s emissions—over 99%—fall under Scope 3. These emissions happen indirectly in the company’s value chain. They occur during manufacturing, shipping, and packaging.

Shein upstream shipping
Source: Stand.earth

In 2023, 61% of emissions came from supply-chain operations, while 38% were linked to transportation. To reduce these, SHEIN has begun sourcing more products from regions closer to its customers, like Brazil and Turkey. This “nearshoring” helped the company save over 314,000 tons of CO₂e by avoiding long-distance shipping routes.

Net-Zero Goals and Emissions Strategy

In response to growing environmental concerns, SHEIN has made several public commitments to reduce its carbon footprint. The company plans to reduce its Scope 1, 2, and 3 emissions by 25% by 2030, using 2023 levels as a starting point. It also aims to use only renewable electricity in its direct operations by the same year.

Longer-term, SHEIN has committed to achieving net-zero emissions across its value chain by 2050. These goals have been submitted to the Science-Based Targets initiative (SBTi) and were recently approved.

  • The path to net zero includes a 42% reduction in Scope 1 and 2 emissions and a 25% reduction in Scope 3 emissions by 2030.
Shein emission reduction targets
Source: SHEIN

The company aims to reach its climate goals by:

  • Expanding renewable energy use
  • Improving energy efficiency at supplier sites
  • Reducing transportation emissions

In addition, SHEIN is preparing to rely less on air freight and more on rail and sea, which are less carbon-intensive. While these steps show progress, they will need to be scaled up to significantly lower the company’s total emissions in the coming years.

Supply‑Chain Initiatives and Efficiency Improvements

SHEIN has launched several projects aimed at cutting emissions across its supply chain:

  • Energy audits and efficiency upgrades at 28 supplier sites—cutting about 46,000 t CO₂e/year.
  • Encouraging rooftop solar at 31 factories, with 10 in progress—cutting around 12,140 t CO₂e.
  • Nearshoring to Turkey and Brazil reduced emissions by 314,805 t CO₂e, and cutting air transport saved another 49,578 t CO₂e.
  • Logistics partnerships using electric or hybrid vehicles, saving about 54,614 t CO₂e.

These actions are aimed at tackling Scope 3 emissions, which are harder to manage but represent the majority of SHEIN’s carbon output. By supporting its suppliers and improving logistics, the company is starting to take responsibility for its broader environmental impact. 

Criticism and Greenwashing Concerns

Despite its climate pledges, SHEIN has faced strong criticism from environmental groups and industry observers. The company has a key issue: its emissions are increasing more quickly than revenue. This shows that its business model doesn’t match its climate goals.

Critics also argue that SHEIN’s reliance on Scope 3 reductions, which are outside of its direct control, makes its net-zero targets difficult to achieve in practice.

There are also concerns about labor practices and the credibility of some of its sustainability claims. In 2024, SHEIN disclosed child labor violations found during supplier audits. Labor watchdogs still report bad working conditions and very long hours at some factories.

In Italy, regulators are looking into the company for possible greenwashing. This means they may have misled consumers about their environmental achievements. SHEIN got a low score of 2.5 out of 100 in a recent ranking by Stand.earth. The report noted that the company’s emissions increased by almost 50% in just one year.

Shein environmental ranking
Source: Stand.earth

These issues show that while SHEIN is making some progress, it still has a long way to go in proving that its climate promises are genuine and effective.

Can SHEIN Match Its Speed With Sustainability?

SHEIN’s efforts to reduce emissions and improve sustainability are a step in the right direction. The company is starting to work with suppliers, cut transportation emissions, and invest in cleaner energy. Getting its net-zero targets approved by SBTi adds credibility to its climate strategy.

However, the real test will be whether SHEIN can turn its goals into measurable reductions. Emissions continue to rise, which means the company must scale up its efforts quickly to stay on track. Expanding renewable energy, improving factory efficiency, and reducing overproduction will be key. 

Fast fashion, by nature, is resource-intensive. For SHEIN to become a leader in sustainability, it must go beyond statements and show that net-zero efforts can match the speed and scale of its business.

The post Can Fast Fashion Go Green? SHEIN’s Net-Zero Ambitions Under Scrutiny appeared first on Carbon Credits.

Harvard Says U.S. CBAM Could Deliver $200 Billion—and a Cleaner Future

us

The U.S. is moving closer to adopting a Carbon Border Adjustment Mechanism (CBAM)—a policy that could both strengthen domestic industry and reduce global pollution. CBAMs work by placing a fee on imported goods based on the carbon emissions released during their production. The goal is to create fair competition for U.S. manufacturers and stop companies from moving to countries with weaker climate rules.

Carbon Border Adjustment: A New Tool to Boost Industry and Cut Emissions

Unlike a traditional carbon tax, a CBAM is applied at the border. Specifically, it targets carbon-intensive imports such as aluminum, steel, cement, paper, and fertilizers.

  • According to Harvard Belfer Center’s new study titled “The Revenue Potential and Country Exposure of a U.S. Border Carbon Adjustment”, pairing this mechanism with a domestic carbon price could unlock up to $200 billion in revenue over five years.

However, this upper limit assumes no retaliation or trade adjustment from other countries—something experts say is unlikely. Still, even under conservative models, the numbers are promising.

Bipartisan Momentum Grows for U.S. CBAM

In recent months, interest in a U.S. CBAM has grown fast, especially after the European Union launched its own version in October 2023. The EU CBAM has already pushed countries like Brazil, Türkiye, and Indonesia to consider their carbon pricing policies, hoping to avoid losing export revenue to border fees. Now, the U.S. sees a chance to catch up—and capitalize.

Currently, several CBAM-related bills are circulating in Congress:

  • The Clean Competition Act (CCA), backed by Democrats

  • The Foreign Pollution Fee Act (FPFA), introduced by Republicans

  • The Market Choice Act (MCA), which combines carbon pricing with border adjustments

According to a new study from Harvard’s Belfer Center, the FPFA could raise as much as $198.1 billion over five years. Meanwhile, the CCA has a lower estimated revenue potential—between $3.2 billion and $85.5 billion—depending on its scope and the carbon price applied.

US cbam emissions
Source: Harvard Report: The Revenue Potential and Country Exposure of a U.S. Border Carbon Adjustment

Importantly, these projections do not yet account for changes in trade behavior, which could lower actual collections. Nonetheless, the outlook remains strong. In fact, support for CBAMs is bipartisan and widespread. Polls show that once voters understand the concept, around 75% support the policy, including in states reliant on heavy industry and fossil fuels.

Why a Carbon Border Fee Makes Economic Sense

The U.S. industrial sector contributes about a quarter of global CO₂ emissions. However, U.S. goods are on average 40% more carbon-efficient than those made elsewhere. This gives the U.S. a clear advantage in a world where emissions carry a cost.

For instance:

  • U.S. paper products are less carbon-intensive than 86% of imports

  • U.S. fertilizers are 79% cleaner

  • Aluminum: 80% cleaner than imports

  • Cement: 72% cleaner

  • Glass: 66% cleaner

  • Iron and steel: 60% cleaner

U.S. Carbon Intensity Relative to U.S. Imports

US carbon intensity CBAM
Source: Harvard Report, The Revenue Potential and Country Exposure of a U.S. Border Carbon Adjustment

Because of this advantage, a well-designed CBAM could boost U.S. competitiveness. By placing a fee on dirtier imports, the policy would create a fairer market and drive global demand for cleaner American goods. Analysts argue it could also reduce the U.S. trade deficit and promote clean manufacturing simultaneously.

In addition, a CBAM would prevent companies from offshoring production to nations with weaker environmental rules. This would curb the problem of carbon leakage.

Crucially, by targeting polluting imports from countries like China and Russia, the CBAM would reduce their unfair edge and encourage cleaner production globally.

Winners, Losers, and Global Trade Impact

The Belfer Center study also identifies the countries most exposed to a U.S. CBAM. Mexico, China, Brazil, and India top the list, due to their high export volumes and greater emissions intensity.

Canada, on the other hand, currently escapes most of the impact thanks to its carbon price of around $59 per ton in 2024.

However, this could change. In March 2025, Canada announced plans to remove the requirement for provinces to maintain consumer-facing carbon pricing. If Canada drops its domestic carbon price altogether, it would no longer be exempt from U.S. CBAM charges. In such a case, Canada could owe up to $2.7 billion annually under a $55/ton CBAM scenario, making it the hardest-hit exporter, even ahead of Mexico.

To assess trade exposure, the study groups countries into five categories:

  1. Fossil Fuel Heavyweights – Exporters with over $100 million in CBAM dues, where fossil fuels dominate

  2. Other Major Exporters – Non-fossil fuel countries with $ 100 M+ in CBAM payments

  3. Moderate Exposure – Countries owing between $10M and $100M

  4. Low Exposure – Countries owing under $10M

  5. Unaffected – Countries with strong carbon pricing and zero CBAM dues

More Revenue with a U.S. Carbon Price

Furthermore, the analysis strongly supports pairing a CBAM with a domestic carbon price. This combination would increase revenue by taxing U.S. emissions and help preserve America’s carbon efficiency advantage.

With low capital costs and innovation capacity, the U.S. is well-positioned to lead in clean tech. Several states, such as California and Washington, already have carbon pricing programs. The Regional Greenhouse Gas Initiative (RGGI) in the Northeast also covers power-sector emissions.

However, no national system is yet in place. Past efforts like the 2009 cap-and-trade bill and the 2019 Energy Innovation and Carbon Dividend Act failed to pass. But with rising global momentum and pressure from EU policies, the timing may now be right.

What’s Next for U.S. Carbon Border Policy?

Designing a successful CBAM requires answers to critical policy questions:

  • What sectors will be covered?

  • What benchmarks define carbon intensity?

  • Should least-developed countries be exempt?

  • Will foreign carbon pricing be credited?

Both the FPFA and CCA offer proposals. The FPFA, led by Senators Bill Cassidy and Lindsey Graham, simplifies the system by assigning products into emissions-based tiers. It also focuses on countering “unfair practices” from non-market economies like China.

The CCA, by contrast, is more aligned with the EU model and uses direct carbon intensity benchmarks.

Despite their differences, both bills share a key feature: they could generate more tariff revenue than all current U.S. import duties combined.

The Path Forward: Climate, Trade, and Competitiveness

The Joint Economic Committee believes that the U.S. is at a pivotal moment. And, a properly executed CBAM would help the U.S. capitalize on its clean manufacturing edge by:

  • Making domestic industries more competitive

  • Driving global demand for low-emission U.S. products

  • Strengthening international climate protections

  • Reinforcing supply chains with like-minded allies

  • Creating worldwide incentives for cleaner production

If done right, this policy will reduce carbon emissions, future-proof American manufacturing, and position clean U.S. goods as the global standard.

The post Harvard Says U.S. CBAM Could Deliver $200 Billion—and a Cleaner Future appeared first on Carbon Credits.

Copper Demand Set to Hit 37M Tonnes by 2050—Can Supply Keep Up?

copper

IEA recently released its Global Critical Minerals Outlook 2025, where it revealed that refined copper demand rose 3.2% in 2024, up from 2.7% in 2023 and 1.1% in 2022.

Copper prices surged to nearly $10,800 per tonne early in 2024 before falling back. Price hikes came from supply disruptions like the Cobre Panama shutdown and lower output forecasts from Anglo American. Interestingly, rising demand from AI data centers is creating worries about future copper shortages. Experts are weighing in on the fact that copper supply won’t be able to keep up with the fast growth of digital infrastructure.

  • Global refined copper demand (excluding scrap) hit nearly 27 million tonnes in 2024 and is projected to grow to 33 million tonnes by 2035, reaching 37 million tonnes by 2050.

China accounted for almost 60% of demand in 2024, with the U.S. and Germany trailing behind. Early 2025 saw rising copper prices due to U.S. tariffs and a weaker dollar, but fears of a global slowdown and China’s retaliatory tariffs have weighed heavily on prices and demand outlooks.

Copper demand by region in the STEPS

copper demand
Source: IEA

More significantly, India, Saudi Arabia, and Malaysia, driven by fast infrastructure and construction projects, contributed to the copper demand spike. On the contrary, Europe faced its second straight year of copper demand decline amid high inflation and energy costs.

AI and Data Centers Drive Copper Demand Surge

Data centers are becoming a major force behind rising copper demand. In the U.S. alone, new data center capacity is expected to grow by 50 gigawatts (GW) between 2023 and 2028. That’s five times the 10 GW added during 2017-2022.

This rapid growth means a huge need for copper in power systems, cooling, and connectivity. This is because the metal conducts electricity and heat well, lasts long, and is affordable. Each gigawatt of capacity typically uses about 5,500 tonnes of copper.

Estimates of copper use in these centers vary widely by as much as 10X. IEA says copper use in data centers could be between 250,000 and 550,000 tonnes by 2030. That could equal 1 to 2% of global copper demand—and possibly more if AI growth accelerates.

AI data center copper

Copper Mine Supply to Peak Soon, Then Decline Sharply

Global mined copper supply reached 22 million tonnes in 2024. Chile leads production, followed by the Democratic Republic of Congo and Peru.

  • Supply is set to peak in the late 2020s at just over 24 million tonnes before dropping below 19 million tonnes by 2035 due to falling ore grades and mine closures.

The Democratic Republic of Congo (DRC) is expected to drive significant near-term growth. Major projects like Kamoa-Kakula and Tenke Fungurume could boost output from 900 kilotonnes (kt) in 2024 to over 1.3 million tonnes (Mt) by 2028.

IEA Copper

China’s Copper Smelting Boom Sparks Global Supply Crunch

In another report from Bloomberg, we discovered that China’s rapid growth in copper smelting is causing a global squeeze on copper concentrate supply. While China hits record refined output, smelters worldwide suffer losses as treatment charges drop below zero.

Major players like Chile’s Antofagasta are offering negative fees, forcing smelters to pay more for ore than they earn. Smaller smelters, especially outside China’s major buyer groups, face closures, while large, state-owned Chinese smelters stay afloat.

China copper
Source: Bloomberg

The report highlighted that excess smelting capacity is the real problem, not mining output. Spot treatment charges have plummeted to negative $60 per tonne, hitting smelters globally. Older European smelters are vulnerable, but Japanese smelters with mine ownership may survive longer. The fight to survive is intensifying as China expands its smelting dominance.

2035 Copper Deficit Forecast

Based on current and planned mining projects, the IEA forecasts that the world would face a 30% copper supply deficit by 2035 under the Stated Policies Scenario (STEPS). The gap widens to 35% under the Announced Pledges Scenario (APS), and over 40% in the Net Zero Emissions (NZE) Scenario.

Even in a high production outlook, supply falls short by 20%.

This shortfall begins in the late 2020s, mainly because copper ore grades are dropping. Since 1991, average ore grades have fallen by 40%. Advances like solvent extraction and electrowinning help process lower-grade ores but only partly make up for the decline.

How Will the Copper Industry Sustain Long-Term Demand Growth?

BHP predicts that recycled copper will be critical to meeting demand growth over the next 30 years. However, scrap availability limits recycled supply. The lifespan of copper in products varies widely, from months in consumer electronics to decades in construction, averaging about 20 years in use.

Copper
Source: BHP

Furthermore, copper reserves and production are concentrated in Latin America, Australia, and Africa. However, the challenge is: the industry must find ways to sustain volume growth amid resource depletion and rising costs.

Closing the Copper Supply Gap

This growing supply deficit highlights major risks to copper security. To meet demand, the industry must boost investment in new mines, improve material efficiency, find substitutes, and increase recycling efforts. Another concern is the lack of diverse copper refining options, which could threaten supply stability.

In short, tackling copper’s supply challenges will require a strong, multiple approach to avoid shortages as demand surges.

The post Copper Demand Set to Hit 37M Tonnes by 2050—Can Supply Keep Up? appeared first on Carbon Credits.

Robotaxis Are Here: Top 3 Companies That Are Driving the Future of Ride-Hailing

Robotaxis Are Here: Top 3 Companies That Are Driving the Future of Ride-Hailing

Driverless vehicles are now starting to reshape urban mobility. As robotaxi services expand across major cities, investors are turning their attention to the companies powering this transformation. From Waymo’s early lead to Pony.ai and WeRide’s rapid scaling in China, these top robotaxi stocks are steering the future of autonomous transportation—and offering big opportunities along the way.

Meet the Robotaxi: AI Behind the Wheel

Robotaxis are driverless ride‑hailing vehicles that operate using a combination of sensors (LiDAR, cameras, radar) and AI to navigate without human drivers. Most services today reach autonomy Level 4, meaning they can handle all driving tasks within defined conditions.

Since Waymo launched its fully driverless service in Phoenix in 2020, the story has changed. Robotaxis are now seen as real, scalable mobility solutions, not just experiments.

AI advancements have sped up training and improved on-road performance. Meanwhile, sensor and hardware costs keep dropping. This could bring per-vehicle costs below $50,000, according to Goldman Sachs estimates. 

As such, companies are moving from successful pilot tests toward strategies focused on sustainable operations. Strong partnerships with ride-hail apps like Uber and changing regulations are paving the way for regional growth. These forces are combining to bring robotaxis closer to commercial viability.

With their technology maturing and real-world use expanding, robotaxis are moving beyond early trials. But what exactly is fueling their momentum today?

Why Autonomous Cars Are Gaining Momentum

Robotaxis are advancing rapidly due to several industry shifts. Here are the four key factors driving self-driving vehicles from tests to real services. 

  • Technology and Cost Improvements

One of the most important drivers of progress in the robotaxi industry is the rapid improvement in technology. Advances in artificial intelligence, particularly in generative AI, have made it faster and more efficient to train autonomous driving systems.

robotaxi interior
Source: Shutterstock

Also, hardware parts like LiDAR sensors, cameras, and onboard processors are now cheaper. Lower costs let companies build and deploy more robotaxis. This reduces the price per vehicle and helps companies get closer to profitability.

  • Shift Toward Revenue-Generating Models

Robotaxi companies are also changing how they operate. Many, including Pony.ai and WeRide, are no longer just testing their technology—they are running real services that bring in money. These firms now offer commercial robotaxi rides, shuttle services, and even autonomous delivery in selected cities.

  • Strategic Partnerships Expanding Reach

Collaborations with major partners are helping robotaxi companies grow faster. For example, Uber has invested in and partnered with WeRide, allowing the company to expand its services into more Chinese cities.

Similarly, Tencent has teamed up with Pony.ai to help deploy its autonomous vehicles on a large scale. These partnerships help robotaxi companies reach more users and also improve infrastructure and boost brand recognition. This support allows them to scale operations more efficiently.

  • Regulatory Support and Urban Expansion

Governments are starting to support the development and expansion of robotaxi services. In the United States, Waymo now operates in six major metro areas, including Phoenix, San Francisco, and Los Angeles.

Chinese companies like Pony.ai and WeRide have also received government approval to run services in multiple cities. This rising regulatory support shows that the public sector trusts the technology more. It also opens new growth opportunities in both Western and Asian markets.

These combined forces—tech gains, business shifts, partnerships, and policy changes—are reshaping the market outlook for robotaxis.

The Roadmap: Where the Robotaxi Market Is Going

The robotaxi industry is changing; it’s moving from research to a real business. This shift brings long-term money-making chances. Companies are enhancing AI systems and cutting hardware costs, with major equipment manufacturers injecting funds into top robotaxi companies.

For instance, in early 2024, Hyundai teamed up with Waymo to supply vehicles outfitted with autonomous driving technology for Waymo’s robotaxi fleet.

capital injections to robotaxi companies
Source: CB Insights

Analysts now predict that several key players will become profitable by the decade’s end. These improvements let companies cut ride costs. They are slowly replacing human-driven ride-hailing services in some cities.

For example, WeRide is projected to reach profitability by 2027. Its growing presence in China and partnership with Uber boost its commercial potential. Also, its ability to earn money from various services, like freight and shuttles, adds to this strength.

This transition from pilot programs to profit-driven business models signals a turning point for the industry. What was once a futuristic concept is now entering mainstream transportation markets.

Robotaxi global Market 2030
Source: MarketsandMarkets

According to a report, the global robotaxi market could grow from $0.4 billion in 2023 to $45.7 billion by 2030, at a rate of almost 92%.

If trends keep going, robotaxis might soon be profitable on a large scale. This is key for drawing in long-term investors and speeding up global use.

Game Changer: What Robotaxis Mean for Uber and Lyft

Robotaxis will likely shake up the ride-hailing industry. They promise a cheaper and safer option than traditional driver-operated services. Some companies are adding robotaxis to their platforms.

Others, like Tesla, are entering this space on their own. Tesla plans to launch a small fleet of robotaxis in Austin using its Model Y vehicles. Over time, it aims to scale the service to over 1,000 cars, leveraging its Full Self-Driving (FSD) software to operate without a driver.

This development poses new challenges—and opportunities—for companies like Uber and Lyft. Although robotaxis could threaten their core business models by reducing the need for human drivers, Uber appears to be preparing for a shift.

Some experts predict that the long-term impact of robotaxis could be transformative for Uber. As the cost of operating autonomous fleets continues to fall, Uber may shift a portion of its UberX trips to self-driving vehicles.

This move could make the company a larger mobility provider. It combines traditional ride-hailing, autonomous services, food delivery, and logistics into one ecosystem. This shows that urban transportation may change in the future for investors and industry watchers, as well as the emerging key market players.

The Power Players Driving Autonomy

Several major players are leading this transformation. Let’s look at how three key companies are shaping the robotaxi future.

Waymo: Backed by Alphabet and Top VCs

Waymo was the first to launch a driverless robotaxi service in 2020 and now operates in cities like Phoenix, San Francisco, Los Angeles, and Austin. By early 2025, total rides exceeded 10 million. This marked a ride-volume growth of over 5,500% since August 2023. It averages over 200,000 rides each week. They have about 1,500 vehicles now and also plan to add 2,000 more by 2026.

Financially, BofA estimates Waymo’s 2024 revenue between $50–75 million, alongside up to $1.5 billion in losses. Waymo has raised a huge $5.6 billion in funding, with Alphabet leading this round, backed by top VCs. This shows strong confidence from long-term investors.

Waymo robotaxis use a mix of sensors—like LiDAR, cameras, and radar—along with advanced AI to see the road and drive safely without a human. The technology lets the car make decisions, follow traffic rules, and navigate city streets all on its own.

Waymo is a dominant force in U.S. robotaxi operations, a first mover with real deployment scale, and backed by Alphabet’s ecosystem. Analysts think the business might greatly increase Alphabet’s value, and this could lead to a spinoff. Its mix of technical leadership, regulatory approvals, and partnerships (like Uber) makes it a strong long-term investment.

While Waymo leads in the U.S., China’s Pony.ai is gaining attention as a high-growth contender with big plans.

Pony.ai: A Strongly Recommended Robotaxi Stock

Pony.ai is a Nasdaq-listed autonomous driving startup that recently drew bullish analyst attention. Goldman Sachs named it the top robotaxi stock. They predict a 26–49% increase, setting price targets between $21.85 and $26. This is up from around $17.88. The consensus among three analysts rates it a “Strong Buy” with upside potential around 40%.

Pony stock analysis
Source: Tipranks

Pony.ai is launching its Gen-7 robotaxi vehicles in Shenzhen. They are partnering with Xihu Group and aim to deploy over 1,000 units. The company announced a deal with Tencent. This boosts its commercial viability and investor confidence. Visit here to know more about how its robotaxi technology works.

Pony.ai stands out with high analyst endorsement, solid stock upside, and actionable deployment plans. The Shenzhen rollout and Tencent partnership boost its credibility. Plus, strong tech and financial support provide ample runway. Profitability is expected by 2029, and strong funding is in place. This makes it a great mid-term growth opportunity.

Another strong player in China is WeRide, a company blending rapid revenue growth with major global partnerships.

WeRide: China’s 1st Listed Robotaxi Company

WeRide, a Nasdaq-traded company (WRD), posted Q1 2025 revenue of RMB72.4 million (US$10 million). This is a 1.8% increase from last year. Robotaxi revenue rose to RMB16.1 million, making up 22.3% of total revenue. This is a jump from 11.9% the previous year.

The company maintains a healthy gross profit margin of 35%, supported by strong product components. The company has about RMB6.2 billion (US$853 million) in cash and a $100 million stock buy‑back plan.

WeRide also secured a $100 million equity investment from Uber to support expansion into 15 additional cities. However, it still posts net losses—RMB385 million in Q1—with heavy R&D spending to scale operations. Analysts expect the company to turn profitable by 2027 but note regulatory and cost uncertainties.

As China’s first listed commercial robotaxi operator, backed by Uber and flush with cash reserves, WeRide occupies a unique niche. Its strong revenue growth, wider commercial reach, and partnerships with Nvidia and Geely show how scalable it is. It’s a riskier investment but with more potential. It’s great for those wanting to invest in early-stage autonomous tech in fast-growing markets.

With industry leaders paving the way, what will it take for robotaxis to reach full-scale adoption? Private investors have a big role to play. 

Chinese autonomous driving companies are accelerating commercialization and going public, but at lower valuations due to limited private funding. Still, robotaxi adoption is rising, with firms like Horizon Robotics, WeRide, and Pony.ai leading a wave of discounted IPOs.

valuation robotaxi companies in China
Source: CB Insights

Next Stop: Mainstream Adoption

In the next phase, robotaxi adoption hinges on scaling fleets, partnering with ride‑hail apps, and integrating with public transit systems. Clear regulations and better infrastructure—such as lidar-friendly roads, V2X communications, and charging stations—will boost growth.

Electric fleets offer cost savings and efficiency. They also provide environmental benefits, making them a strong choice for the long term.

But challenges like safety standards, liability rules, and public trust are still big hurdles. These leading companies are making progress. Their success depends on providing reliable, affordable, and accepted autonomous mobility.

Apparently, robotaxis are no longer an experiment—they’re becoming part of real-world mobility. Investments, improved tech, and expanding fleets show the industry edging into viability and profitability. Companies like Waymo, Pony.ai, and WeRide are leading the charge toward scaling and global reach.

By 2030, robotaxis could transform the ride-hailing sector—offering cheaper, cleaner, and safer ride options. The coming years will be pivotal as leaders battle to scale operations, win consumer trust, and substantiate profitability within city streets worldwide.

The post Robotaxis Are Here: Top 3 Companies That Are Driving the Future of Ride-Hailing appeared first on Carbon Credits.

Biomass Gets a Boost: What the CREST Act Means for Carbon Removal

Biomass Gets a Boost: What the CREST Act Means for Carbon Removal

A new proposal in the U.S. Senate, called the CREST Act, could change how the country handles carbon emissions. It introduces a tax credit specifically aimed at biomass carbon removal and storage (BiCRS).

Backed by bipartisan support, the legislation supports the expansion of sustainable biomass projects that help pull carbon dioxide out of the air and store it safely. The bill hopes to boost much-needed investment in carbon removal just as demand grows sharply to address climate change.

How Will the CREST Act Support Carbon Removal?

The Carbon Removal Enhancement and Storage Tax (CREST) Act offers financial support for projects that remove and store carbon using biomass. This includes materials like wood, crop waste, and other organic matter. These materials naturally absorb carbon during growth, which can then be captured and stored through advanced processing methods like pyrolysis or gasification.

The main goal of the tax credit is to make these efforts more affordable and attractive to investors. Too often, biomass carbon removal projects struggle with financial uncertainty. Without strong incentives, many projects find it difficult to grow or even launch. The CREST Act aims to change this.

These tax credits would work much like similar credits for solar or wind power, helping companies offset costs and take on larger, long-term projects. This move could unlock more innovation and drive better carbon capture technology.

Why Biomass Could Be a Game-Changer for Carbon Removal

Biomass carbon removal uses organic materials—like trees or crops—to draw CO₂ from the air. Captured carbon can be stored underground or changed into products like biochar. Biochar is a solid carbon form that boosts soil health and traps carbon for hundreds of years.

This approach does more than lower emissions. It also helps rural communities. Many of these projects use forest or farm waste, creating jobs and boosting local economies. According to a USDA assessment, biomass can play a key role in sustainable agriculture and carbon management.

Still, scaling up biomass carbon removal faces challenges. It requires advanced infrastructure and clear policies to show that captured carbon will stay stored. The CREST Act would help by offering the financial support needed to build that infrastructure and refine these methods.

From CO₂ Cuts to Healthier Forests: CREST’s Broader Impact

Improving biomass carbon removal could reduce emissions while also benefiting the environment in other ways. Here’s how:

  • Lower Greenhouse Gases. Biomass captures carbon from the atmosphere, which can then be stored long-term. This reduces the amount of CO₂ contributing to climate change.

  • Healthier Forests and Farmland. Waste from agriculture and forestry is reused, helping prevent wildfires and supporting soil health.

  • Rural Development. More projects mean more jobs and steady income for farming and forestry communities.

  • Stable Carbon Storage. Technologies like biochar or carbon injection into geological formations keep carbon out of the atmosphere for long periods.

The success of these systems depends on strong rules. Experts warn that it’s important to track and verify every ton of carbon captured. With clear standards, this industry can provide real environmental value and win public trust.

Analysts See Growth in Biomass-Based Removal

Market analysts see strong growth potential for carbon removal, especially following this type of legislation. The global carbon market was worth $272 billion in 2020, and it keeps growing as countries adopt climate goals.

However, biomass has often been left behind due to a lack of support. Many government programs have favored industrial carbon capture, not biomass.

The CREST Act fills this gap. By targeting biomass carbon pathways with specialized tax credits, it offers the predictability investors want. Cutting dependence on unstable carbon credit prices helps attract private capital to sustainable biomass projects.

biomass carbon removal pathways WRI
Source: World Resource Institute

Industry leaders say this tax credit could drive innovation in methods like:

  • Pyrolysis – converting plant material into carbon-rich biochar

  • Combustion – managing heat energy for carbon storage

  • Gasification – turning biomass into gas-based fuel and capturing carbon

These tools could help develop a larger, more flexible carbon management system. With stronger funding, companies can improve accuracy, model carbon removal better, and ensure permanence in storage.

What the Numbers Say: Biomass Carbon Removal Is Surging

The carbon dioxide removal (CDR) market is growing fast. This shows that companies and governments are more committed to climate goals.

By 2025, the global carbon dioxide removal market could be about $842 million. It could grow at around 14% to nearly $2.85 billion by 2034. This growth comes from more people knowing about and using natural and tech carbon removal methods, like biomass-based approaches.

Biomass carbon removal is gaining traction. This includes methods like pyrolysis to make biochar, gasification, and combustion with carbon capture.

Biochar projects made up 86% of carbon removal purchases by volume in 2024. This shows how dominant the sector is in the CDR market. BiCRS refers to biomass carbon removal & storage, which includes BECCS and BCR.

top 10 durable cdr suppliers

The market for durable carbon removal credits is growing fast. These credits ensure long-term carbon storage. Forecasts say this market could hit $14 billion by 2035, at a growth rate of 38% from 2025 to 2035.

  • In the first quarter of 2025, about 780,000 carbon removal credits were contracted. This is a 122% increase from the same time in 2024.

dominant carbon removal methods Q1 2025 Allied Offsets
Source: Allied Offsets

The rising demand shows that companies want reliable, verified carbon credits to reach their net-zero goals.

The carbon removal market, which includes Direct Air Capture (DAC), Bioenergy with Carbon Capture and Storage (BECCS), and enhanced weathering, is valued at about $2 billion. It could grow to $40 billion by 2030 and may even surpass $250 billion by 2035.

BCG carbon removal credit demand projection 2030-2040

Biomass carbon removal is key in this ecosystem. It offers scalable, nature-based solutions. Plus, it brings extra benefits like rural economic growth and reduced wildfire risks.

The World Resources Institute says biomass carbon removal and storage (BiCRS) could make up around 20% of total biomass use in the U.S. by 2050. This is if biomass is used wisely for both carbon removal and other purposes. This shows strong growth potential for biomass pathways. Policies like the CREST Act support this.

Biomass Tax Credit Could Reshape Global Carbon Trading

A stable, well-supported industry around biomass carbon removal could shift the balance in carbon markets. It would encourage more entrants into the market, giving buyers more reliable and verified carbon credits. That means companies trying to meet climate goals could support cleaner methods and reduce their overall footprint with confidence.

If passed, the CREST Act could unlock large-scale funding for sustainable biomass projects across the country. This would not only help meet climate goals but also offer reliable income to farmers and foresters willing to participate.

The tax credit shows how good policy and advanced technology can tackle big climate problems. Whether it gains final approval depends on political negotiations, but momentum is strong thanks to bipartisan support.

Passing this bill would be a big step for U.S. carbon policy. It brings a mix of environmental responsibility, economic opportunity, and technical innovation into play.

The post Biomass Gets a Boost: What the CREST Act Means for Carbon Removal appeared first on Carbon Credits.

Top 4 Hydrogen Startups of 2025 Powering the Net Zero Future

hydrogen

In 2024, hydrogen emerged as a climate-friendly alternative to fuel as well as electricity. Promising projects sparked to life on both the production and consumption fronts. Despite Trump’s pro-oil stance, analysts are optimistic about hydrogen’s future in this new year- 2025.

According to BNEF, clean H2 supply is projected to increase 30X and could reach 16.4 million metric tons annually by 2030. This surge is mostly attributed to supportive policies and a flourishing project pipeline.

As we step into 2025, several crucial moments await the low-carbon, clean hydrogen sector. This year, a wave of innovative startups is pushing the boundaries of hydrogen production, storage, and application, capable of transforming the clean energy landscape.

Here are the top 4 hydrogen startups of 2025 that are leading this revolution:

1. Hydrogenious LOHC Technologies (Germany): Revolutionizing Hydrogen Transport

Germany-based Hydrogenious LOHC Technologies is addressing one of the toughest challenges in the hydrogen value chain—safe and efficient storage and transport.

Founded in 2013, the company’s Liquid Organic Hydrogen Carrier (LOHC) system uses benzyl toluene, a reusable heat transfer oil, to chemically bind hydrogen. This approach enables hydrogen to be stored and transported just like traditional fuels using existing infrastructure—cutting down both cost and risk.

Hydrogen System Targets 40% Emissions Cut

Hydrogenious, Bosch, and partners are installing a hydrogen power system at Hermann Josef Hospital in Erkelenz, Germany. Funded by Germany’s Education and Research Ministry, the Multi-SOFC (Solid Oxide Fuel Cells) project combines LOHC and SOFC technologies to deliver clean heat and power.

The project aims to reduce HJK’s carbon emissions by up to 40%. Initially, Bosch’s SOFC units run on natural gas while still achieving up to 60% electrical efficiency. Even in this early phase, the system cuts emissions by roughly 150 metric tons annually.

By 2026, Hydrogenious will integrate its LOHC technology, enabling the system to run primarily on hydrogen. Waste heat from the SOFC will power a dehydrogenation unit that releases hydrogen from the LOHC on-site, boosting overall system efficiency and lowering the hospital’s carbon footprint even further.

Thus, the Multi-SOFC project aims to deliver a reliable, low-emission energy solution. It shows how hydrogen can cleanly and affordably power large facilities. Once complete, it will serve as a global model for decarbonizing critical infrastructure.

Hydrogenious LOHC Technologies
Source: Hydrogenious LOHC Technologies

Why The Company Stands Out?

  • Backed by Big Names: Secured investments from JERA Americas, Temasek, Chevron, and Royal Vopak.
  • Industrial Projects: Operating a large-scale hydrogenation facility at Chempark Dormagen and contributing to the ‘Green Hydrogen @ Blue Danube’ initiative.
  • Global Expansion: Through a joint venture with Vopak, Hydrogenious is laying the groundwork for a global hydrogen supply chain.
  • Commercial Success: Deployed the first full LOHC-based hydrogen mobility chain, including pilot refueling stations in Germany.

With additional funding of €17 million raised in early 2025, the company is now accelerating its next phase of project deployment. Hydrogenious LOHC isn’t just innovating—it’s commercializing at scale.

MUST READ: Hydrogen in 2025: The Journey through Progress, Pitfalls, and Policy Shifts 

2. HiiROC (U.K.): Clean Hydrogen without CO₂

UK-based HiiROC is tackling the cost and emissions problem of hydrogen head-on with its Thermal Plasma Electrolysis (TPE) technology. Instead of relying on electricity-heavy electrolysis or carbon-intensive steam methane reforming, HiiROC produces zero-emission hydrogen by breaking down hydrocarbons into hydrogen and solid carbon black, a useful by-product.

What Makes It Game-Changing?

  • Ultra-Efficient: Uses 80% less power than water electrolysis.
  • Emission-Free: Produces no CO₂—a major leap in clean hydrogen production.
  • Modular Design: Can scale from small on-site generators to industrial-sized plants.
  • By-Product Value: Generates carbon black, widely used in tyres, plastics, and inks, offering dual revenue streams.
hydrogen HiiROC
Source: HiiROC

Zero-emission Carbon Black

HiiROC’s clean tech not only produces hydrogen but also generates solid, zero-emission carbon black as a by-product. It replaces traditional oil furnace methods that emit heavy pollution by creating a stable, pure form of carbon black with no emissions.

Thus, it offers a cleaner alternative for industries that rely on carbon black, including tyres, rubbers, plastics, inks, and toners.

 HiiROC HYDROGEN
Source: HiiROC

Unlocking New Potential Uses

HiiROC is also exploring innovative ways to put this clean carbon to work. Potential future applications include:

  • Environmental filters
  • Soil enhancers
  • Animal feed additives
  • High-performance and construction materials

In short, what was once a polluting material now has the potential to support decarbonization across multiple sectors.

Moving on, the company has raised over $35 million from major investors like Centrica and Kia Motors, reflecting strong market confidence. It’s partnering with Associated British Ports to build a production facility at Saltend Chemicals Park, set to produce 10 tonnes of hydrogen per day.

The company’s recognition under the UK’s Low Carbon Hydrogen Standard further boosts its regulatory credibility. With scalable tech, strategic projects, and government support, HiiROC is targeting to decarbonize hard-to-abate sectors while keeping costs low.

3. Electric Hydrogen (U.S.): Scaling Clean Hydrogen for Heavy Industry

Founded in 2020, Electric Hydrogen, headquartered in Massachusetts, is on a mission to make green hydrogen cost-effective at an industrial scale. It focuses on building next-gen electrolyzer systems to decarbonize hard-to-electrify sectors such as:

  • Steel and metals production
  • Chemicals and ammonia
  • Cement manufacturing
  • Sustainable aviation fuels (SAF) and e-methanol

In 2023, Electric Hydrogen raised $380 million in a funding round led by heavyweights including BP, Microsoft, and United Airlines. The raise pushed the company’s valuation past $1 billion, making it the first electrolyzer startup to reach unicorn status.

What Makes It Unique?

Electric Hydrogen’s standout innovation is its HYPRPlant—a fully integrated, modular electrolyzer platform designed for speed, scale, and cost savings.

  • Built around high-output PEM stacks
  • Pre-engineered for rapid site assembly
  • Cuts total installed costs by up to 60%
  • Backed by a 1.2 GW/year gigafactory in Massachusetts

This approach simplifies deployment, reduces risk, and accelerates timelines compared to traditional electrolysis systems.

Electric Hydrogen
Source:: Electric Hydrogen

Powering Cleaner Industries

Their 100MW plant uses advanced PEM technology and a smart “plant-as-a-product” design. This setup lowers costs by using fewer materials, saving space, and reducing installation time.

Their special electrolyzers produce much more hydrogen from the same stack size, making it easier to scale up and support big industrial projects.

Achieved Net Zero Emissions in 2023

In 2023, Electric Hydrogen’s Scope 1 and 2 emissions totaled around 600 metric tons of CO₂-equivalent, while Scope 3 emissions from their supply chain reached 17,725 metric tons.

Electric Hydrogen emissions
Source: Electric Hydrogen

However, the company offset all Scope 1 emissions by purchasing certified carbon credits from Sterling Planet and covered Scope 2 emissions with renewable energy certificates (RECs) from Terrapass.

  • This resulted in net-zero Scope 1 and 2 emissions in 2023.
Electric Hydrogen energy
Source: Electric Hydrogen

Most of their energy use came from electricity for manufacturing and R&D, along with natural gas for heating. A small amount of diesel was used to run a generator at the 1 MW protoplant in San Carlos, CA. It plans to use electricity to power larger test facilities in San Jose, CA, and Devens, MA.

4. Hystar (Norway): High-Efficiency Answer to Green Hydrogen Scaling

Founded in 2020 and based just outside Oslo, Hystar is a rising star in the clean hydrogen space. The company is reengineering how electrolyzers work—leveraging proprietary proton exchange membrane (PEM) technology to make green hydrogen production both cheaper and more scalable.

What Sets It Apart?

What sets Hystar apart is its ultra-thin membrane design—90% thinner than standard PEM systems. This breakthrough allows its systems to run at much higher current densities, which means:

  • Lower energy consumption
  • More hydrogen output per unit of power
  • Reduced use of critical raw materials

The result is a serious step-change in how economically green hydrogen can be produced at an industrial scale.

Smart Design, Scalable Tech

Hystar’s electrolysers are fully containerized and modular, making them easy to deploy. Its flagship Vega 1000 system delivers 5 MW of clean hydrogen production, designed for sectors like:

  • Heavy industry
  • Clean transport
  • Renewable energy storage
  • Industrial decarbonization

Better yet, the technology is built with automation and mass manufacturing in mind, future-proofing it for global scale.

Sustainable Production: From Megawatts to Gigawatts

Currently operating at 100 MW annual capacity, Hystar is scaling rapidly. Through Project Sagitta, the company is launching a gigawatt-scale, automated production facility in Høvik.

  • Starting with 1.5 GW/year by 2027
  • Expanding to 4.5 GW/year by 2031
  • Expected to produce 6 million tonnes of green hydrogen over 10 years
  • Avoiding over 11 million tonnes of CO₂ emissions

This bold scale-up reflects Hystar’s long-term vision: to help shift the market away from fossil-based “grey” hydrogen toward truly sustainable, zero-emission fuel.

The company secured $36 million in funding, drawing interest from strategic investors committed to decarbonization. Most notably, it has partnered with Nippon Steel Trading to accelerate the adoption of its tech across global markets.

With cutting-edge PEM innovation, a scalable business model, and the infrastructure to back it, Hystar is building more than electrolyzers—it’s building the backbone of the future hydrogen economy.

The post Top 4 Hydrogen Startups of 2025 Powering the Net Zero Future appeared first on Carbon Credits.

Clean Energy Beats Fossil Fuel in Historic $3.3T Global Energy Investment in 2025, IEA Report

Clean Energy Beats Fossil Fuel in Historic $3.3T Global Energy Investment in 2025, IEA Report

In 2025, global energy investment is projected to reach a record $3.3 trillion, with clean energy beating fossil fuels, according to the International Energy Agency (IEA). This growth happens even with geopolitical tensions and economic uncertainty. It shows that the world is still focused on energy security and moving to cleaner energy sources. 

This article explores the main trends, drivers, and challenges shaping energy investment this year, with the main findings from the IEA’s World Energy Investment 2025 report. It provides a clear picture of where global energy capital is flowing and what challenges lie ahead.

Clean Energy Surges Past Fossil Fuels in Investment Race

In 2025, an expected $3.3 trillion will be invested in global energy generation. Of this, around $2.2 trillion will support renewables, nuclear power, electricity grids, storage, low-emission fuels, energy efficiency, and electrification. This is double the amount set for oil, natural gas, and coal, which will receive around $1.1 trillion

energy investment 2025 IEA report
Source: IEA report

Clean energy investment surged after the COVID-19 pandemic. This growth continues thanks to technology, economic factors, and policy support, not only climate policies.

Solar Power Leads the Way

Investment in low-emission power has nearly doubled in five years. Solar photovoltaic (PV) technology is driving this growth. By 2025, global spending on solar energy, including utility-scale and rooftop systems, is set to hit $450 billion. This will make it the largest energy investment category.

Solar panels, especially those imported from China, are becoming more affordable and are driving energy investment in many developing countries. For example, Pakistan imported 19 gigawatts (GW) of solar capacity in 2024, about half its total grid-connected capacity.

Growth in Batteries and Nuclear Energy

Spending on batteries for power sector storage will hit $66 billion by 2025. This will help integrate renewable energy sources into electricity grids. Nuclear investment is also rising, with spending on new plants and refurbishments expected to exceed $70 billion this year. Interest in new nuclear technologies, such as small modular reactors (SMRs), is growing, especially in the United States and the Middle East.

l annual investment in the power sector

Global Giants Drive the Clean Energy Boom

About 70% of the recent increase in clean energy investment comes from countries that import fossil fuels, led by China, Europe, and India. China is investing heavily in reducing its reliance on imported oil and gas and becoming a leader in clean energy technologies.

A separate report by energy think tank Ember also shows the same trend – China takes the lead in clean energy investment in early 2025.

clean electricity or energy generation China vs 2025

Meanwhile, Europe sped up its investment in renewables and energy efficiency. This change came after Russian gas supplies were disrupted due to the Ukraine invasion. The United States has boosted investment. This is partly to compete with China in the supply chains for new clean technologies.

regional energy investment growth

Emissions reduction is a big reason to invest, but it’s not always the main one for mature and cost-competitive clean technologies. Investors are also influenced by concerns about energy security and the desire to lead in new industries.

Uncertainty in the global economy and trade is making some investors hold off on new project approvals. However, spending on current projects is still strong, especially in the field of rising artificial intelligence (AI) dominance. 

AI + Energy: The Data Center Effect

The fast rise of AI and data centers is driving up electricity demand. This trend is also boosting investment in power generation. Annual investment in data centers has risen by 67% over the past two years, and from 2025 to 2030, an additional $4.2 trillion is expected globally. 

By 2030, data centers might use 950 terawatt-hours of electricity, doubling their current amount. This could lead to over $170 billion in investments for new generation capacity. Renewables will meet most of this demand, as shown below. 

power generation investment for data centers 2025-2030
Source: IEA report

However, interest is rising in next-generation solutions like small modular nuclear reactors. SMRs provide stable power and fit the constant energy needs of data centers. 

Technology companies are also exploring geothermal energy partnerships, supported by rising venture capital. Tech giants and energy developers are teaming up for new nuclear and geothermal projects. However, challenges like cost uncertainties and regulatory hurdles for SMRs still exist.

Gridlock Ahead: Infrastructure Struggles to Keep Pace

Investment in the electricity sector is set to reach $1.5 trillion in 2025, about 50% higher than the total spent on bringing oil, natural gas, and coal to market. Spending on electricity grids is around $400 billion each year. But this isn’t enough to match the fast rise in power demand and the growth of renewables.

Delays in permitting, supply chain bottlenecks for components like transformers and cables, and the weak financial health of utilities, especially in developing countries, are slowing progress.

Coal and Gas Remain Significant

Despite the focus on clean energy, coal and gas continue to play a major role in some regions. In 2024, China greenlit nearly 100 GW of new coal-fired power plants. India added another 15 GW. This raised global approvals to their highest since 2015.

In contrast, advanced economies did not order any new coal-fired power plants last year.

Notably, investment in new gas-fired power is rising. The United States and the Middle East make up nearly half of the new project approvals.

Fossil Fuel Investment Trends: Oil and Gas Investment Declines

Oil prices and demand are set to drop, leading to a 6% decrease in investment in upstream oil projects in 2025. This will be the first annual decline since the COVID-19 pandemic in 2020 and the largest since 2016.

Upstream oil and gas investment is expected to drop by around 4%. This brings the total to just under $570 billion. Of this amount, 40% will go toward maintaining production at current fields. Investment in oil refineries is also set to reach its lowest level in a decade.

investment in oil and gas
Source: IEA report

Spending on new LNG facilities is rising despite some delays and cost overruns. Projects in the United States, Qatar, and Canada are getting ready to start. From 2026 to 2028, the world may experience huge yearly jumps in LNG capacity, with the United States set to nearly double its export capacity.

Meanwhile, investment in coal supply is expected to increase by 4% in 2025, continuing a trend of steady growth over the past five years. This reflects ongoing demand in parts of Asia, even as advanced economies move away from coal.

The Outlook for 2025 and Beyond

The global energy investment scene is changing fast, as reported by the IEA. Clean energy technologies are drawing more money and interest. Fossil fuels are still important in some areas. However, the trend is shifting.

More investment is going into renewables, electrification, and energy efficiency. This transition is being shaped by technology advances, economic factors, and the need for energy security, as well as by climate policies.

To meet rising electricity demand and ensure energy security, investment in grids and storage should accelerate. As such, continued support for innovation and infrastructure will be crucial for a successful energy transition in the years ahead.

The post Clean Energy Beats Fossil Fuel in Historic $3.3T Global Energy Investment in 2025, IEA Report appeared first on Carbon Credits.

Trump’s 50% Tariff Hike: Boost or Blow to U.S. Steel and Aluminum?

tariff

President Donald Trump took a bold step to protect American industry by signing a proclamation that doubled tariffs on steel and aluminum imports, from 25% to 50%. The new rate took effect on June 4, 2025.

While Trump aims to curb unfair trade practices, the key question is: Will higher tariffs truly strengthen U.S. manufacturing or simply raise costs for consumers and businesses?

Why Trump Raised Tariffs Again?

Trump made his message clear: the U.S. will no longer accept unjust competition that hurts national security and local manufacturing. The EO highlights that he used Section 232 of the Trade Expansion Act of 1962, a law that lets the president limit imports if they threaten national security.

His team says the U.S. market is being flooded with cheap steel and aluminum from other countries, often helped by foreign subsidies and unfair pricing. This, they argue, puts American metal industries at risk.

This isn’t Trump’s first move. Back in 2018, during his first term, he put a 25% tariff on steel and a 10% tariff on aluminum to protect U.S. jobs and factories.

But now, with U.S. production slowing again—steel output down to 75.3% in 2023 and aluminum at just 55%—he says it’s time for tougher steps.

Trump said at a rally at a U.S. Steel plant

“At 25%, they can get over the fence. At 50%, they can no longer get over the fence.”

Tariffs Take the Test

Trump’s team strongly believes tariffs are getting results—and they’ve got studies to back it up. A 2024 study on Trump’s first-term tariffs said they boosted the economy and brought key industries back to the U.S.

Some key observations highlighted in the EO were:

  • In 2023, the U.S. International Trade Commission found that the tariffs cut imports from China and led to more U.S. production, with little effect on prices.
  • The Economic Policy Institute said Trump’s first tariffs didn’t cause inflation and only briefly affected prices.
  • The Atlantic Council noted that tariffs push U.S. consumers to buy American-made goods.
  • Former Treasury Secretary Janet Yellen said in 2024 that higher tariffs won’t lead to noticeable price hikes.

Furthermore, another study from last year found a global 10% tariff could grow the U.S. economy by $728 billion, add 2.8 million jobs, and boost household incomes by 5.7%.

Eased Tariffs for UK, Tough Penalties for Violators

While most imports will face the 50% tariff, the United Kingdom gets a temporary carve-out. Steel and aluminum imports from the UK will remain at 25% until at least July 9, 2025, pending developments in the U.S.-UK Economic Prosperity Deal.

Also, the tariff applies only to the steel and aluminum content of imported products. Other materials will be taxed under standard rates.

In addition, the administration is introducing stricter enforcement. In this regard, importers will need to report steel and aluminum content more transparently now or risk fines or losing their import rights altogether.

The Industry Reaction: Praise and Concern

Some U.S. manufacturers and industry groups welcomed the higher tariffs, viewing them as a necessary shield against unfair global competition.

The American Primary Aluminum Association praised the move, saying stronger enforcement would help revive the domestic sector.

  • Domestic production of aluminum is just one-third of its needs. According to Statista, the United States imported about 4.8 million metric tons of aluminum for consumption in 2024.

Imports of aluminum for consumption in the United States from 2010 to 2024 

US aluminum

The steel industry, which saw a wave of investment after Trump’s first tariffs, also backed the decision. Over $10 billion was invested in new U.S. mills between 2016 and 2020, and the industry credited Trump’s policy for that resurgence.

But not everyone’s cheering.

A BBC report says Canadian producers, who supply a significant share of U.S. metal imports, warned the tariffs would “devastate” their industries. Meanwhile, U.S. businesses that rely on imported metals expressed frustration.

Rick Huether, CEO of Independent Can Co., said the chaos from sudden tariff hikes is already forcing firms to raise prices and delay investments.

He also added, “There’s a lot of chaos. I fear my customers will switch to plastic or paper packaging because of the uncertainty.”

Impact on Consumers and U.S. Supply Chains

Moving on, AP News has analyzed that the ripple effects of these tariffs go far beyond the metal industry. The report highlighted the potential impact of Trump’s tariffs on consumers and the U.S. supply chains in the following way:

  • Autos: Imported steel and aluminum could raise car and repair costs.
  • Electronics: Metal parts may push up gadget prices.
  • Canned goods: Aluminum cans could make groceries more expensive.
  • Construction: Higher metal costs may raise housing and project prices.
  • Logistics: Pricier trucks may increase shipping and shelf prices.

So, while the goal is to boost American production, the short-term cost could land on everyday consumers.

“So, Are Those Hiked Trump Tariffs Strategic or Tactical?”

Some still question Trump’s long-term strategy. Is this a serious industrial policy—or just a negotiating ploy?

Many firms hoped the move would be temporary. But Trump’s speech at the steel plant made one thing clear: he intends this to be permanent, unless countries agree to stricter trade terms.

  • The U.S. is the second-largest importer of steel globally, after the EU. Its main suppliers include Canada, Brazil, Mexico, and South Korea. With the new 50% tariff, trade dynamics are likely to shift dramatically.
us steel
Chart taken from United States Steel Imports Report

The Biden administration has not yet responded. But reactions from global partners will follow soon. Retaliatory tariffs are not off the table, and other nations may look to strike back.

For now, Trump’s second round of tariffs shows a strong push to bring manufacturing back to the U.S.—even if it leads to higher costs and trade disputes.

Raising tariffs to 50% is a bold move to support American industry. While metal producers in the U.S. support it, the decision could disrupt global trade and raise prices for American buyers. Whether this move brings long-term benefits or new problems will depend on how it’s enforced, how other countries respond, and what other policies are put in place.

The post Trump’s 50% Tariff Hike: Boost or Blow to U.S. Steel and Aluminum? appeared first on Carbon Credits.