China Joins Google, Amazon, and xAI in the Race to Build AI Supercomputers in Space!

China Joins Google, Amazon, and xAI in the Race to Build AI Supercomputers in Space!

In late 2025, space is emerging as a new frontier for artificial intelligence (AI) infrastructure. What was once a futuristic concept is now becoming a realistic goal. Global tech firms and Chinese aerospace companies are racing to deploy AI data centers in orbit. Their goal is to tackle the power, cooling, and data limits that challenge Earth-based systems.

Why Space — and Why Now

AI workloads are growing at an unprecedented pace. Training and running large models need a lot of computing power. They also use a lot of energy and need advanced cooling systems.

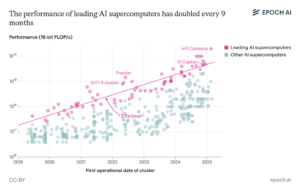
On Earth, these demands strain not only data centers but also power grids, water resources, and land availability. From 2019 to 2025, AI supercomputers saw their performance double every 9 months or 2.5x per year. In contrast, hardware costs and energy usage doubled about every year.

computational performance of AI supercomputers
Source: EPOCH AI

Space-based computing offers a promising alternative. Satellites in orbit get almost constant sunlight. This makes solar power generation more efficient than solar farms on the ground.

The vacuum of space also allows heat to dissipate naturally. This reduces the need for energy-intensive cooling systems.

Orbital “edge computing” allows engineers to process a lot of data right in space, including data from Earth observation satellites. This approach avoids the bandwidth limits and delays that occur when transferring vast amounts of raw data to Earth.

Experts view 2025–2027 as a key turning point. During this time, tech advances, costs, and goals will align.

Who’s Doing It: Rivals in Orbit

Chinese companies are taking the lead in deployment. Zhongke Tiansuan (Comospace), founded in 2024, has operated a space computer on a Jilin‑1 satellite for over 1,000 days. Their new system, “Aurora 5000,” uses a powerful domestic GPU. It will be tested in orbit soon. 

Liu Yaoqi, CEO of Zhongke, said:

“Orbital edge computing moves AI directly to the source of data filtering petabytes of daily satellite imagery and traffic before the narrow downlink chokes.”

At Zhejiang Laboratory, engineers are developing a “mini computing constellation” called the Three-Body Computing Constellation. Its first batch of 12 satellites was launched in May 2025.

Each satellite carries an 8-billion-parameter AI model and can perform around 744 trillion operations per second. Together, they form the first stage of a network that could reach 1,000 peta-operations per second if fully scaled.

China plans a central space data center in dawn–dusk orbit (700–800 km altitude) with a power capacity exceeding 1 gigawatt. The plan is phased: test satellites from 2025 to 2027, followed by a full-scale megawatt-class orbital data center by 2035. If realized, it could surpass the total capacity of China’s current terrestrial data centers.

Key technologies include high-speed laser links between satellites. These links recently showed a 400 Gbps connection. They also use advanced cooling and error-correction systems to tackle radiation and thermal challenges.

If it works, the constellation can handle data for Earth observation, maritime tracking, environmental monitoring, and disaster response. It could also support global AI services. This would not depend entirely on ground-based infrastructure.

Global Tech Giants: Orbital AI as the Next Moonshot

International tech companies are pursuing similar goals. Google’s Project Suncatcher plans solar-powered AI data centers in low Earth orbit. Each satellite would carry Tensor Processing Units (TPUs) and operate in dawn–dusk orbits for continuous sunlight.

Google anticipates launching the first test satellites by 2027. These small racks of hardware will test whether TPUs can operate reliably in orbit.

Other tech companies, including those running satellite internet constellations, are exploring space-based computing. Amazon’s “Leo” project, for example, may one day link satellites to cloud and AI infrastructure.

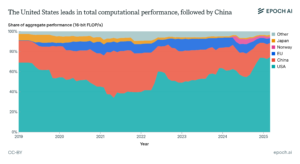
According to Epoch AI’s 2025 report on AI supercomputers, the United States accounts for about three‑quarters of total global AI supercomputer compute capacity. This dominance reflects how U.S.-based companies deploy the largest and most powerful GPU clusters.

total computational performance
Source: EPOCH AI

Why the Market Is Moving to Space-Based Compute

  • The shift to space-based AI reflects broader trends: increasing compute demand, rising energy costs, and sustainability concerns.

The global AI supercomputer sector is expected to grow dramatically. By 2030, top supercomputers might handle about 2 × 10²² 16-bit operations each second. They will use millions of AI chips and need gigawatts of power.

Space-based computing could ease pressure on terrestrial grids, lower carbon footprints, and reduce reliance on water for cooling. This is appealing to both technology companies and governments seeking sustainable infrastructure.

Orbital data centers are much more energy-efficient than those on Earth. They capture nearly constant solar power, being up to 10 times more effective than ground panels because there’s no atmosphere to interfere. They also use radiative cooling in space’s vacuum. This cuts cooling needs, which usually consume 40% of Earth’s data center energy, with average PUEs of 1.5 to 1.7.

  • As such, it could reduce emissions by 50-80% by operating without fossil fuels. It would also ease pressure on the grid.

Currently, data centers use 4-12% of U.S. electricity, mainly from carbon-heavy sources. By 2028, this shift can make a big difference. Projects like Google’s Suncatcher target this for scalable AI without water or land impacts.

As launch costs drop, thanks to reusable rockets and mass-produced satellites, orbital data centers could compete with ground options by the mid-2030s.

A full-scale orbital network, like China’s gigawatt-class constellation, could match or exceed Earth’s mega data centers. It could offer worldwide low-latency coverage. This may change industries like Earth observation, environmental monitoring, global connectivity, autonomous logistics, and disaster response.

What’s Next: The Road to 2035 Orbital Megacenters

orbital data center market growth 2035

Key milestones to watch include:

  • 2027: First test satellites from Google and other firms. Early results will show if solar-powered TPUs can operate reliably.
  • 2025–2030: AI compute demand continues to rise, and electricity and water costs increase on Earth. Launch costs may drop, making space deployment more viable.
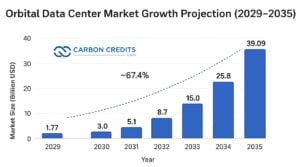
  • 2030–2035: Large constellations, such as China’s gigawatt-class network, may start operating fully. This will provide global coverage and high computing power. The market could grow up to $39 billion in value.
  • Governance and regulation: Nations and companies will need new rules for orbital infrastructure, data rights, and collision avoidance.

Overall, the move to space represents a major evolution in cloud computing. AI infrastructure could shift from Earth to orbit, which could provide high performance and nearly universal coverage. It also offers a more sustainable path for AI growth.

The post China Joins Google, Amazon, and xAI in the Race to Build AI Supercomputers in Space! appeared first on Carbon Credits.

Africa’s Forests Are Now Emitting Carbon Instead of Absorbing It

Africa’s Forests Are Now Emitting Carbon Instead of Absorbing It

Africa’s forests have reached a worrying turning point. A new study shows that many forests now release more carbon dioxide than they take in. This change is mainly due to deforestation and forest degradation. It is the first time in modern records that Africa’s forests have become a net carbon source instead of a natural buffer against global warming.

The research, published in Scientific Reports, was led by scientists from the National Centre for Earth Observation at the Universities of Leicester, Sheffield, and Edinburgh. Using satellite data, they tracked changes in forest biomass over time. Their findings are crucial for global climate goals, which is especially true for the targets set in the Paris Agreement.

A Major Shift After 2010

The study shows that Africa’s forest carbon balance changed around 2010. Between 2007 and 2010, forests were still gaining carbon, acting as a natural sink. But from 2010 to 2017, the continent lost roughly 106 million tonnes of forest biomass each year. Converted to carbon dioxide, this equals about 200 million tonnes of CO₂ emissions annually.

This is significant because Africa is home to the second-largest block of tropical rainforest, mainly in the Congo Basin. These forests store carbon, regulate rainfall, and support biodiversity. Losing their ability to absorb carbon means the world must reduce emissions faster elsewhere.

The trend comes from two main causes: deforestation, which is when forests are cleared, and forest degradation. In degradation, forests stay, but they lose biomass from selective logging, fires, or mining. These processes reduce the amount of carbon stored in vegetation.

Hotspots of Concern: DRC, Madagascar, and West Africa

Central Africa, Madagascar, and parts of West Africa show the most pronounced changes. The Democratic Republic of Congo (DRC) holds more than half of the Congo Basin rainforest. In 2024, it lost a record 590,000 hectares of primary forest. This is the largest loss in its monitoring history.

The map below shows changes in Aboveground Biomass Density (AGBD) from 2007 to 2017. Green areas represent gains, while purple areas indicate losses.

The upper-right inset shows biomass loss due to deforestation near settlements, rivers, and roads in the DRC. The lower-left inset features a South African forest plantation, highlighting clearcuts next to newly planted areas.

cumulative Aboveground Biomass Density (AGBD) net gains (green) and losses (purple) from 2007 to 2017
Source: Rodríguez-Veiga, P., Carreiras, J.M.B., Quegan, S. et al. Loss of tropical moist broadleaf forest has turned Africa’s forests from a carbon sink into a source. Sci Rep 15, 41744 (2025). https://doi.org/10.1038/s41598-025-27462-3

The main pressures come from small-scale farming. Rural communities clear forests for crops. Artisanal mining has also grown because of global demand for minerals like cobalt, copper, and gold.

Madagascar faces deforestation from slash-and-burn farming, charcoal production, and commercial logging. In West Africa, countries like Ghana, the Ivory Coast, and Nigeria are losing forests due to agriculture and timber extraction. Together, these regions contribute most of the 200 million tonnes of CO₂ now released by Africa’s forests annually.

Global Context: How Africa Compares

Worldwide, forests remain under pressure. Between 2015 and 2025, the world lost about 10.9 million hectares of forest annually, down from 17.6 million hectares per year in 1990–2000.

forest expansion vs deforestation 2015 2025

In 2024, the world lost 6.7 million hectares of primary forest. This loss was caused by fires, logging, agriculture, and land clearing. Notably, fires have recently overtaken agriculture as the main cause of tropical forest loss.

Within this global picture, Africa has the highest rate of net forest loss among all regions during 2010–2020. This aligns with the new study showing that Africa’s forests have shifted from being carbon sinks to carbon sources.

South America, with the Amazon, still loses a lot of forest, but slower now. Meanwhile, some Asian countries have gained forest areas in recent years.

This contrast reveals a troubling trend. While some areas reduce forest loss, tropical forests in Africa and parts of South America are under serious pressure. This situation endangers ecosystems and jeopardizes global climate efforts.

forest loss by driver by region

Why Forest Biomass Is Falling

Several factors explain Africa’s forest losses:

  • Expanding agricultural land
  • Timber harvesting, legal and illegal
  • Mining and mineral extraction
  • Charcoal and fuelwood production
  • Population growth and land pressure

Even partial forest losses across large areas add up to significant carbon emissions. Climate change also weakens forests: higher temperatures, droughts, and more frequent fires slow regrowth and reduce forest health.

Implications for Climate Targets

Africa’s weakening forest sink has serious global implications. Forests in Africa, Asia, and South America currently absorb much of the world’s emissions. If Africa’s forests stop absorbing carbon and start releasing it, the global carbon budget tightens.

Professor Heiko Balzter, senior author of the study, notes: 

“If we are losing the tropical forests as one of the means of mitigating climate change, then we basically have to reduce our emissions of greenhouse gases from fossil fuel burning even faster to get to near-zero emissions.”

National climate strategies also face more pressure, as many countries rely on forests to meet their climate pledges.

COP30 and Funding Efforts: Are They Enough?

The study was released after COP30 in Brazil, where countries discussed new funding for forest protection. The Tropical Forests Forever Facility (TFFF) launched with $5.5–$6.6 billion. It will pay tropical countries about $4 per hectare to keep their forests. At least 20% of funds will go to Indigenous Peoples and local communities who play a major role in forest protection.

Forest carbon financing is picking up speed. Global investment in sustainable forest management, restoration, and conservation almost doubled from 2020 to 2024. It grew from under US$12 billion a year to about US$23.5 billion annually.

This surge comes from a mix of public funds, which make up about 60% of total flows, and growing private capital. Private capital’s share increased from about 25% in 2020 to around 40% in 2024.

More companies are aiming for net-zero emissions. As demand rises for verified forest carbon credits, forests are seen as both ecological assets and investment opportunities.

However, experts note that the funding is far below what is needed. Brazil had proposed $125 billion to protect and restore tropical forests globally. Africa’s fast-changing ecosystems make this gap even more urgent.

The Congo Basin: A Carbon Giant Under Pressure

The Congo Basin absorbs about 600 million tonnes of CO₂ each year. This helps balance emissions from other continents. But its capacity is declining due to increasing forest disturbance.

If the trend continues, the world could lose one of its last major natural carbon buffers. Protecting this region is vital for Africa and the world’s climate. It impacts biodiversity and rainfall patterns well beyond the continent.

Reversing the Trend: Can Africa Save Its Forests?

Reversing the trend is still possible but requires strong action. Protecting remaining forests is the most urgent step. Governments should reduce pressure from agriculture and mining. They also need to improve land-use planning and monitor illegal logging.

Funding mechanisms like TFFF can help, but must increase to match the scale of the problem. Local communities and Indigenous groups, who manage large forest areas, need financial and technical support. Restoring degraded forests can help recover some carbon storage, but it takes time. 

Africa’s forests shifting from absorbing to emitting carbon is a major warning for the planet. It shows how fast natural systems can change under pressure. This highlights the need for stronger global cooperation, better funding for forest protection, and support for local communities.

If action is delayed, the world will face an even harder path to meet climate goals. With stronger investment and protection measures, however, forests can continue storing carbon, supporting biodiversity, and sustaining millions of people across Africa.

The post Africa’s Forests Are Now Emitting Carbon Instead of Absorbing It appeared first on Carbon Credits.

A Recap of the Voluntary Carbon Market: Quality Over Quantity

A Recap of the Voluntary Carbon Market: Quality Over Quantity

The voluntary carbon credit market (VCM) has undergone notable changes from 2021 to 2024, according to the latest Ecosystem Marketplace (EM) report. After a trading peak, total volumes dropped. Still, demand for high-quality, high-integrity carbon credits is strong. This is especially true for those providing real carbon removals and environmental co-benefits. This shift signals a maturing market focused more on impact than sheer volume.

A Price Jump in 2022, With Less Trading

After 2021, many companies renewed or launched carbon credit purchases. In 2022, the average price per carbon credit (each credit represents one ton of CO₂e removed or avoided) jumped. It rose from $4.04 per ton in 2021 to $7.37 per ton in 2022 — an increase of 82%. This was the highest price level seen in 15 years.

Despite the higher price, the total trade volume dropped from its 2021 peak. Trading slowed while buyers became more selective about what credits they bought.

Because the carbon price rose as volume dropped, the overall market value in 2022 stayed roughly stable, at just under $2 billion. This shows the market still had strong demand, but buyers favored fewer, pricier credits rather than many low‑cost ones.

2023: Market Contracts, But Credit Quality Matters

In 2023, the voluntary carbon market shrank sharply. The total reported transaction volume fell by 56% compared with 2022. At the same time, the total value of transactions dropped to $723 million.

The average credit price in 2023 settled at about $6.53 per ton CO₂e. Some project types suffered more than others.

Credits tied to forestry and land‑use (including REDD+ projects) — once among the most popular — saw a steep decline in trade, as buyers paused buying while waiting for clearer standards.

Yet, credits from projects with more robust environmental or social benefits — such as biodiversity, community support, or sustainable land use — remained in demand. The market began favouring “high‑integrity” credits or those with:

  • strong verification,
  • clear additionality (meaning the credit reflects real, extra emission reductions or removals), and
  • co‑benefits beyond carbon.

2024: Lower Trading, But Underlying Demand Persists

According to the 2025 update from Forest Trends / EM, the VCM continued contracting in 2024. Transaction volumes dropped by about 25 % compared to 2023. Yet, credit prices fell only modestly — about 5.5%.

carbon credits annual retirements 2024 by project type

More importantly, the number of credits “retired” (i.e., used to offset emissions) remained stable. In 2024, a little over 180 million tons of CO₂e carbon credits were retired under the largest certifying standards — roughly the same as in prior years.

This suggests that while fewer credits are being traded, companies and organizations continue to use offsets to meet climate goals. In other words, the trading market is smaller, but demand for real credits has not vanished.

The EM report also notes a growing price gap between different types of credits. Credits representing actual carbon removals (e.g., from reforestation or removal technologies) were, on average, 381% more expensive than credits representing only emissions avoidance.

  • This growing premium reflects buyer demand for greater assurance: they want credits that remove or permanently store carbon, not just avoid future emissions.

Voluntary carbon credit market; price, volume, value 2022-2024

SEE MORE: Base Carbon: A Rising Force in the Voluntary Carbon Market

Lessons from Two Decades: Market Evolution and Maturity

In another report by EM, the VCM has grown over almost 20 years. It started as a small, experimental area and has become a more organized and advanced system.

In the early 2000s, dubbed as “The Wild West,” companies joined in mainly due to social responsibility. They wanted to “walk the talk” on climate action. Dell, Google, and Nike were among the first to make significant purchases. Verification standards were limited, and concerns over additionality and real climate impact were common.

Over time, third-party standards and transparency measures strengthened. By 2008, 96% of credits were verified, showing that buyers increasingly valued quality and integrity. The market faced tough times, especially after the 2008 financial crisis. It also struggled after early platforms, like the Chicago Climate Exchange, closed down.

Voluntary markets kept going, even with slowdowns. They highlighted co-benefits such as:

  • Protecting biodiversity

  • Supporting community livelihoods

  • Promoting sustainable land use

Recent trends show the market split into two: technological removals, like direct air capture, and nature-based solutions. Buyers now want high-integrity carbon credits. They look for permanence, co-benefits, or both.

The market has grown up from its “wild west” days. Now, quality, transparency, and long-term impact drive value. It’s not just about trading volume anymore.

What Type of Credits Now Lead the Market?

Several shifts stand out in what kinds of credits buyers prefer. The top ones include:

  • Nature‑based and high‑integrity credits lead demand. Projects in forestry, land use, agriculture, and similar areas remained important, especially when they include social or environmental co‑benefits.

  • Carbon removal credits gain higher price premiums. Credits from activities that remove CO₂ or store carbon long‑term now cost far more than reduction‑only credits. This shows buyers prioritizing permanence and long‑term impact over cheaper, short‑term reductions.

carbon credit price per project type abatable

  • Lower‑integrity credits — especially older or riskier projects — lose traction. Credits from some legacy project types (like certain REDD+ or basic clean energy projects) saw steep declines. Some buyers paused new purchases while waiting for clearer integrity standards.

Thus, the market seems to be shifting away from volume-driven trading to a smaller, more focused market driven by quality, trust, and long-term climate impact.

What This Means for Carbon Credit Use and Climate Efforts

These recent trends offer important signals about how voluntary carbon credits are used today:

  1. Offsetting now leans toward actual carbon removals and nature‑positive projects. Buyers seem more interested in credits that make a tangible, lasting difference, not just claims of avoided emissions.

  2. High‑quality verification and co‑benefits encourage trust. Credits that deliver environmental or social benefits beyond carbon — like biodiversity protection or community livelihood support — appear more desirable.

  3. Strong demand remains even as trading shrinks. The fact that credit retirement stayed high in 2024 shows that many buyers still believe in carbon credits as part of their climate strategy. Trading markets may fluctuate, but the demand for real carbon offsets persists.

  4. Credit markets are maturing and re‑sorting. The voluntary market seems to be evolving: less speculative or volume‑based trading, more emphasis on integrity, quality, and long‑term value.

  5. Not all credits are equal. The wide price divergence between credit types underscores that buyers must look carefully at what a credit represents — removal or reduction, short-term or permanent, people‑friendly or just carbon‑focused.

The VCM Is in Transition — Not Collapse

From 2021 to 2024, the voluntary carbon credit market has undergone a major shift. After a peak in trading, volume dropped. Yet, demand did not disappear. Instead, buyers turned more toward high‑integrity, often more expensive credits that offer real carbon removals and co‑benefits beyond carbon alone.

Today’s market values quality over quantity. Market value has dropped from its peak. But companies and organizations continue to retire credits, showing that credits remain a tool for climate action.

The current state suggests the VCM is not collapsing. It is evolving, becoming more selective and — for those credits that meet higher standards — more valuable. For carbon‐credit markets to truly support climate goals, this shift toward integrity, transparency, and impact may be necessary.

The post A Recap of the Voluntary Carbon Market: Quality Over Quantity appeared first on Carbon Credits.

Adani Pledges $5 Billion for Google’s AI Data Center in India

Adani Pledges $5 Billion for Google’s AI Data Center in India

India is taking a major step toward becoming a global hub for digital infrastructure. The Adani Group will invest up to US$5 billion in Google’s new AI data center project in India. This investment comes through their joint venture, AdaniConneX. It also shows how fast India is growing its data center capacity. This growth supports cloud computing, AI, and the digital services that millions use daily.

The new campus will be in Visakhapatnam, Andhra Pradesh, with the first phase aiming to deliver about 1 gigawatt (GW) of power. This makes it one of the largest data center projects in India so far.

The development is not only about servers and storage. It also involves a big investment in clean energy, subsea cables, and infrastructure. This supports the high electricity and cooling needs of AI workloads. These facilities are larger than typical data centers and are also much more complex. They need to manage huge amounts of computation. At the same time, they must stay efficient and reliable.

Why India’s Data Center Market Is Exploding

India’s data center industry has grown steadily for the past decade. Recently, this growth has sped up even more.

  • As of April 2025, total data center capacity across India’s top markets reached 1,263 megawatts (MW). Analysts predict that by 2030, capacity could reach 5,000 MW (4.5 GW) if investment trends continue, quadrupling the current size.

India data center capacity current vs plannedIndia data center capacity current vs planned

The country has drawn about US$15 billion in investments from 2020 to 2025. It expects another US$20–25 billion over the next five years.

Several trends explain this rapid growth. More people and businesses are using cloud computing, storing data online, streaming video content, and deploying AI-based tools.

Government initiatives, data-localization rules, and infrastructure growth have made India a great place for large-scale data centers. Technologies like AI, machine learning, IoT, and 5G need strong computing power and fast networks. This drives the demand for solid infrastructure.

Rising demand, supportive policies, and lower costs have made India appealing. Adani, Google, and others are making big investments. This shows they believe the country will grow its data center ecosystem over the next ten years.

What Makes the Adani–Google Project Significant

The collaboration between AdaniConneX and Google stands out for several reasons. The project is large. A 1 GW data center campus is one of the biggest in the country. This shows India’s ability to handle major AI workloads.

The plan focuses on sustainable energy and infrastructure. It includes renewable power, high-capacity transmission lines, and energy storage systems. These elements are key to powering energy-heavy AI computing while reducing environmental impact.

Gautam Adani, chairman of the Adani Group, said:

“The Adani Group is proud to partner with Google on this historic project that will define the future of India’s digital landscape. This is more than just an investment in infrastructure.”

This initiative is also likely to stimulate the local economy. Large data center projects require support services, ranging from construction and technical work to energy production and telecommunications. A major tech hub can create thousands of jobs. It also attracts more companies, building a cluster of innovation and digital skills.

Some of the benefits include:

  • Creation of technical and construction jobs, along with supporting roles in energy and networking.
  • Development of renewable energy and battery storage infrastructure to support reliable operations.
  • Attraction of other tech companies and startups seeking access to AI-ready computing facilities.

By building this kind of ecosystem, India is moving from being a consumer of technology to becoming a provider of global digital infrastructure.

India’s data center landscape is dominated by a mix of global and local operators. According to S&P Global, CtrlS, Nxtra (Bharti Airtel), NTT, and AdaniConneX are among the largest players by IT-load capacity.

Largest datacenter operators in India
Sources: S&P Global Market Intelligence 451 Research; S&P Global Commodity Insights. © 2025 S&P Global.

These companies excel at creating hyperscale and enterprise-grade facilities. They often exceed tens of megawatts for each campus. Their investments boost total capacity and promote advanced technologies like AI, cloud services, and edge computing. This helps India become a competitive hub for digital infrastructure.

Looking Ahead: India as a Global AI Backbone

If current plans and forecasts are realized, India’s data center landscape in 2030 could look very different from today. 

S&P Global estimates that data center electricity consumption was about 13 TWh by end‑2024. That’s roughly 0.8% of India’s total electricity demand. But with the projected expansion, electricity demand from data centers could rise nearly fivefold — to about 57 TWh by 2030. This means data centers could account for around 2.6% of the country’s total electricity demand by 2030.

Datacenter growth will drive power demand from 2024 to 2030

This expansion underscores why investments like the Adani–Google AI campus, with its 1 GW scale and renewable energy focus, are critical for meeting future demand.

The S&P report further notes that most data centers currently use grid electricity, much of which comes from coal. However, there is potential to meet future demand with renewable energy.

S&P says that India will need “15–30 GW of additional renewable capacity” in the next five years to meet data center demand. They think this is doable since India has a lot of untapped renewable resources.

As infrastructure expands, India may become a hub not only for domestic AI and cloud workloads but also for international clients. This includes large data centers that can support big AI models and cloud computing for businesses.

The availability of local high-performance computing could encourage startups, research institutions, and multinational companies to base operations in India, rather than relying on overseas servers.

Global Context: Data Center Growth and Regional Trends

India’s growth fits within a broader global trend. Worldwide, demand for data centers continues to rise, driven by cloud services, AI, machine learning, and IoT. Hyperscale data centers and colocation facilities are growing fast. This trend is especially strong in North America, Europe, and the Asia-Pacific region.

North America leads with its strong infrastructure and big hyperscale operators. However, the Asia-Pacific is the fastest-growing region now. Countries in this region, including India, are building capacity quickly to keep up with rising demand.

By 2030, the Asia-Pacific region might match North America in influence and infrastructure. This shift could change where AI-ready data centers are located globally.

Partnerships That Shape the Future of Computing

The Adani-ConneX and Google partnership marks a turning point for India. The project builds one of the largest AI-ready data center campuses in the country. This shows a shift from just using digital services to becoming a global infrastructure provider.

This transformation will affect more than technology companies. It will create jobs, stimulate renewable energy development, strengthen local economies, and encourage innovation in AI and computing. India is positioning itself to be not only a home for digital users but a builder of the technology that powers the world.

The post Adani Pledges $5 Billion for Google’s AI Data Center in India appeared first on Carbon Credits.

Walmart and Kellanova Partner for Regenerative Rice Farming in Arkansas

Walmart and Kellanova Partner for Regenerative Rice Farming in Arkansas

Walmart, Kellanova, and Indigo Ag formed a new partnership to help rice farmers in Arkansas. Their goal is to make farming more profitable and better for the environment. These companies plan to support farmers by giving them training, digital tools, and extra payments for using regenerative agriculture methods.

Walmart has already worked with Indigo Ag to support cleaner and more sustainable farming. With Kellanova now joining, the program will reach more farmers and cover more rice-growing areas. The hope is that farmers can earn more money while using practices that protect their land for the future.

What Is Regenerative Agriculture?

Regenerative agriculture is a way of farming that helps restore soil health, conserve water, and support biodiversity. Instead of relying only on heavy chemical inputs, this approach works with nature to grow crops. Farmers might use methods like:

  • crop rotation,
  • careful water management, and
  • soil-restoring techniques.

This type of farming can help soil store nutrients and moisture better. That improves crop stability even when the weather gets tough. Over time, regenerative farms may need less fertilizer and water.

Globally, interest in regenerative agriculture is rising. The market for regenerative agriculture services — like soil testing, consulting, and sustainable farming tools — is growing quickly. A recent industry forecast estimates strong growth through 2030, $18.3 billion at 15-20% annual growth.

regenerative agriculture market
Source: Mordor Intelligence

This growth reflects a shift among food companies, farmers, and investors toward sustainable supply chains and climate-smart farming.

Arkansas Rice: A Big Deal for U.S. Farming

Arkansas leads U.S. rice production. In 2024, the state’s rice growers harvested about 1.432 million acres at a record yield of 7,640 pounds per acre. That production made up 49.3% of all U.S. rice output.

Rice is one of the top three crops in Arkansas in terms of money earned by farmers. It also supports thousands of jobs in rural communities.

But rice farming has become harder lately. Many Arkansas farmers face economic pressure. Input costs such as fertilizer, fuel, and irrigation have gone up.

At the same time, rice market prices have weakened. Some estimates show significant losses per acre for long-grain rice in such conditions. This economic squeeze makes support and innovation more urgent.

The New Partnership and What It Offers 

The companies involved — Walmart, Kellanova, and Indigo Ag — plan to help Arkansas rice farmers move to regenerative agriculture. Under this approach, farms receive guidance, tools, and extra pay when they follow certain sustainable practices.

Farmers joining the program get help with soil, water, and crop management. They also get payments (a “premium”) for rice grown under these sustainable practices. That extra pay helps cover the risks and costs of changing farming methods.

Moreover, sustainable farming practices are shown to lower the industry’s carbon emissions. The initiative is projected to reduce 35,500–8,000 metric tons based on acreage adoption.

regenerative agriculture and carbon reductions

Why the Timing Is Important

The new partnership comes at a time when Arkansas rice farmers face major economic challenges. Rising costs for fuel, fertilizer, and water make farming more expensive. Meanwhile, global rice prices remain under pressure because of large supplies from abroad. These conditions reduce profits and increase risks for farmers.

In that context, the support from Walmart, Kellanova, and Indigo Ag may help stabilize farm incomes. The premium payment offers an extra financial cushion while farmers transition to sustainable practices.

Also, a move to regenerative farming may increase long-term resilience. Healthier soil and better water management can help farms survive extreme weather — a growing concern in climate change.

Mikel Hancock, Senior Director, Strategic Initiatives, Sustainability at Walmart, stated:

“We are excited to see our regenerative agriculture goals becoming a reality. Expanding our partnership with Indigo Ag to include Kellanova reflects the scale of impact we can achieve by working together to strengthen supply chains, support farmers, and advance environmental stewardship.”

Walmart’s Sustainability and Environmental Initiatives

Walmart has been actively pursuing sustainability across its global operations. The company plans to achieve net-zero emissions by 2040. It has invested in renewable energy, energy-efficient stores, and low-emission logistics. This powers over 50% of its operations with renewable energy. It also aims to source 100% of its electricity from renewables in the U.S. and around the world when possible.

Walmart teams up with suppliers to cut greenhouse gas emissions in its supply chain. They focus on reducing Scope 3 emissions. One key effort is Project Gigaton, which aims for suppliers to lower CO₂e by one billion metric tons by 2030.

walmart emissions 2024
Source: Walmart

The company also promotes sustainable sourcing, including responsible agriculture, forestry, and seafood programs. The recent partnership with Kellanova and Indigo Ag is an example. These efforts show Walmart’s commitment to protecting the environment and ensuring a strong supply chain for the future.

Kellanova and Indigo Ag: Driving Sustainable Agriculture

Kellanova and Indigo Ag are both actively advancing sustainable practices across the food and agriculture sectors. The Pringles producer aims to lower its environmental impact. It does this by sourcing responsibly, reducing waste, and improving energy efficiency in its supply chain.

The company is focused on cutting greenhouse gas emissions. It also seeks to use more sustainable ingredients in its products, which aligns its work with larger climate goals.

Janelle Meyers, Chief Sustainability Officer, Kellanova, said:

“Our Kellanova Better Days™ Promise aims to advance sustainable practices and mitigate the impacts of climate change—but we know we can’t achieve our goals without our partners. By joining forces with Indigo Ag and Walmart, we’re creating agricultural resiliency that increases farmer revenues, advances climate-smart practices, and drives long-term, systemic impact across the value chain.”

Indigo Ag works directly with farmers to implement climate-smart and regenerative agriculture practices. The programs focus on improving soil health, saving water, and cutting carbon emissions. They also aim to boost farm profits.

The agritech firm uses digital tools and technical support to measure and verify environmental benefits. This gives farmers and buyers confidence in the supply chain’s sustainability.

indigoag carbon credits Carbon by Indigo
Source: Carbon by Indigo

Indigo partners with big retailers like Walmart, which helps scale initiatives for lower-carbon, resilient farming. These efforts benefit farmers, communities, and the environment.

Dean Banks, CEO of Indigo Ag, remarked:

“Together, we are building prosperity from the ground up: safeguarding water resources, improving soil health, reducing emissions, and supporting farmers.”

What This Means for the Future of Farming

This partnership among Walmart, Kellanova, and Indigo Ag shows a deeper shift in agriculture. Instead of just growing more crops, they aim to grow crops sustainably.

For farmers in Arkansas, it could mean a better future: a more stable income, healthier farms, and less risk. For companies, it offers a more dependable supply chain, while for communities and the environment, it offers a chance at long-term sustainability.

As demand grows for sustainable and responsibly grown food, regenerative agriculture may move from niche to mainstream. We could see growing interest, more investments, and wider adoption, not just for rice, but for other crops too.

This partnership could create a future where farming, business, and the environment work together, benefiting farmers, consumers, and the land.

The post Walmart and Kellanova Partner for Regenerative Rice Farming in Arkansas appeared first on Carbon Credits.

Vale–Glencore Sudbury Venture Aims to Unlock 880,000-Ton Copper Volume for North America

Vale Base Metals (VBM) and Glencore Canada took a major step toward expanding North America’s copper supply. The two companies signed an agreement to study a new brownfield copper project in the Sudbury Basin, one of Canada’s most important mining regions. The plan focuses on using Glencore’s Nickel Rim South Mine infrastructure to safely and efficiently reach underground copper deposits owned by both companies.

Shaun Usmar, CEO of Vale Base Metals, further explained the project. He noted,

“Opportunities to partner and unlock synergistic value between neighbouring miners in the Sudbury Basin have been pursued for decades, without meaningful success. I’m grateful for the commitment shown by both Glencore and our VBM team for coming together to finally unlock this historic opportunity by demonstrating a new collaborative way of working.

“The contemplated partnership paves the way to extract valuable copper-rich orebodies for our respective operations that would otherwise be lost to both companies. The proposed 50-50 joint venture aims to leverage Glencore’s unused infrastructure to access orebodies on both our properties. This will benefit our respective companies, our local communities in and around Sudbury, and it has the potential to produce nearer-term critical minerals from this prolific brownfield project for the Canadian economy. My hope is it will be a catalyst to unearth further synergies in the region.”

A Project That Unlocks Untapped Resources

The agreement allows both companies to examine how they can mine their adjacent copper deposits through Glencore’s current mine shaft. Instead of building a new shaft from scratch, they intend to deepen and extend the existing one. This approach reduces environmental impacts, shortens construction timelines, and avoids the major capital expenses associated with greenfield developments.

The partners estimate the project will deliver about 880,000 metric tons of copper over 21 years. The total investment is expected to fall between $1.6 billion and $2 billion USD. Given the strong demand for copper and the tight supply, the timing of this plan aligns well with the current market.

At Glencore’s Capital Markets Day presentation, held on Wednesday, 3 December 2025, in the UK, CEO Gary Nagle commented:

“Since our last Capital Markets Day in 2022, we have made significant progress on de-risking our exceptional portfolio of copper projects. These projects are mostly brownfield and expected to be highly capital efficient. We have a clear pathway for our base copper business to exceed 1 million tonnes of annual production by the end of 2028, with a target to produce c. 1.6 million tonnes by 2035, which would make Glencore one of the largest copper producers in the world. We have already taken key steps on this journey, including the submission of our Argentinian RIGI applications in August and our decision to restart the Alumbrera copper/gold operation in Argentina which we are announcing today.”

COPPER DEMAND
Source: IEA

Sudbury’s Rich Mix of Critical Minerals

Since the Sudbury Basin contains a mix of valuable minerals, the project would also produce nickel, cobalt, platinum group metals (PGMs), gold, and other critical materials. These metals are important for batteries, renewable power systems, and global clean-energy supply chains.

The companies plan to begin detailed engineering work in 2026. This phase will include environmental assessments, community consultations, and technical design studies. A final investment decision is set for the first half of 2027.

If approved, the new operation would not only unlock ore that could have remained untouched but also support long-term planning for both companies’ Canadian mining portfolios.

Notably, Vale’s broad global network of operations gives it significant experience in complex underground mining. And that strengthens the Sudbury partnership.

Sustainable Mining Gains Ground Through Brownfield Strategy

The partners’ decision to build on existing infrastructure reduces the environmental footprint of the project. Brownfield developments generally require fewer land disturbances, lower water use, and smaller construction areas than brand-new mines. This approach fits well with growing expectations for sustainable mining practices in Canada and worldwide.

Economically, the project could create high-quality jobs in Sudbury and support local businesses. Because the region has a long history of mining, the community already has a strong workforce, training programs, and service ecosystem that can support new developments.

The initiative also supports Canada’s Critical Minerals Strategy, which aims to secure domestic supplies of materials needed for clean energy technologies. Copper, nickel, and cobalt are at the heart of that effort.

Canada and the U.S. Expand Their Copper Capacity

Copper is becoming even more important as renewable energy, electric vehicles, and power grid upgrades expand worldwide. The metal is also vital for semiconductor manufacturing and military equipment. Significantly, Canada already holds strong copper resources, especially in Ontario, and continues to grow as a major contributor to global supply.

Additionally, a more stable domestic supply reduces reliance on foreign mineral supply chains for both Canada and the U.S.

Meanwhile, the United States is also preparing for major growth. U.S. copper production is projected to reach 1,077 kilotonnes in 2025, an increase of nearly 2% from the previous year. By 2030, new large-scale projects could push the U.S. into the global top five copper-producing nations. By 2035, output may more than double to over 2 million tonnes per year.

copper output US

Copper Prices Stay Strong in 2025

As per Trading Economics, Copper prices rose above $5.20 per pound, reaching a four-month high. The increase followed a record peak on the London Metal Exchange due to lower output in Chile, planned Chinese smelter cuts, and a weaker U.S. dollar.

Since late August, copper has climbed about 13% on the LME amid supply shortages. Traders also boosted shipments to the U.S. to take advantage of high Comex prices, while uncertainty over future tariffs added extra market pressure.

Because of this price environment, the Vale-Glencore collaboration appears especially timely. High prices offer a strong economic case for unlocking new supply from brownfield sites like Sudbury and supporting long-term market stability.

copper prices
Source: Trading Economics

Unlocking Copper to Power a Cleaner Future

Overall, the planned Sudbury project reflects a shift in mining strategy as companies look for smarter, lower-impact ways to increase critical mineral supply. By using existing assets, Vale and Glencore can reach valuable copper deposits faster, reduce costs, and strengthen North America’s mineral independence.

As demand rises for clean energy technologies and electrification, projects like this will play a major role in supporting economic growth, energy security, and the global transition to a low-carbon future.

If the joint venture moves forward after the 2027 investment decision, the Vale-Glencore partnership could become one of the most important copper developments in Canada—helping power everything from EVs to renewable grids for years to come.

The post Vale–Glencore Sudbury Venture Aims to Unlock 880,000-Ton Copper Volume for North America appeared first on Carbon Credits.

Lithium’s Surge: Why Global X Lithium & Battery Tech ETF (LIT) Is Outperforming NVIDIA Stock in 2025

lithium

Disseminated on behalf of Surge Battery Metals Inc.

In an unprecedented turn for 2025, the Global X Lithium Battery Tech ETF (LIT) has surged ahead as a standout performer, eclipsing even traditional tech giants like NVIDIA. With lithium increasingly seen as a foundational material driving the clean energy transition, LIT’s year-to-date returns have soared, outpacing NVIDIA and spotlighting the essential role of lithium in global decarbonization efforts. Lithium’s real-world impact is reshaping transportation and energy infrastructure, establishing it as the backbone of electric vehicles (EVs), renewable energy storage, and advanced battery technologies.

Investor priorities are changing. Policy makers, corporate leaders, and major funds are focusing on domestic lithium production, battery innovation, and secure critical mineral supply chains in response to skyrocketing global demand. Electric vehicle adoption and grid-scale energy storage set new records, pushing the lithium value chain into the spotlight and attracting increasing capital from those eyeing long-term sustainability and tech-driven value.

As of December 03, 2025, the Global X Lithium & Battery Tech ETF (LIT) traded near $63, showing +57.23% growth in lithium and battery supply chain sectors since the start of 2025. Nvidia (NVDA) stock traded at around $180, up about 30% year-to-date. This gap reflects rising confidence in lithium as a key material for our energy shift. Unlike tech stocks that focus on digital trends, lithium drives real changes in transport and energy. Investors see lithium as vital for a low-carbon economy.

Performance Comparison: LIT ETF Vs NVDA Stock vs LIT ETF

NVDA stock and LIT ETF performance comparison

LIT covers a wide part of the lithium value chain. It includes major miners like Ganfeng Lithium Group, Albemarle, and Lithium America, battery makers like Tesla, CATL, etc., and firms focused on advanced energy storage. Even though lithium demand has soared, lithium ETFs skyrocketed after the White House revealed plans to take a stake in Lithium Americas.

However, the gap between LIT and NVIDIA shows a growing awareness of lithium’s role in clean energy. NVIDIA symbolizes digital progress, while LIT reflects the energy shift driving electrification and clean tech.

Next, we’ll explore LIT’s growth drivers, trends in lithium supply and demand, and investor interest in lithium stocks.

LIT ETF’s Unique Exposure

Global X Lithium & Battery Tech ETF (LIT) tracks the entire lithium value chain. It includes companies in mining, refining, chemical processing, battery cell production, and advanced battery technology. This ETF provides diversified exposure to a fast-growing market, unlike investing in a single company. This variety allows LIT to benefit from both raw material demand and battery innovation, positioning it well for long-term growth.

The fund’s structure offers stability. Individual stocks can be volatile due to earnings reports or regulations. By investing across the supply chain, LIT reduces risk and taps into the electrification trend. This mix of breadth and depth has helped LIT outperform traditional tech leaders in 2025.

lithium demand supply price

A Boom in Lithium Demand

The main driver of LIT’s success is rising lithium demand. Lithium powers lithium-ion batteries found in everything from EVs to home energy systems and grid storage.

IEA says that global EV sales in 2025 are set to reach around 20 million units, breaking records. Thus, the EV boom is reshaping the lithium market, with electric cars now making up nearly 90% of lithium use worldwide.

EV sales
Source: Katusa Research

This demand surge isn’t just from more vehicles. Battery packs are growing larger for longer ranges and faster charging. Each new EV requires more lithium than older models. Additionally, the rapid growth of stationary energy storage boosts lithium use further.

Grid-scale battery installations exceeded 90 gigawatt-hours (GWh) in 2024, with annual growth rates above 30% expected in the coming years. These batteries store energy from renewable sources and release it during peak demand, making lithium crucial for a renewable future.

The combination of EV adoption and grid storage creates a strong, multi-layered growth story for lithium. Investors increasingly view lithium as a key part of global clean energy infrastructure.

Lithium Supply Dynamics and Technological Innovation

While demand is rising, lithium supply struggles to keep pace. Mining and refining require significant capital, long permits, and strict environmental compliance. Many major lithium deposits are concentrated in specific areas, adding geopolitical risks.

lithium economics

  • These supply constraints have kept lithium prices high, with battery-grade lithium carbonate expected to be around $9,250 in 2025.

Emerging technologies are reshaping the supply landscape. Direct Lithium Extraction (DLE) is gaining attention for its efficiency and sustainability. DLE extracts lithium from brine or geothermal sources using less water and causing less land disturbance. Companies using DLE can produce a higher-purity product faster than with traditional methods. For ESG-focused investors, DLE represents a greener way to boost production.

Companies in LIT’s portfolio are adopting these technologies and securing strategic supplies. Lithium Americas, a major holding, recently acquired a 59% stake in the Thacker Pass lithium project in the U.S. through a government initiative. This highlights the importance of domestic lithium sources amid global supply uncertainties.

lithium carbonate prices

Market Sentiment and Investment Trends

Investor enthusiasm for lithium stocks and ETFs has surged with global clean energy efforts. Governments are promoting domestic lithium production, supporting EV adoption, and funding battery manufacturing. The U.S., European Union, and China have ambitious plans to secure critical battery materials.

Analysts at Albemarle and other top lithium producers predict that global lithium demand could more than double by 2030, reaching up to 3.7 million tonnes of lithium carbonate equivalent (LCE).

Lithium demand forecast
Source: Katusa Research

This long-term outlook attracts both retail and institutional investors wanting to join the clean energy transition. LIT offers a liquid, diversified way to tap into this growth without relying on a single company.

The rising focus on lithium aligns with broader trends in sustainable investing. Markets favor assets linked to real decarbonization strategies and infrastructure projects. Lithium, as a backbone for EVs and energy storage, fits this narrative well.

Comparing LIT and NVIDIA (NVDA Stock) Performance in 2025

NVDA stock remains a standout performer, driven by its leadership in AI chips, data centers, and autonomous vehicle tech. Analysts see growth potential and have set high price targets for 2025. However, NVIDIA faces challenges like competition from new chipmakers and pricing pressures. While the stock is strong, its growth depends on digital and AI trends rather than energy transformation.

LIT, in contrast, thrives on real shifts in energy and transport systems. While NVIDIA represents the digital revolution, LIT embodies the energy revolution. Lithium’s key role in EVs and storage gives the ETF unique exposure to a megatrend likely to continue. This explains why LIT has outperformed major tech leaders in 2025.

Risks and Challenges

Investing in lithium comes with risks, even with strong prospects. Supply chain delays, regulatory issues, and changes in battery technology can affect demand. These factors may reduce lithium’s role in batteries. Companies in LIT require continuous capital investment to grow, which can impact profits. Price swings in lithium markets can also threaten stability for cautious investors.

Still, strong growth in EV adoption and energy storage, along with supportive policies and tech advances, provides a solid foundation for continued lithium demand.

Lithium as a Strategic Investment Theme

LIT ETF’s 2025 jump shows a broader investment shift. Lithium has evolved from a niche material to a vital part of the clean energy economy. In 2025, LIT is expected to outperform top tech stocks, making it a strong investment opportunity today.

Apart from ETFs, another way to gain exposure to the lithium theme is through Surge Battery Metals (TSXV: NILI | OTCQX: NILIF). The company’s flagship asset, the Nevada North Lithium Project (NNLP) in Elko County, Nevada, hosts the highest-grade lithium clay resource currently reported in the United States.

NNLP surge battery metals
Source: Surge Battery Metals

According to its latest resource estimates, NNLP holds an Inferred Resource of 11.24 million tonnes of lithium carbonate equivalent (LCE) grading 3,010 ppm Li at a 1,250 ppm Li cut-off, according to its latest mineral resource estimate.

This high-grade claystone deposit positions NNLP as a potential future source of domestic lithium for electric vehicles and energy storage, as the Company now advances the project toward Pre-Feasibility, including ongoing economic studies, technical work, and permitting.

This grade makes NNLP the highest-grade lithium clay resource currently reported in the United States.

RELATED:

  1. Nevada Lithium Hub: Why Surge Battery Metals Holds the Key to U.S. EV Independence
  2. America’s Lithium Gap: How Surge Battery Metals Could Bridge the Supply Shortfall

DISCLAIMER 

New Era Publishing Inc. and/or CarbonCredits.com (“We” or “Us”) are not securities dealers or brokers, investment advisers, or financial advisers, and you should not rely on the information herein as investment advice. Surge Battery Metals Inc. (“Company”) made a one-time payment of $50,000 to provide marketing services for a term of two months. None of the owners, members, directors, or employees of New Era Publishing Inc. and/or CarbonCredits.com currently hold, or have any beneficial ownership in, any shares, stocks, or options of the companies mentioned.

This article is informational only and is solely for use by prospective investors in determining whether to seek additional information. It does not constitute an offer to sell or a solicitation of an offer to buy any securities. Examples that we provide of share price increases pertaining to a particular issuer from one referenced date to another represent arbitrarily chosen time periods and are no indication whatsoever of future stock prices for that issuer and are of no predictive value.

Our stock profiles are intended to highlight certain companies for your further investigation; they are not stock recommendations or an offer or sale of the referenced securities. The securities issued by the companies we profile should be considered high-risk; if you do invest despite these warnings, you may lose your entire investment. Please do your own research before investing, including reviewing the companies’ SEDAR+ and SEC filings, press releases, and risk disclosures.

It is our policy that information contained in this profile was provided by the company, extracted from SEDAR+ and SEC filings, company websites, and other publicly available sources. We believe the sources and information are accurate and reliable but we cannot guarantee them.


CAUTIONARY STATEMENT AND FORWARD-LOOKING INFORMATION

Certain statements contained in this news release may constitute “forward-looking information” within the meaning of applicable securities laws. Forward-looking information generally can be identified by words such as “anticipate,” “expect,” “estimate,” “forecast,” “plan,” and similar expressions suggesting future outcomes or events. Forward-looking information is based on current expectations of management; however, it is subject to known and unknown risks, uncertainties, and other factors that may cause actual results to differ materially from those anticipated.

These factors include, without limitation, statements relating to the Company’s exploration and development plans, the potential of its mineral projects, financing activities, regulatory approvals, market conditions, and future objectives. Forward-looking information involves numerous risks and uncertainties and actual results might differ materially from results suggested in any forward-looking information. These risks and uncertainties include, among other things, market volatility, the state of financial markets for the Company’s securities, fluctuations in commodity prices, operational challenges, and changes in business plans.

Forward-looking information is based on several key expectations and assumptions, including, without limitation, that the Company will continue with its stated business objectives and will be able to raise additional capital as required. Although management of the Company has attempted to identify important factors that could cause actual results to differ materially, there may be other factors that cause results not to be as anticipated, estimated, or intended.

There can be no assurance that such forward-looking information will prove to be accurate, as actual results and future events could differ materially. Accordingly, readers should not place undue reliance on forward-looking information. Additional information about risks and uncertainties is contained in the Company’s management’s discussion and analysis and annual information form for the year ended December 31, 2024, copies of which are available on SEDAR+ at www.sedarplus.ca.

The forward-looking information contained herein is expressly qualified in its entirety by this cautionary statement. Forward-looking information reflects management’s current beliefs and is based on information currently available to the Company. The forward-looking information is made as of the date of this news release, and the Company assumes no obligation to update or revise such information to reflect new events or circumstances except as may be required by applicable law.

The post Lithium’s Surge: Why Global X Lithium & Battery Tech ETF (LIT) Is Outperforming NVIDIA Stock in 2025 appeared first on Carbon Credits.

CDR Companies Challenge SBTi Draft—Say It Could Make Net-Zero ‘Impossible’

CDR

The carbon dioxide removal (CDR) industry has raised a strong red flag. As per reports, a new open letter, signed by 55 buyers and stakeholders across the permanent carbon removals value chain, calls on the Science Based Targets initiative (SBTi) to revise key parts of its draft Corporate Net-Zero Standard Version 2.0. The signatories warn that if the current language remains unchanged, it could slow or even prevent companies from reaching true net-zero.

This joint action, led by the Nordic Carbon Removal Association, follows SBTi’s decision to open a second public consultation on November 6. The consultation runs until December 12. As a result, companies, experts, and climate groups now have a short window to shape the final version of the world’s most influential private-sector net-zero framework.

CDR Stakeholders Say Draft Rules Create Uncertainty

The CDR industry believes the draft standard sends the wrong signal. They warn that the current wording creates confusion about whether permanent carbon removals can count toward neutralizing residual emissions. Without clarity, companies may struggle to finish their net-zero journey.

  • The concern centers on two parts of the draft: the rules on double counting and corresponding adjustments, and the additionality language in Annex E.

According to the signatories, these sections ignore the realities of permanent removal projects. Many projects rely on public funding. Many also fall under national climate targets. If SBTi does not allow companies to use removals that also appear in national inventories, corporate investment could collapse.

This uncertainty makes it harder for companies to plan ahead. It also raises costs. In some cases, it could make net-zero impossible. Therefore, the signees urge SBTi to revise the language and give companies confidence that high-quality removals remain valid tools for neutralization.

Permanent Removals Need Space to Grow

The letter argues that SBTi’s draft does not accurately reflect the challenges of scaling permanent removals. Today, only a few projects have reached the Final Investment Decision (FID) stage. Most needed is heavy government support. Private buyers often commit early to help these projects advance. However, these buyers will hesitate if SBTi casts doubt on future eligibility.

Climate scientists, including Johan Rockström, have stressed that the world must scale permanent CDR rapidly to stay on track for 1.5°C. Yet this scale-up depends on strong public-private partnerships. These partnerships often use co-funding models and a dual-ledger system that allows both companies and nations to count climate outcomes. This model already works for emission reductions. The CDR community argues it must also apply to removals.

Some critics worry that corporate involvement might weaken national ambition. The open letter rejects this concern for permanent removals. These removals are expensive and complex. When companies invest, they actually raise ambition.

Their involvement brings more projects, more learning, and more durable tonnes. It also frees governments to direct public funds to other climate needs. Therefore, the CDR sector believes co-funding strengthens, not weakens, climate action.

CDR market

SBTi Tries to Improve Clarity—But Falls Short on Removals

SBTi designed the updated draft to improve clarity and credibility. It asks companies to link near-term actions to long-term climate goals. It also expects companies to publish transition plans and maintain separate targets for Scope 1 and Scope 2 emissions. Moreover, SBTi aims to give companies more flexibility by recognizing that sectors and regions face different challenges. The draft introduces a recognition mechanism for early action on ongoing emissions. It also sets stronger expectations for transparency.

However, the CDR community argues that these improvements lose impact if the draft restricts permanent removals. Companies need clear rules. They also need confidence that investments in high-durability removals will help them meet net-zero targets. If SBTi creates barriers, companies may fall short even after making major decarbonization efforts.

Additionally, the open letter urges SBTi to acknowledge the importance of dual-ledger accounting. Allowing both nations and companies to count the same climate outcomes would boost demand and support faster growth. It would also create a stable market signal for investors. Without this flexibility, the permanent CDR sector could stall just as it begins to scale.

David Kennedy, Chief Executive Officer at the Science Based Targets initiative, said:

“Businesses are driving global decarbonization, and will be key to achieving our climate objectives. Taking science-based action both reduces emissions and manages transition risks, maintaining competitiveness and offering growth opportunities in a carbon-constrained world. By contributing to our public consultation stakeholders can help shape the future of corporate climate action and ensure the Standard helps companies to turn ambition into action, and action into impact.”

cdr purchases

What Comes Next for the Net-Zero Framework

The next steps will shape how thousands of companies plan their climate pathways. SBTi’s final standard will influence how businesses cut emissions, choose climate tools, and invest in removals. If SBTi responds to the concerns raised, the permanent removals industry could grow faster. Companies would also gain more confidence in the tools they need to balance unavoidable emissions.

But if SBTi keeps the restrictive language, many firms may face shrinking options for meeting net-zero. This could slow climate progress at a critical time.

Both sides agree on a key reality: emissions reductions alone are not enough. Permanent carbon removals must play a role. The question now is how to build a standard that protects scientific credibility while still supporting the growth of essential climate technologies.

The post CDR Companies Challenge SBTi Draft—Say It Could Make Net-Zero ‘Impossible’ appeared first on Carbon Credits.

Tesla at a Crossroads: Sales Slump Meets Regulatory Headwinds But Stock Rises, Why?

Tesla at a Crossroads: Sales Slump Meets Regulatory Headwinds But Stock Rises, Why?

Tesla, long seen as the flagship of electric vehicles (EVs), is now facing two related challenges at once. On one side is the weakening of sales in the U.S. market. On the other is the rising concern that regulatory changes abroad could affect EV demand. These pressures could challenge Tesla’s resilience and strategy. They show that even industry leaders face changing market forces and policy uncertainties.

U.S. Sales Hit a New Low — But Q3 Shows Strength

Tesla’s U.S. deliveries fell to 39,800 vehicles in November 2025, marking the lowest monthly total for the company so far this year. This slump follows a high point in August 2025, when Tesla sold about 55,500 vehicles in a single month.

Over the first eight months of 2025, sales totaled 337,079 vehicles, roughly 24% fewer than in the same period in 2024. This drop signals that consumer demand is softening, despite earlier rebounds.

However, looking at Tesla’s global figures provides a more complete picture. In Q3 2025, the company delivered 497,099 vehicles worldwide, a 7.4% increase compared with the same quarter in 2024. This growth was partly driven by U.S. tax credit expirations that encouraged buyers to act before incentives ended.

  • Tesla earned over $28 billion in global revenue in Q3. This is a 12% increase from last year. It shows that the company is financially strong, even with changes in regional sales.

Despite these positive global trends, U.S. inventory levels are a concern. As of early December 2025, about 10,799 Tesla vehicles were waiting to be sold. While this is higher than the low points earlier in the year, it signals a potential oversupply risk.

If demand does not pick up, Tesla may need to adjust production or introduce new incentives to prevent inventory from piling up.

Competition is also intensifying. U.S. EV market share remains around 10%, but Tesla is facing stronger challenges from Ford and GM hybrids. These competitors have been steadily increasing their presence in the EV and hybrid segments. This could limit Tesla’s growth in its biggest market.

Tesla Quarterly U.S. EV Sales (Units)

The U.S. case shows that even a leading EV manufacturer must constantly adapt to market dynamics and competitor strategies.

Europe’s Regulatory Headwinds: Policy Pressure Mounts

Tesla’s challenges are not confined to the U.S. In Europe, the situation is uneven, with regulatory uncertainty adding pressure.

Tesla’s European sales continued to struggle in November 2025. Vehicle registrations dropped 58% in France to 1,593 units and 49% in Denmark to 534 units compared to the same month a year earlier.

In Denmark, the Model Y fell 74% to 206 units, while the Model 3 rose 29% to 326 units, making it the country’s eighth best-selling vehicle. These figures reflect growing competition in Europe and a challenging market environment for Tesla.

In the United Kingdom, Tesla has warned policymakers about potential changes to the Zero Emission Vehicle (ZEV) mandate, as reported by The Guardian.

The proposal under review aims for 28% EV sales by 2027, but it is facing delays due to industry pushback. Tesla says that weakening these rules might slow EV adoption. It could make battery-electric vehicles less appealing and hurt climate goals. The company stated that changes will: 

“suppress battery electric vehicle (BEV) supply, carry a significant emissions impact and risk the UK missing its carbon budgets.”

Germany reveals a similar trend. Tesla’s sales in Germany have declined sharply. Year-to-date sales in 2025 totaled only 17,358 vehicles. That’s nearly half of what the company sold in the same period last year. November 2025 alone saw a 20.2% drop compared with November 2024.

Meanwhile, the broader German EV market has grown steadily, and competitors such as BYD have gained market share. BYD’s cheaper models are grabbing consumer attention. This shows that Tesla faces not just regulatory issues but also growing competition in Europe.

This gap between markets highlights an important point for Tesla. Regulatory signals and local market conditions now greatly influence performance.

Europe used to be a strong growth area for Tesla, but now demand is slowing. Competitors are taking advantage of changes in pricing and policy. Tesla must adapt its strategy to address these regional differences while maintaining global competitiveness.

Still, the chart below shows that the Tesla Model Y is the top-selling EV in the region from January to October 2025. 

top selling EVs in Europe
Source: CleanTechnica

China Shines: Tesla’s Bright Spot

China remains a strong market for the EV maker, showing resilience despite weaknesses in other regions. In November 2025, Tesla’s China-made EV sales rose 10% year-over-year to 86,700 units. This growth contrasts with BYD, whose new energy vehicle (NEV) sales fell 5.3% to 480,186 units.

Tesla’s strong performance in China comes from high demand for cars made at its Shanghai factory. The launch of new model variants has also helped.

Global EV trends also highlight China’s dominant position. More than half of all new cars sold in China are now electric. In contrast, the U.S. lags at 10%, and Europe is showing signs of cooling.

This imbalance emphasizes the importance of China in Tesla’s growth strategy. Success in the Chinese market is critical not only for revenue but also for sustaining global market momentum.

Strategic Moves: Energy Storage and Diversification

Tesla is taking steps to mitigate these pressures. One important area is energy storage. In Q3 2025, Tesla deployed 12.5 GWh of storage capacity, including both commercial and home battery systems. These products provide a buffer against volatility in auto sales, allowing Tesla to diversify revenue sources and strengthen its long-term resilience.

Notably, investors recently sent Tesla’s stock up after reports that the U.S. government may soon push a major expansion of the robotics industry. Shares rose about 1%. This was due to growing hope that support for robotics and automation could help Tesla beyond just car sales.

Tesla stock

This matters because the company is positioning itself as more than a carmaker. It’s also a tech-driven firm focused on robotics, artificial intelligence, and autonomous driving systems. The stock rise shows that investors are hopeful. They believe investments in robots, software, and self-driving services can help Tesla offset weak demand for traditional cars.

Implications for EV Adoption and Climate Goals

Tesla’s challenges are part of a larger story for the EV market. Weak sales in major regions could slow the transition to low-emission transport. Regulatory rollbacks, like the UK’s possible easing of the ZEV mandate, could lead automakers to keep selling petrol and diesel cars.

Investors may become more cautious, reducing support for EV infrastructure, production, and innovation if market signals remain unpredictable. Policymakers, automakers, and consumers must remain aligned to sustain momentum in electrification. Without steady incentives, clear rules, and ongoing consumer adoption, the move to EVs might slow down. This can happen even if the technology and business case are solid.

Navigating an Uncertain Road Ahead

The EV giant is facing a crossroads. U.S. sales are slowing, Europe is showing uneven performance, and regulatory uncertainty could affect future adoption.

Whether Tesla recovers — or whether the EV transition slows — depends less on product features or brand name and more on broader economic conditions, government policy, and consumer confidence. The company’s ability to adapt its strategy, balance production, and diversify revenue streams will be critical in the coming months.

For the company and the EV industry as a whole, this is a defining moment: how Tesla responds could shape the future of electric mobility globally.

The post Tesla at a Crossroads: Sales Slump Meets Regulatory Headwinds But Stock Rises, Why? appeared first on Carbon Credits.