
ChatGPT vs. Gemini: Who Leads the AI Race and at What Environmental Cost?

The battle between OpenAI’s ChatGPT and Google’s Gemini is one of the most talked-about stories in technology today. These two artificial intelligence (AI) chatbots dominate the market for generative AI tools. They power smart responses, summaries, writing help, and more.
As users and businesses rely on AI more, questions about market competition and environmental impacts have grown. This article compares the two leaders in terms of market share, energy use, carbon footprint, and water consumption to give a clear picture of where the AI landscape stands in 2026.
Market Share: Where ChatGPT and Gemini Stand
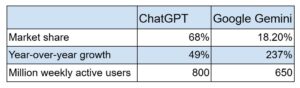
As of early 2026, ChatGPT still leads the AI chatbot market. ChatGPT has around 68% of the market share based on visits and user interactions. This is less than its previous dominance.
In comparison, Google Gemini accounts for about 18.2% of the market share, showing rapid growth over the past year. This shift marks a major change in how users choose AI tools worldwide.
ChatGPT has maintained a large user base with around 800-900 million weekly active users and billions of monthly visits. But Gemini is also growing fast. Its user numbers have increased as Google adds it to more services.
Other AI platforms, such as DeepSeek, Grok, Perplexity, and Claude, hold smaller shares of the market but are growing in niche areas. ChatGPT and Gemini lead the global chatbot market. This shows a duopoly trend, with two main players in control.
The market positions of ChatGPT and Gemini reflect their different strategies. OpenAI built ChatGPT as a standalone AI platform with powerful language skills. It became popular early and gained millions of users quickly.
Google, meanwhile, embedded Gemini into search engines, Android devices, and other Google apps. This gives Gemini a wide reach, helping it grow faster in recent years as users encounter it automatically.
For users, this means choice. Some prefer ChatGPT’s deep text-generation and creative outputs. Others choose Gemini for quick answers tied to search and Android use.
As both platforms grow, competition will likely push innovation in AI quality, safety, and usefulness. And for climate-conscious and environmentalists, this means taking a closer look at the platforms’ growing energy use, carbon emissions, and water use.
AI’s Energy Footprint: Data Centers and Electricity
As AI use expands rapidly, the energy footprint of the technology has become an important topic. AI models like ChatGPT and Gemini run on large networks of servers housed in data centers. These facilities use electricity to power computing tasks and to keep equipment cool.
In 2024, data centers used around 415 terawatt-hours (TWh) of electricity. This is about 1.5% of the world’s total electricity consumption. AI workloads are a growing part of this total.
- The International Energy Agency predicts that data center electricity use may double to around 945 TWh by 2030.
This increase comes as AI and other digital services grow. Another research shows the same trend:

AI electricity use varies by task. Training large models—such as initial versions of GPT and other deep learning systems—can consume very large amounts of power. For example, training early large language models used tens of gigawatt-hours of electricity.
- Running the model for user queries (called inference) uses much less energy per request but occurs far more frequently.
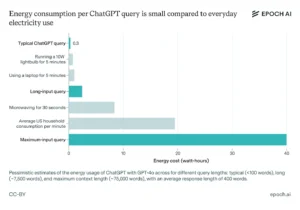
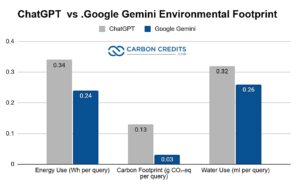
In a direct comparison of per-prompt energy use, Google found that a typical Gemini text prompt consumes about 0.24 watt-hours (Wh) of electricity. This is roughly equivalent to the energy used by a small household device running for a few seconds.
ChatGPT queries, on the other hand, use about 0.34 Wh of electricity. That’s similar to running a lightbulb for a short time. This makes per-query energy costs relatively low but still significant when scaled to billions of daily uses. Over time, improvements in hardware and software have greatly reduced energy and carbon use per prompt.
Carbon in the Cloud: Emissions of AI Systems
Carbon emissions from AI are tied closely to electricity use. Where the electricity comes from—renewable sources versus fossil fuels—greatly affects emissions. Data centers powered by coal or gas produce more carbon than those using wind, solar or hydroelectric power.
Global AI and data centers are currently responsible for a small but growing share of carbon emissions. Combined data center emissions contribute to the broader trend of digital technologies impacting climate change.
Projections show that by 2035, AI’s carbon footprint may vary greatly. This depends on future energy mixes and how AI is deployed. Estimates suggest possible annual emissions ranging from 300 to 500 million tonnes of CO₂ by the mid-2030s. The exact share attributable to AI specifically will vary based on how much AI workloads grow within overall data center use.
ChatGPT and Google’s Gemini differ in their carbon footprints per query. A typical ChatGPT query generates about 0.15 grams of CO₂ per text prompt. In comparison, a typical Google Gemini query emits around 0.03 grams of CO₂ per prompt. This means Gemini’s per-query carbon footprint is about five times lower than ChatGPT’s based on current estimates.
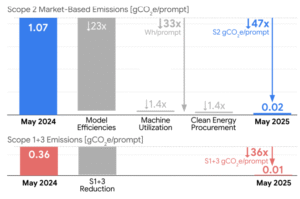
Both companies promise to cut carbon intensity. They plan to do this by improving data center efficiency, buying renewable energy, and upgrading hardware.
For example, Google reported dramatic reductions in energy and carbon footprints for Gemini queries over a one-year period due to efficiency gains and cleaner energy sourcing.
Cooling Costs: Water Use in AI Data Centers
Water consumption is another environmental concern for AI because data centers use water for cooling. Keeping servers cool in large facilities often requires water-cooled systems, especially in warmer climates.
Global AI-related water withdrawal has been rising. Estimates suggest that AI data centers might use 4.2–6.6 billion cubic meters per year by 2027, which is equivalent to 4.2–6.6 billion tonnes of water. This amount is similar to the yearly water use of medium-sized countries.
At the individual query level, water use is very small. For example, OpenAI’s CEO has stated that a single ChatGPT query uses about 0.000085 gallons of water (or ~0.32 ml)—a tiny amount comparable to a few drops. But at scale, with billions of queries each day, total water demand becomes significant in the context of data center cooling systems.
Google’s data reveals that a typical Gemini text prompt uses about 0.26 milliliters of water. That’s about the same as a few drops, considering data center operations.
The Bigger Picture: AI’s Environmental Footprint
AI’s environmental footprint extends beyond individual models and queries. Data centers are expanding rapidly because of increased AI adoption and other online services. Data center electricity use might reach almost 3% of global demand by 2030. This growth highlights the importance of sustainable practices in the tech industry.
While per-query energy and carbon figures can seem small, the aggregate impact of billions of daily AI interactions adds up. Power use and cooling needs can stress local energy grids and water supplies. This happens if companies don’t use renewable sources and efficient technologies.
Major tech companies have made public commitments to use renewable energy and improve energy efficiency at data centers. Experts say that real transparency in environmental impacts needs better reporting. It also requires standardized metrics throughout the AI industry.
So, Who Wins the AI Race?
In the AI chatbot market, ChatGPT continues to lead with about 68% market share in 2026, while Google’s Gemini holds approximately 18.2% and is growing fast. Their competition reflects differences in strategy, reach, and integration into broader technology ecosystems.
On environmental performance, both AI systems contribute to energy use, carbon emissions, and water consumption through data centers. Per-query measurements such as 0.24–0.30 Wh of electricity and tiny amounts of water per request show that individual impacts are small.
However, the aggregate resource use of running AI at scale is significant and growing. Global demand for electricity in data centers is expected to rise sharply by 2030. Water use might also increase as AI adoption expands.
Understanding these footprints and market dynamics helps users, developers, and policymakers see the costs and benefits of AI. AI tools like ChatGPT and Gemini will keep changing tech markets. They will also influence talks about sustainability in our digital world.
- MUST READ: AI Drives a Transformative Wave in Global Data Centers – and Energy Is the Real Bottleneck
The post ChatGPT vs. Gemini: Who Leads the AI Race and at What Environmental Cost? appeared first on Carbon Credits.
Bain & Company Inks First Direct Air Capture Carbon Removal Deal With Oxy’s 1PointFive

Bain & Company and Oxy’s 1PointFive announced a new agreement for direct air capture carbon removal credits. Under the deal, Bain & Company will purchase 9,000 metric tons of carbon dioxide removal (CDR) credits over three years. The credits will come from direct air capture (DAC) technology developed by 1PointFive at its large STRATOS facility in Texas.
This deal marks an important step in how companies address climate change by removing carbon dioxide (CO₂) directly from the air. It also highlights the increasing importance of advanced technologies that pull CO₂ from the air and store it permanently.
How DAC Removes CO₂ from the Atmosphere
Direct Air Capture is a type of technology that pulls CO₂ out of the atmosphere. A machine uses fans and chemical processes to separate CO₂ from the air. Once CO₂ is removed, it is compressed and stored so that it will not return to the atmosphere. This process is a form of carbon dioxide removal that targets emissions already in the air, rather than preventing new emissions at the source.
The CO₂ captured by DAC can be stored deep underground in rock formations. This process is called geologic sequestration. It is one of the most secure ways to keep CO₂ out of the atmosphere for long periods of time.

Direct air capture differs from other carbon strategies like energy efficiency, renewable energy, or planting trees. DAC can take out carbon that’s already in the air. The technology focuses on removing existing carbon, unlike other methods that reduce future emissions or naturally capture some carbon. This helps address what scientists call “hard-to-abate” emissions.
Inside the Bain & Company Carbon Removal Agreement
Bain & Company has taken a significant step in its climate strategy through a new agreement with 1PointFive. This is Bain’s first purchase of carbon removal credits from direct air capture technology, which shows its increasing commitment to innovative carbon solutions.
Key points of the agreement include:
- Total Credits: 9,000 metric tons of CO₂ to be removed.
- Timeframe: Delivered over three years.
- First DAC Purchase: Bain’s initial engagement with direct air capture technology for carbon removal.
- Climate Strategy Alignment: Supports Bain’s goal to maintain a net-negative carbon impact each year.
- Emissions Offset Visualization: The 9,000 metric tons of CO₂ are equivalent to the emissions from about 10,000 long-haul round-trip flights for one economy-class passenger.
Sam Israelit, Bain’s Chief Sustainability Officer, said:
“We are proud to partner with 1PointFive and add them to our portfolio of engineered carbon removal technologies. Their track record for developing DAC technology coupled with their deep understanding of what it takes to deliver large-scale infrastructure projects uniquely positions them to be a leader in this emerging segment.”
STRATOS and the Scale-Up of Engineered Carbon Removal
1PointFive is a carbon capture, utilization, and sequestration (CCUS) company. It is a subsidiary of Occidental Petroleum (Oxy). 1PointFive aims to scale direct air capture tech. This will help remove CO₂ from the atmosphere at commercial levels.
The carbon credits that Bain will purchase are produced by the STRATOS facility. This plant is a large DAC installation in Ector County, Texas. Once fully operational, STRATOS is expected to be one of the largest DAC facilities in the world. It is designed to remove up to 500,000 metric tons of CO₂ per year when fully running.
STRATOS is still in a start-up phase. It hasn’t started full commercial operations yet. However, it’s moving through initial testing and ramp-up activities.
The CO₂ captured at the DAC facility will be stored underground through geologic sequestration. This means the carbon will be injected into deep rock formations where it stays permanently.
Why Carbon Removal Credits Are Gaining Corporate Attention
Carbon removal credits are becoming more important for businesses. Each credit shows that one metric ton of CO₂ has been removed from the air and stored safely. Companies can buy these credits to offset emissions they cannot reduce through normal operations.
Key reasons why carbon removal credits are important for companies:
- Offset emissions: Helps companies balance emissions they cannot cut directly.
- Supports climate goals: Companies can invest in removal technologies while aiming for net-zero or net-negative targets.
- Long-term impact: Credits help firms create lasting, innovative ways to cut atmospheric carbon. Direct air capture is one such technology that grows in use as firms seek durable solutions.

CDR purchases are growing by 750% from 2022 to 2023, and 2024 volumes are exceeding prior years. Analysts project the CDR market could expand from about $3.4 billion in 2024 to $25 billion by 2029.
Durable engineered CDR credits, including DAC, alone may generate over $14 billion by 2035. By 2030, annual demand for durable CDR credits could reach up to 100 million tonnes of CO₂ because of corporate climate targets and emerging policies.

By buying removal credits, companies can manage their carbon footprint while investing in climate technologies that have a real, measurable effect on the atmosphere.
What This Means for Bain & Company’s Climate Goals
For Bain & Company, this agreement aligns with its established climate commitments: net zero across value chains by 2050. Bain has pledged to maintain a net-negative carbon footprint annually.

To achieve this, it aims to reduce emissions and invest in credible carbon removal solutions. The 9,000 metric tons of direct air capture credits will help offset Bain’s leftover operational emissions. These emissions are what remain after all possible reductions.
The company has invested in high-integrity carbon removal credits before. They have supported over 1.1 million metric tons of removal credits from different technologies in the last five years. This indicates Bain’s long-term engagement with carbon removal beyond this new agreement.
By adding DAC-enabled credits from STRATOS, Bain aligns its portfolio with advanced engineered removal methods. These methods are often seen as more durable and reliable in the long run than some natural removal methods.
A Signal for the Carbon Removal Market
The market for carbon removal and carbon credits has grown rapidly. Companies from many industries are purchasing removal credits as part of climate strategies.
In 2023 and 2025, 1PointFive made deals with big companies to buy carbon removal credits. These include deals with major firms such as Amazon and JPMorgan Chase for 250,000 and 50,000 metric tons of CDR credits, respectively. These deals show the rising global interest in DAC-enabled carbon removal.
Carbon removal credits also play a role in voluntary carbon markets. These markets allow companies to buy credits to offset emissions beyond regulatory requirements. As more firms commit to climate goals, demand for high-quality removal credits grows.
The Future of Direct Air Capture and Carbon Removal Credits
The agreement between 1PointFive and Bain & Company reflects a broader trend in climate action. More businesses are using tech-driven carbon removal in their climate plans. As DAC projects like STRATOS scale up, removal credits may become more widely available and standardized.
As companies build portfolios of carbon removal credits, technologies like DAC may play a larger role in global efforts to limit climate change. Experts believe that removing CO₂ from the atmosphere will be necessary alongside rapid emission cuts to meet climate goals.
A boom in DAC credit agreements like the 1PointFive and Bain & Company’s deal may reflect this emerging reality. As the world faces the challenge of reducing atmospheric CO₂ levels, partnerships like this show how the private sector can contribute to climate mitigation through innovative technology and long-term strategies.
The post Bain & Company Inks First Direct Air Capture Carbon Removal Deal With Oxy’s 1PointFive appeared first on Carbon Credits.
U.S. Court Clears the Air: Ørsted’s Offshore Project Gets Green Light
A major win for U.S. offshore wind came on January 13, 2026, when a U.S. District Court overturned a Trump-era block on Ørsted’s Revolution Wind project. The ruling allows the Danish energy giant to resume full operations immediately. Ørsted shares rose 5–5.5%, reflecting strong investor confidence in the U.S. clean energy sector. The 704 MW project off Rhode Island will provide renewable electricity to around 350,000 homes.
Ørsted’s Shares Soar with Legal Win
The press release explained that the court acted swiftly after Ørsted challenged the Bureau of Ocean Energy Management’s (BOEM) stop-work order, originally issued in August 2025, over national security concerns. A preliminary injunction in September 2025 had temporarily paused the halt. Today’s ruling clears all barriers, calling the stop-work order likely unlawful and highlighting the serious harm to the project if work remained suspended.
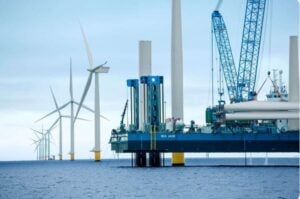
Construction now resumes with a target of full operation by Q2 2026, despite earlier delays caused by soil cleanup at Quonset Point. The decision demonstrates how courts can check executive actions that threaten renewable energy development. BOEM’s 2023 approvals, including the Construction and Operations Plan (COP), had already authorized 65 Siemens Gamesa 11 MW turbines on monopile foundations in federal lease OCS-A 0486.
- The ruling now ensures Rhode Island stays on track for 100% renewable electricity by 2033 and supports Connecticut’s offshore wind goal of 2,000 MW by 2030.
Following the announcement, Ørsted’s shares jumped 5.37%, reaching 134.45 DKK in early European trading, up from 127.65 DKK, signaling strong market approval of the project restart.

READ MORE: Offshore Wind Shock: Trump Administration Hits Pause Citing National Security Risks
Revolution Wind: Key Facts
Revolution Wind sits about 15 nautical miles southeast of Point Judith, Rhode Island, covering 83,798 acres in the Rhode Island/Massachusetts Wind Energy Area. Submarine cables connect the farm to the Davisville substation at Quonset Business Park, supplying 400 MW to Rhode Island through National Grid and 304 MW to Connecticut via Eversource and United Illuminating.
Power purchase agreements (PPAs) lock in electricity rates of 9.8–10 cents per kWh for 20 years, helping stabilize costs and cut emissions. Ørsted leads the project alongside Skyborn Renewables, a Global Infrastructure Partners firm, after Eversource exited in 2024.
The total investment exceeds $5 billion, including $100 million each for manufacturing hubs in Connecticut and Rhode Island and $35 million for Quonset logistics. The project supports 1,200 direct jobs and thousands of indirect roles.
Revolution Wind Project
Economic Impact and Job Creation
The court’s ruling boosts local economies. ProvPort ramps up turbine production, creating 125 union jobs, while Quonset Point’s $35 million hub adds crew vessels and the U.S.’s first offshore wind helicopter base. Connecticut’s $310 million State Pier redevelopment supports heavy turbine lifts.
Financially, the project benefits from IRA incentives and RECs, with National Grid expecting $4.6 million over 20 years, while Ørsted’s stock rises on renewed market confidence.
Environmental Benefits and Mitigation Measures
Revolution Wind reduces fossil fuel use and helps Rhode Island meet its climate goals under the Act on Climate. The “Aligned Grid” turbine layout reduces wake losses and coordinates with nearby projects like South Fork Wind. Monopile foundations disturb less seabed than jacket structures, while cables are buried 4–6 feet deep.
Agencies like NMFS, USACE, and EPA require safeguards, including seasonal pile-driving pauses for North Atlantic right whales, vessel speed limits, and noise-reduction measures. The project sets aside $12.9 million to compensate fisheries, $5.3 million for studies and contingency funds, and consults tribes through BOEM’s ERIF program. Continuous monitoring ensures adaptive protection of marine life.
Implications for U.S. Offshore Wind
The court’s decision reverses setbacks from 2025, including a Trump executive order halting new offshore leases. Revolution Wind’s development reflects 15 years of planning—from 2011 site calls to 2023 approvals—with the first turbine installed in September 2024. It is the first U.S. offshore wind farm spanning multiple states.
The project boosts the blue economy by establishing ProvPort and State Pier as East Coast offshore wind hubs. Carbon reduction is significant: 704 MW of renewable energy offsets millions of tons of CO₂ each year. Ørsted’s expertise positions it for further U.S. expansion.
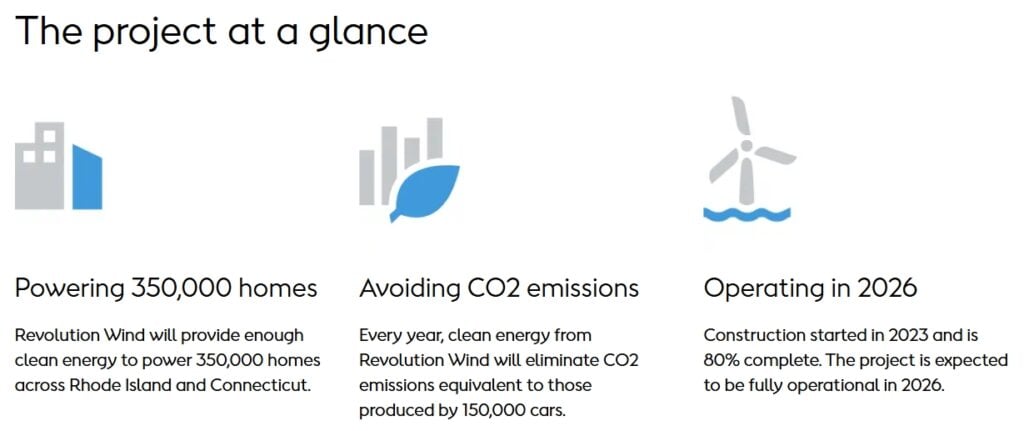
Looking ahead, the ruling could accelerate permitting, attract private investment, and stabilize policy for the sector. Jobs in clean energy will grow, local supply chains will expand, and emissions will drop—key factors for ESG investors and carbon markets.
However, challenges remain. Visual impacts, FAA aviation markings, and EPA air permits require ongoing attention. Fisheries and tribal groups raise legitimate concerns, underlining the need for balanced, responsible development. With full operation expected in Q2 2026, Revolution Wind demonstrates how courts, regulators, and developers can align for sustainable growth in U.S. offshore wind.
The post U.S. Court Clears the Air: Ørsted’s Offshore Project Gets Green Light appeared first on Carbon Credits.
Alphabet (Google) Surpasses Apple in Value: But How About Their Climate Ambitions and Progress?

Alphabet, parent company of Google, has overtaken Apple to become the world’s second‑most valuable company. Alphabet’s market value reached about $3.9 trillion, while Apple’s was around $3.85 trillion.
This shift highlights Alphabet’s rapid growth in AI and technology and invites a look at how these two tech giants compare in their efforts on sustainability and climate goals.
Alphabet Ascends, Passing Apple in the Tech Race
Alphabet has surpassed Apple in market value, with nearly $3.9 trillion, while Apple’s was about $3.85 trillion. Nvidia remains the most valuable company, at over $4.5 trillion.
This is the first time Alphabet has held the number‑two spot since 2019. The change shows how fast values can shift among the largest tech companies.
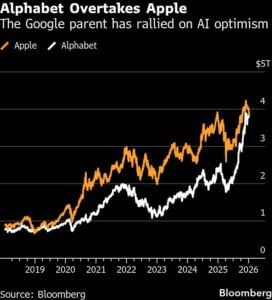
Alphabet’s rise reflects strong investor confidence in its broad technology portfolio. The company has made large strides in AI with tools like its Gemini model and investments in custom hardware.
Apple, by contrast, has seen slower adoption of some AI innovations in its devices, which has affected investor sentiment. The companies’ stocks also show contrasting movements, with Google’s jumping and Apple’s tumbling.
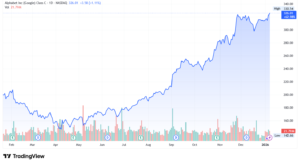
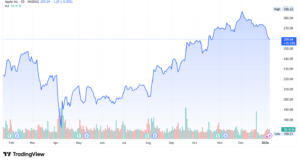
Market Shake-Up: Why Numbers Matter
Market capitalization is a measure of a company’s value. It equals the total value of all the company’s shares. Being ranked second in market value means Alphabet is now larger than Apple by this measure. This does not necessarily mean Apple is weaker as a company. It simply reflects how investors value each company’s growth prospects today.
Market positions can change over time. A company’s value can rise or fall with earnings, technology breakthroughs, and market trends. In this case, Alphabet’s strong performance in AI and advertising helped it move ahead of Apple in the rankings. But how do the two compare in terms of their sustainability and net-zero efforts?
Green Ambitions: Big Tech’s Climate Playbook
Beyond market value, both Alphabet and Apple have made public commitments to sustainability. These commitments focus on reducing carbon emissions, using renewable energy, and supporting environmental efforts.
Both big tech companies say they are working to lower their impact on the planet. However, their approaches and progress differ in some ways. Let’s take a closer look at how each company tackles its carbon footprint.
Apple’s Measurable March to Net-Zero
Apple has set detailed, long‑term goals for reducing its environmental impact. The company aims to become carbon neutral across its entire business, manufacturing supply chain, and product life cycle by 2030. This goal means that Apple plans for its products and operations to have net‑zero greenhouse gas emissions by that year.

The tech giant has already made significant progress toward this goal. It has reduced its global greenhouse gas emissions by more than 60% compared with its 2015 baseline. This reduction reflects energy efficiency, cleaner electricity use, and other improvements in how products are made and shipped.
Apple’s 2030 strategy prioritizes reducing emissions by 75% before using carbon removal projects for the remainder. The company’s global supply chain now has 17.8 gigawatts of renewable electricity in operation.
The renewable energy procured by Apple suppliers helped avoid about 21.8 million metric tons of greenhouse gas emissions in 2024. In addition to clean energy, many of Apple’s semiconductor and display suppliers have pledged to reduce potent fluorinated greenhouse gases by at least 90 percent by 2030.

Apple also uses more recycled and renewable materials in its products. For example, a recent MacBook Air contains over 55% recycled materials, the highest percentage in any Apple device. Suppliers participating in Apple’s Zero Waste program redirected around 600,000 metric tons of waste from landfills in 2024.
In addition, Apple and its suppliers have saved more than 90 billion gallons of fresh water since launching their Supplier Clean Water Program in 2013. In 2024 alone, they saved 14 billion gallons through reuse and conservation efforts.
All of these efforts support Apple’s 2030 carbon neutrality goal, and they include reducing emissions and investing in cleaner materials, water conservation, and waste reduction.
- SEE MORE: Apple Stock (AAPL) Goes Green: 14,000-Acre California Forest Deal Advances Carbon Neutral Strategy
Alphabet’s Broad-Stroke Climate Push
Alphabet has also made public climate commitments. The company has a goal to reach net‑zero emissions across its operations and value chain by 2030. This goal includes supporting 24/7 carbon‑free energy where feasible. Alphabet reports emissions and tracks progress in its annual Environmental Report.
Alphabet has worked to use more renewable energy and improve energy efficiency at its offices and data centers. It has also taken steps to reduce emissions from transportation and offer tools to help customers measure and cut emissions.

The company reported a 12 % reduction in data center energy emissions in 2024, even though total energy demand has risen due to AI and data center growth. It also procured over 8 GW of clean energy in 2024, the most in any year.
Alphabet replenished about 4.5 billion gallons of water and outlined products that helped others reduce an estimated 26 million metric tons of emissions.
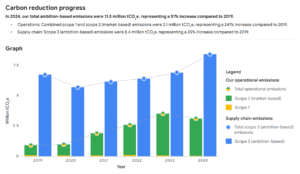
However, Alphabet’s overall emissions have increased in recent years because of rapid AI growth and higher electricity use. Reported ambition‑based emissions rose 11 % in one year and are about 51 % higher than in 2019, driven in part by the energy needs of AI infrastructure.
READ MORE:
- Alphabet, Google’s Parent, Bets $4.75B on Clean Power for AI Data Center Demand
- Google’s $20B Deal with Intersect Power and TPG Rise: How Can It Transform Data Centers?
Apple vs Alphabet: Who Leads on Green?
Both Apple and Alphabet are among the world’s largest technology companies. Both have made public commitments to tackle climate change, use renewable energy, and pursue emission reductions.
A key difference is how detailed and measurable some goals are. Apple has published numerical progress toward several targets, such as its 60 % emission reduction and 17.8 GW of renewable energy in its supply chain. Its 2030 goal is backed by specific steps in product design, materials use, and energy sourcing.
Alphabet, while also committing to net‑zero by 2030, emphasizes broader goals across its operations and value chain. It reports efforts in energy efficiency and green electricity, but has seen rising emissions in recent years, and its public metrics focus more on aspirational goals than on absolute emissions reductions.
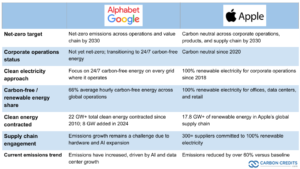
Independent research into the environmental impact of big tech suggests that large technology firms together contribute a measurable share of global greenhouse gas emissions. Their data centers and supply chains use large amounts of energy, making renewable energy and efficiency improvements key to future progress.
Why Green Strategy Shapes Tech Giants: Big Tech, Bigger Responsibility
Large tech companies have significant environmental footprints. Their products are used by billions of people, their data centers run around the clock, and their supply chains stretch across many countries. Because of this, their choices on energy use, materials sourcing, and emissions can influence broader trends in corporate sustainability.
Investors, customers, and regulators are increasingly focused on these issues. Companies with clear and transparent climate strategies may attract investors who value long‑term environmental performance.
Workers and consumers may prefer companies that show real progress toward sustainability. These factors can affect a company’s reputation and market value over time.
Alphabet’s rise past Apple in market value marks a major shift in the tech industry. While it now ranks second in global market capitalization behind Nvidia, both Alphabet and Apple remain leading technology players.
As large tech companies grow in size and influence, their climate and sustainability strategies will continue to shape industry standards and affect investor and consumer expectations. Achieving ambitious environmental targets remains complex, but both Alphabet and Apple have signaled a long‑term commitment to reducing their impact on the planet.
- FURTHER READING: Top 4 Clean Tech Companies to Watch in 2026
The post Alphabet (Google) Surpasses Apple in Value: But How About Their Climate Ambitions and Progress? appeared first on Carbon Credits.
How Standard Chartered’s €1 Billion Green Bond Is Scaling Climate Finance in Emerging Markets

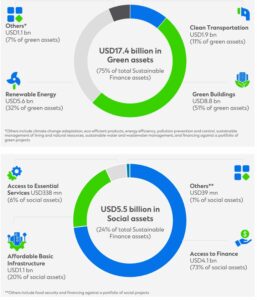
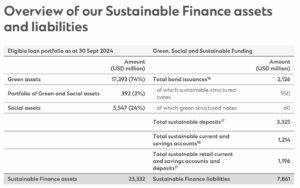
The post How Standard Chartered’s €1 Billion Green Bond Is Scaling Climate Finance in Emerging Markets appeared first on Carbon Credits.
What Happens Next as Trump Withdraws U.S. From Major Global Climate Agreements?

The United States announced it would leave several major international climate agreements and scientific organizations. This includes pulling out of the United Nations Framework Convention on Climate Change (UNFCCC), reducing involvement with the Intergovernmental Panel on Climate Change (IPCC), and ending participation in dozens of other international groups. This is one of the biggest changes in U.S. climate diplomacy in recent years.
The decision has drawn strong reactions from governments, scientists, and environmental groups worldwide. Leaders and experts are discussing how this decision will impact global climate cooperation, scientific research, and long-term climate action.
What Was Announced: The Scope of the U.S. Withdrawal
On January 7, 2026, the Trump administration released a memo. It ordered the country to pull out of 66 international organizations. This includes key climate bodies like the UNFCCC and the IPCC.
The UNFCCC is a treaty adopted in 1992 to help countries work together on climate change. Almost every country in the world is part of it. The treaty supports frameworks such as the Paris Agreement.
The IPCC is not a treaty but a UN scientific group that reviews climate research. Countries participate by sending scientists, attending meetings, and helping fund their work. U.S. withdrawal means Washington will no longer take a full part in these activities. The memo reads:
“I (Pres. Trump) have considered the Secretary of State’s report and, after deliberating with my Cabinet, have determined that it is contrary to the interests of the United States to remain a member of, participate in, or otherwise provide support to the organizations listed in section 2 of this memorandum.”
The White House said these organizations “no longer serve American interests.” Officials said the move is part of a plan to focus on national priorities over international agreements.
Treaties, Science, and Authority: Legal and Procedural Questions
The UNFCCC became effective in 1994 after ratification by countries, including the United States. Under its rules, a country can leave, but the process can take time and may face legal challenges.
The U.S. has already left the Paris Agreement twice in the past decade. Under Executive Order 14162, President Trump’s administration started the withdrawal from the Paris Agreement, effective in January 2026.
Because the Paris Agreement is part of the UNFCCC, leaving the UNFCCC also ends U.S. obligations under the Paris Agreement framework.
Some legal experts note that the U.S. Constitution sets rules for international agreements. Critics of the withdrawal say the president may not have full authority to leave a treaty without Congress. This could lead to court cases.
The Roles of the UNFCCC and IPCC
The UNFCCC helps countries work together to reduce emissions and adapt to climate change. Countries report greenhouse gas emissions each year. They also meet yearly at the Conference of the Parties (COP) to set climate goals.
The Paris Agreement sets targets to limit global warming. It aims to keep the temperature rise “well below 2°C” above pre-industrial levels and to try to limit it to 1.5°C.
The IPCC produces reports that summarize global climate research. Governments and international organizations use these reports to make policy decisions.
Without formal participation, the U.S. government won’t negotiate climate rules as a full member. It also won’t help shape scientific reports.
Global Response and Reactions
Many governments and climate leaders reacted quickly.
The UN climate chief called the decision a “colossal own goal” that could hurt U.S. economic opportunities and climate preparedness. Further, Jake Schmidt of the Natural Resources Defense Council said in an interview:
“It’s critical the United States is a participant in and is actively trying to reduce climate change — it’s the world’s largest economy, the world’s biggest historical emitter.”
European Union officials said the move is “regrettable” and emphasized that they will continue international climate work, per the European Commissioner for Climate Action Wopke Hoekstra. Meanwhile, Vice-President Teresa Ribera stated:
“The White House does not care about the environment, health, or human suffering.”
Environmental and science groups warned that leaving climate institutions could hurt global cooperation. It may also cut funding for poorer countries.
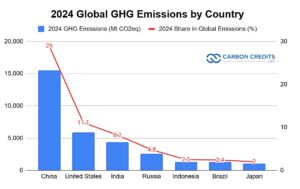
Critics also note that the U.S. is one of the world’s largest greenhouse gas emitters. It is, in fact, the second-biggest emitter in 2024. It produced over 11% of global CO2 emissions, as shown below.
What This Means for Global Climate Action
The U.S. has played an important role in global climate work. As a major economy and emitter, it has helped set global goals, reporting rules, and funding for developing countries.
With the U.S. withdrawing, climate negotiations will continue but without American influence in formal treaty processes. Other countries, like the EU and China, are expected to take leading roles.
For science, the IPCC will continue producing reports, but U.S. government scientists may be less involved. Private researchers and universities can still take part independently.
Money and Markets: Climate Finance at a Crossroads
International climate finance helps countries reduce emissions and adapt to climate change. Funds such as the Green Climate Fund and the Global Environment Facility receive some money from rich countries, like the U.S.
Leaving these bodies could make funding less predictable, at least temporarily. This may affect projects in developing countries, such as clean energy development and climate resilience programs.
In 2024, the United States gave about $11 billion each year in international public climate finance under the former Biden administration. This funding helped developing countries reduce emissions and adapt to climate impacts. It made up around 8% of global climate finance that year. This figure shows a big jump from past years. It grew from about $1.5 billion in 2021 to over $9.5 billion in 2023. By 2024, it reached $11 billion.
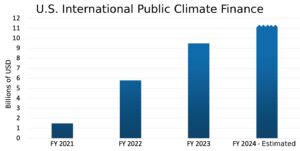
However, recent policy changes canceled the U.S. International Climate Finance Plan. The U.S. contributed to both bilateral and multilateral programs. It also pledged $3 billion to the Green Climate Fund. However, future payments may be uncertain due to recent policy changes.
Market analysts also note that climate policies, standards, and carbon markets guide clean energy investments. Without the U.S., these frameworks might change. This could impact global energy markets and corporate strategies.
What Happens Next?
Withdrawal from treaties like the UNFCCC takes time and may face legal challenges in U.S. courts or Congress. Some experts expect court cases over whether the president can leave treaties ratified by the Senate alone.
Meanwhile, countries will continue climate talks and prepare for future COP meetings. U.S. states, cities, and private businesses may also increase climate cooperation outside the treaty system. However, the U.S. government’s role in guiding global science and policy through the IPCC and UNFCCC will be smaller during the withdrawal.
Trump’s decision to leave the UNFCCC, reduce engagement with the IPCC, and exit other international bodies is a major change in global climate policy. Even though the U.S. remains a major economy and emitter, its role in shaping global climate agreements and scientific reports has been greatly reduced.
The full effects of these moves will unfold over the coming years as climate negotiations continue and countries adjust to a new international landscape.
- READ MORE: U.S. to Cancel $13 Billion in Green Energy Funds: Implications for Climate Policy and Industry
The post What Happens Next as Trump Withdraws U.S. From Major Global Climate Agreements? appeared first on Carbon Credits.
Microsoft–MISO AI Partnership Sets Path for Smarter, Cleaner US Electricity Grid

Microsoft’s (MSFT) strategic partnership with the Midcontinent Independent System Operator (MISO) marked a major shift in how the US power grid adapts to rising electricity demand. Announced on January 6, 2026, the collaboration brought artificial intelligence and cloud computing directly into grid operations.
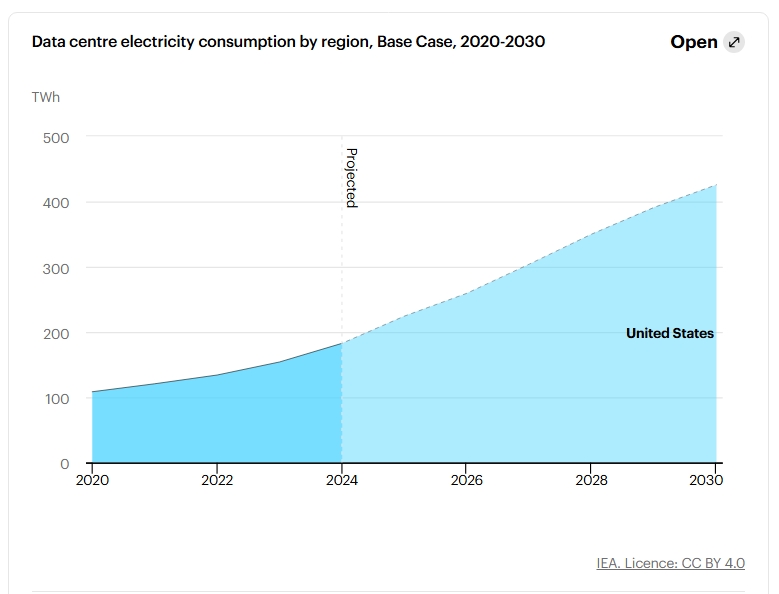
As per IEA, US data centers consumed about 183 terawatt-hours (TWh) of electricity in 2024. That represented more than 4% of total US power use. AI workloads continue to push that number higher. Thus, the goal was clear: prepare the grid for explosive growth from data centers, electrification, and clean energy—without sacrificing reliability or climate goals.
MISO’s Grid Faces a New Era of Relentless Demand Growth
MISO operates one of the largest power systems in North America. It serves about 42 million people across 15 US states and the Canadian province of Manitoba. At peak times, the grid handles around 127 gigawatts of electricity.
That scale now faces unprecedented strain. AI-driven data centers, electric vehicles, heat pumps, and industrial electrification are pushing electricity demand higher. MISO’s interconnection queue already holds more than 350 gigawatts of proposed new generation—most of it wind, solar, and storage. Legacy planning tools struggle to keep pace with evolving needs.
Extreme weather adds another layer of risk. Heatwaves, cold snaps, and storms test grid reliability just as renewable output fluctuates. At the same time, delays in transmission approvals slow the connection of clean energy projects.
MISO has made progress. It approved roughly $22 billion in long-term transmission investments, designed to support up to 120 gigawatts of new resources. Wind and solar already hit record levels, including a new solar peak in early 2025. Still, aging infrastructure and fragmented data systems limit how fast the grid can evolve.
This is where Microsoft comes into play.
How Microsoft’s AI and Cloud Tools Change Grid Operations
The partnership centers on building a unified data platform using Microsoft Azure and Foundry AI. Instead of siloed systems, MISO gains a single, secure environment to analyze grid conditions in near real time. And the impact shows up across operations.
Better Forecasting and Planning
AI models improve long-term transmission planning. They simulate how wind, solar, storage, and demand growth interact across seasons and weather scenarios. This helps MISO plan lines that reduce congestion, limit curtailment, and avoid overbuilding fossil backup power.
Faster, Smarter Reliability Decisions
Machine learning tools detect abnormal grid conditions earlier. During extreme weather, AI helps operators diagnose problems and respond faster. MISO already tested similar tools during winter events, where they improved market efficiency and system coordination.
Easier Collaboration and Innovation
Microsoft tools like Power BI and Microsoft 365 Copilot allow teams to visualize data and share insights quickly. Analysts spend less time cleaning data and more time solving problems. This speeds up innovation and supports faster decision-making as conditions change.
Together, these upgrades turn the grid from a reactive system into a predictive one.
Data Centers Are Reshaping US Electricity Demand
EIA’s data shows demand rose to around 200 TWh in 2025 and can surpass 250 TWh in 2026. By 2030, consumption could double or even triple, reaching 426 TWh or more. Hyperscalers like Microsoft drive much of this growth.
This surge reversed a long-standing trend. From 2010 to 2020, US electricity generation declined slightly each year. Since 2021, growth returned. Generation rose about 2% annually and is expected to increase by 2.4% in 2025 and 1.7% in 2026.
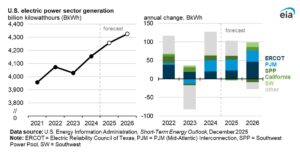
Regional impacts vary. Texas (ERCOT) and the Mid-Atlantic/Ohio Valley (PJM) see the fastest growth. PJM demand is expected to rise more than 3% annually through 2026. ERCOT could see double-digit growth as large loads come online.
Energy mixes are shifting, too. Natural gas remains dominant, but solar grows fastest. In ERCOT, solar generation may jump more than 90% between 2024 and 2026. In PJM, coal and solar both expand as demand surges.
MISO sits between these regions, making grid efficiency critical to prevent higher emissions.
Grid Intelligence: A Tool to Control US Emissions
Smarter grids directly support decarbonization. When operators forecast conditions more accurately, they rely less on fossil fuel peaker plants. Better transmission planning reduces renewable curtailment. Faster responses during stress events avoid inefficient emergency generation.
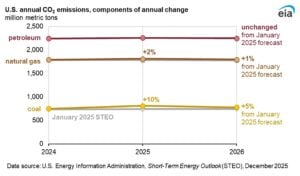
EIA expects total CO2 emissions in 2025 and 2026 to be 1.9% and 0.9% higher, increases in 2026 are associated with relatively higher natural gas-fired electricity generation, associated with rising electricity demand for data centers and cryptocurrency mining.
Thus, these improvements can potentially lower system-wide emissions—even as electricity demand rises. Even though challenges remain, the benefits outweigh the risks. Data privacy, cybersecurity, and regulatory alignment need careful management. Grid operators must also ensure AI tools remain transparent and auditable.
In conclusion, the Microsoft–MISO alliance shows how technology can unlock the next phase of the energy transition. Likewise, Google and other hyperscalers have also launched similar initiatives with PJM.
In short, AI will not just support the grid—it will become a core tool for decarbonization across the United States.
The post Microsoft–MISO AI Partnership Sets Path for Smarter, Cleaner US Electricity Grid appeared first on Carbon Credits.
Oklo Stock Rises as DOE Approves Radioisotope Pilot Using Recycled Nuclear Fuel

Advanced nuclear energy is moving from concept to execution in the United States. Oklo Inc. (NYSE: OKLO), a next-generation nuclear technology company, has reached a major milestone after signing an Other Transaction Agreement (OTA) with the U.S. Department of Energy (DOE). The agreement supports the design, construction, and operation of a radioisotope pilot plant under the DOE’s Reactor Pilot Program (RPP).
This step marks Oklo’s transition from planning to active deployment under formal DOE authorization. It also signals growing federal confidence in private-sector nuclear innovation, especially as energy demand rises alongside AI-driven infrastructure growth.
DOE Agreement Pushes Oklo into Active Execution Phase
The OTA allows Oklo to move forward with its Radioisotope Pilot Facility, a project designed to demonstrate domestic production of critical medical and research isotopes. Unlike traditional federal contracts, OTAs provide flexibility, speed, and fewer administrative constraints. This framework is increasingly favored for advanced reactor development.
With the agreement now in place, Oklo’s subsidiary Atomic Alchemy Inc. will focus its near-term efforts entirely on building and operating the pilot facility. As part of this “learn first, then scale” approach, the company has withdrawn its earlier Nuclear Regulatory Commission (NRC) permit application for the Meitner-1 commercial facility. Instead, Oklo plans to use insights from the pilot plant to support future commercial-scale deployments.
Jacob DeWitte, co-founder and CEO of Oklo, said:
“This OTA establishes a framework for execution and risk reduction. By building and operating a pilot reactor, we generate the data and experience to streamline future commercial deployments, improve regulatory efficiency, and deliver long-term value”
Why Domestic Radioisotope Production Matters
Radioisotopes play a critical role across healthcare, research, and national security. They are used to diagnose and treat cancer, support medical imaging, power scientific research, and enable space and defense applications. Yet many of these isotopes are still produced overseas or at aging facilities.
Oklo aims to change that. By establishing a pilot plant in the U.S., Atomic Alchemy is laying the foundation for reliable, domestic isotope supply chains. This shift could reduce dependence on foreign sources while improving long-term availability for hospitals and research institutions.
Moreover, Oklo’s technology allows the recycling of used nuclear fuel to extract valuable isotopes. Some materials, such as Strontium-90, can be used directly in applications like space power systems without additional processing. This approach improves efficiency while reducing waste, offering both economic and strategic benefits.
Oklo Stock Gains Strong Investor Confidence
Investors responded quickly to Oklo’s DOE milestone. As of January 9, 2026, OKLO shares closed at $105.31, rising nearly 8% in a single session. It traded between $104.03 and $115.72, with after-hours activity pushing prices even higher.
Trading volume surged to 33.8 million shares, more than double the average, signaling heightened market interest. Oklo’s market capitalization now stands at roughly $16.45 billion.
Zooming out, the performance is even more striking. The stock is up 30% year-to-date in 2026 and more than 260% over the past year. Strategic partnerships, including power supply agreements linked to major technology companies, have helped position Oklo as a leading nuclear play in a rapidly evolving energy market.

- READ MORE: Project Matador: America’s $90B Nuclear Power Solution for AI, Semiconductors, and Data Centers
More Developments: Terrestrial Energy Joins the DOE Pilot Program
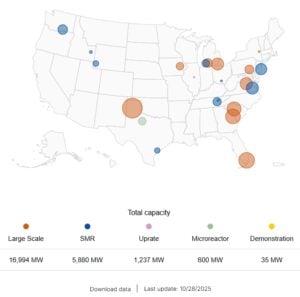
This week, Terrestrial Energy, a Generation IV small modular reactor (SMR) developer, also signed an OTA with the DOE for Project Tetra.
Project Tetra will support the development of Terrestrial Energy’s Integral Molten Salt Reactor (IMSR), a design intended to deliver clean, flexible power to industrial users, data centers, and electric grids. The IMSR’s molten salt technology allows for high-temperature operation, enabling efficient electricity generation as well as direct heat supply for industrial processes.
Notably, the IMSR relies on standard low-enriched uranium (LEU), avoiding the supply constraints associated with HALEU fuel. This design choice could accelerate commercialization at a time when fuel availability has become a key bottleneck for advanced nuclear projects.
As of January 10–11, 2026, the Terrestrial Energy stock (IMSR) hovered between $9.37 and $9.80, posting recent gains amid renewed enthusiasm for nuclear technologies.
Trading volumes exceeded averages, and the company’s market cap reached approximately $768 million. While the stock remains volatile—common for pre-commercial SMR developers—investor interest reflects broader optimism around molten salt reactors and advanced nuclear designs.
OTAs Create a Faster Path From Pilot to Commercial Scale
Both Oklo and Terrestrial Energy are operating under the DOE’s Advanced Reactor Pilot Program, which allows privately built reactors to operate outside national laboratories. This program can bridge the gap between early system testing and full commercial licensing.
By using OTAs, the DOE enables companies to test reactors, gather operational data, and refine designs without the delays of traditional procurement frameworks. As a result, advanced nuclear technologies can reach the market more quickly.
In conclusion, recent U.S. executive actions aim to expand nuclear capacity from 100 gigawatts to 400 gigawatts by 2050. The plan includes upgrading existing reactors, restarting idle plants, and launching new large-scale reactor projects by 2030.
The post Oklo Stock Rises as DOE Approves Radioisotope Pilot Using Recycled Nuclear Fuel appeared first on Carbon Credits.