Carbon Market 2026: Supply Squeeze Pushes Premium Carbon Credit Prices Up, Sylvera Finds

The global carbon market is changing fast in 2026. The latest insights from Sylvera’s State of Carbon Credits report show a clear shift. Volumes are falling, but value is holding steady. This means buyers now focus more on quality than quantity.

Furthermore, the market is splitting into two clear segments. High-quality credits are in demand and sell at higher prices. Older or lower-quality credits are losing interest. This divide is growing stronger and shaping how the market will evolve in the coming years.

Shell’s Sharp Cut Pulls Down Market Volumes

Carbon credit retirements reached 51 million in the first quarter of 2026. This is down from 55.3 million in the same period last year. The total market value also fell slightly to $290 million, compared to $309 million a year ago.

Despite this decline, prices did not weaken. The average price per credit increased to $5.69 from $5.60. This shows that buyers are willing to pay more for credits they trust.

Carbon credit retirements

Interestingly, a major reason for the drop in volumes was reduced activity from Shell. The company sharply cut its purchases. It retired just 494,000 credits in Q1 2026, compared to 6.7 million in Q1 2025 and 5.6 million in 2024. This single change had a large impact on the overall market.

Value Now Drives the Market

The carbon market now runs on a simple idea. Value matters more than volume. Buyers want credits that deliver real environmental impact. They prefer projects with clear data, strong verification, and proven results.

High-quality credits now define the market. These credits meet strict standards and often align with compliance systems. Because of this, they command higher prices and stronger demand.

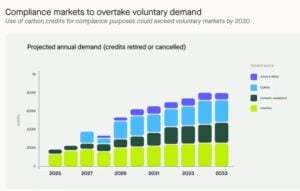
This shift is also linked to the rise of compliance markets. Programs like CORSIA are increasing demand for reliable credits. As a result, voluntary buyers and compliance buyers now compete for the same supply.

Experts expect this trend to grow stronger. Compliance demand could surpass voluntary demand by 2027. This will increase pressure on supply and push premium credit prices higher.

The report highlighted that, investment-grade credits (BBB+) now command an average of $20.10 per credit in Q1 2026, up from $18.10 in Q1 2025, as shown in the image below:

high quality credits

Recap of 2025 Carbon Market

Compliance programs made up 24% of total retirements in 2025. According to Sylvera, this share is rising fast. It is expected to go beyond voluntary demand by 2027. This growth is mainly driven by CORSIA Phase 1 rules and the expansion of domestic carbon markets.

This means compliance demand is set to change the carbon market in a big way. Soon, both voluntary buyers and regulated systems will compete for the same high-quality credits. This is already making supply tighter and more competitive.

At the same time, international trading under Article 6 gained momentum. In 2025, around 20 new bilateral agreements were signed, and the first large-scale carbon credit trades took place. This shows that global carbon transfer systems are now becoming active in practice.

carbon credits
Source: Sylvera

However, the system is also becoming more complex. One key factor is “corresponding adjustments,” which now decide whether a credit is fully acceptable in compliance markets. In addition, countries like China, Japan, Brazil, and Indonesia are building their own domestic carbon systems.

These systems are expected to create strong new demand, but they also add more rules and complexity to the market.

Supply Crunch Becomes the Key Challenge

However, Sylvera has flagged a different scenario for his year. Supply is now the biggest issue in the market. High-quality credits are becoming harder to find. Many credits exist, but not all meet strict requirements.

Furthermore, the main bottleneck is coming from approvals under Article 6. These rules govern international carbon trading. Delays in approvals mean many credits cannot yet enter the market. Now this creates a gap. Supply looks strong on paper, but usable supply remains limited. This shortage keeps prices firm and supports premium credits.

CORSIA Supply Expands, But Not Enough

There has been progress in aviation supply. Eligible credits under CORSIA reached 32.68 million. This is more than double last year’s level.

These credits come from major registries like Verra, Gold Standard, and ART TREES. However, supply still falls short in practice. Not all credits meet full compliance standards. This keeps the market tight and competitive.

Moving on, the question is what’s driving market growth.

Cookstoves Drive Market Growth

Cookstove projects are growing quickly. Their share increased from 17% in 2025 to 26% in Q1 2026. Africa leads this segment. Around 80% of the supply comes from the region. Most of these projects also meet compliance requirements under CORSIA.

Quality is improving in this category. Developers are moving away from older methods. They now use stronger, data-driven approaches. This shift improves trust and attracts more buyers.

Other projects: 

  • REDD+ Regains Trust: Forestry projects under REDD+ are making a comeback. Their share of retirements rose to 25% in Q1 2026. These projects faced heavy criticism in the past. However, new rules and better standards are restoring confidence. Updated methodologies have removed weaker credits. This has improved the overall quality of supply. Global policy clarity has also helped. Buyers now have more confidence in using REDD+ credits in compliance markets. This has supported demand.
  • Waste management projects: They are growing in importance, and their share reached 10% of total retirements, the highest so far. Landfill methane projects are leading this growth. These projects are easier to measure and verify. They also meet compliance standards. Buyers are now exploring options beyond traditional sectors. Waste projects offer a reliable and practical solution.

New Credit Types Expand the Market

Several new project types are growing fast. They are adding fresh supply and attracting new buyers.

  • Clean water projects have seen strong growth in recent years. They now produce millions of credits annually. Marine and mangrove projects are also gaining attention. They offer strong environmental benefits and long-term carbon storage.
  • Industrial projects focused on nitrous oxide reduction are expanding as well. These projects are highly measurable and align well with compliance systems. At the same time, regenerative agriculture is growing at the fastest pace. It has moved from almost no activity to millions of credits in a short time.

These new categories are helping the market grow. However, quality remains the key factor that drives demand.

carbon credits type

Buyers Shift Toward Better Credits: Regional Analysis 

Buyer behavior is changing across regions. The United Kingdom is leading the move toward high-quality credits. Companies are under pressure to show real climate action. This has pushed them to choose better credits.

The United States and Canada are also improving. Buyers prefer projects that meet both voluntary and compliance standards. This supports demand for high-quality supply.

North America Sets the Benchmark

North America sets the benchmark for quality. A large share of its credits meets high rating standards. This strong quality supports higher prices. The average price reached $14.80, the highest globally. Strong domestic demand and strict standards drive this trend.

On the other hand, South America is seeing strong demand but limited new supply. This creates pressure in the market. Prices have slightly declined to $11.50. However, the quality mix is improving. Waste projects are helping fill the gap left by falling forestry supply.

  • Europe remains the largest market by volume. However, the quality mix is still uneven. Some buyers continue to use lower-rated credits.
  • Japan and South Korea focus on lower-cost options like hydropower. This keeps their share of high-quality credits low. In Latin America, buyers often choose local projects. Limited regulatory pressure keeps the quality demand weaker.
  • Africa is moving toward better quality. High-rated supply is increasing, while low-rated supply is falling. As explained before, cookstove projects are the main driver. At the same time, lower-quality forestry projects are declining. This improves the region’s overall market position.
  • Asia faces weaker market conditions. Supply has dropped sharply due to fewer renewable energy projects. The average price stands at $5.30, the lowest globally. Demand remains steady but lacks strong growth. This keeps prices under pressure.

Indonesia Stands Out in Asia

Indonesia is a bright spot in the region. Credit prices have risen strongly in the past year. High-quality peatland projects are driving this growth. International deals under Article 6 are also adding value. These factors attract buyers looking for reliable credit.

This shows how strong quality and supportive policies can boost market performance.

Final Take: Quality Defines the Future

The carbon market in 2026 is clear and focused. Quality now drives demand, pricing, and growth. Buyers are becoming more selective. They want credits that are verified, reliable, and compliant.

Supply remains tight, especially for high-quality credits. At the same time, compliance markets are growing. This increases competition and pushes prices higher.

The gap between high- and low-quality credits will continue to widen. In simple terms, the market is no longer about how many credits exist. It is about how good they are.

The post Carbon Market 2026: Supply Squeeze Pushes Premium Carbon Credit Prices Up, Sylvera Finds appeared first on Carbon Credits.

Radisson Hotel Group Ramps Up Net Zero Push by 2030: How Does it Compare with Marriott and Accor?

Radisson Hotel Group Ramps Up Net Zero Push by 2030: How Does it Compare with Marriott and Accor?

Radisson Hotel Group has raised its climate ambition in the hospitality sector. The group now targets 100 verified net-zero hotels by 2030 across its global portfolio. This move builds on its existing science-based net zero commitment by 2050, approved under the Science Based Targets initiative (SBTi).

Radisson defines verified net-zero hotels as properties that cut operational emissions completely. This is done through energy transition and efficiency upgrades. while using limited offsets only for any remaining emissions.

The company has already launched early examples of this model in Manchester (UK) and Oslo (Norway). These hotels were upgraded through full operational redesigns instead of new construction. The goal is to scale this approach across multiple regions and hotel types.

Radisson Hotel Group CEO Federico J. González Tejera remarked during the release: 

“At Radisson Hotel Group, sustainability ultimately starts with people. It is about delivering for our guests, creating value for our owners, and supporting the communities where we operate. Verified Net Zero Hotels are an important step in our net zero transformation, setting a new standard for how hospitality can reduce its environmental impact while continuing to support people, destinations, and economic activity.”

How Net Zero Hotels Work in Practice

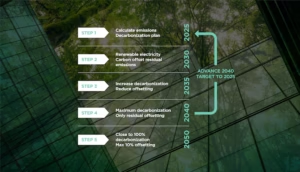
Radisson’s net zero model follows a structured decarbonization system developed with industry partners. It is designed to measure, reduce, and gradually eliminate emissions across hotel operations.

The process involves several steps:

  • measuring carbon fully,
  • switching to renewable electricity,
  • electrifying heating and cooking, and
  • upgrading efficiency in water, waste, and energy use.

Over time, the goal is to reduce reliance on carbon offsets and focus on real emissions cuts.

The Manchester and Oslo hotels show how this works in practice. Both properties switched to renewable electricity, removed fossil fuel systems, and added low-carbon changes. These include electrified kitchens and waste reduction programs.

Radisson Hotel group verified net zero steps
Source: Radisson Hotel Group

Radisson says these pilot hotels cut emissions by about 60%. This shows that significant reductions are possible in existing buildings.

Big Targets, Real Progress: Radisson’s Carbon Cuts

Radisson has set measurable climate targets aligned with global climate frameworks. The company aims to reduce Scope 1 and Scope 2 emissions by 46% by 2030, compared with a 2019 baseline. It also targets a 28% reduction in Scope 3 emissions by 2030, which includes supply chain and outsourced activities.

The group has already made measurable progress. By 2023, Radisson achieved a 35% reduction in carbon footprint per square metre compared to 2019 levels. Over the past decade, it has also improved energy and water efficiency by around 30% across operations.

The company works in over 100 countries and manages more than 1,500 hotels. This makes its decarbonization effort one of the biggest in the global hospitality sector.

Industry Shift: Hotels Move Toward Low-Carbon Operations

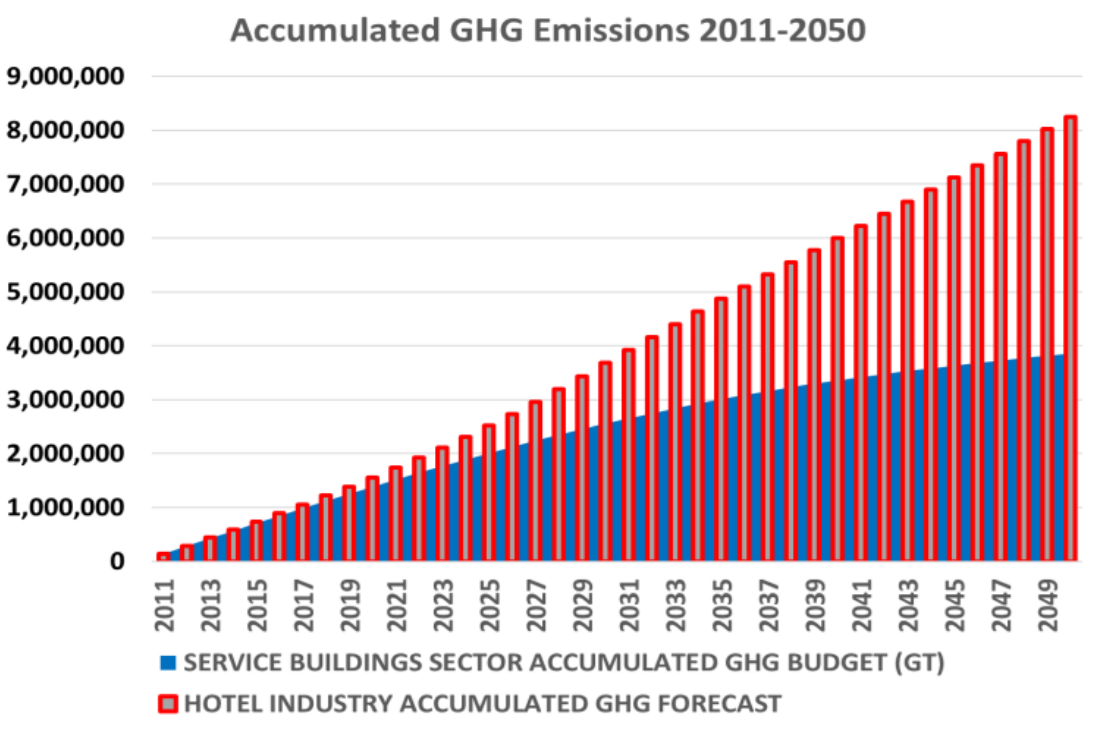
The hotel industry is increasingly under pressure to reduce emissions. Hospitality is energy-intensive because of heating, cooling, laundry, food services, and continuous building operations.

global hotel ghg emissions forecast
Source: Sustainable Hospitality Alliance report

Hospitality accounts for ~1% of global carbon emissions and ~7.8% of water use worldwide. The sector’s energy intensity averages 200-800 kBtu/sq ft annually, with heating/cooling consuming 50-60% of total energy.

Emissions breakdown by source:

  • Building energy: 60-70% (HVAC, lighting, hot water)
  • Food/beverage supply chains: 20-25%
  • Waste management: 10-15%

Hotels are now focusing on electrification and using renewable energy. They are also upgrading efficiency to cut their carbon footprint and journey toward net positive hospitality

Radisson is joining a trend toward verified net-zero hotels. These hotels need to cut emissions and get third-party checks. This approach reduces uncertainty in sustainability claims and improves transparency for investors and customers.

Independent verification systems are now widely used to confirm emissions reductions. They help make sure that net zero claims are credible and comparable across the industry.

The standard third-party verification:

  • Green Key/SGS: Verify WTTC Hotel Sustainability Basics (12 criteria)
  • TÜV Rheinland: Certifies Radisson’s net zero hotels
  • Cornell Hotel Sustainability Index: Benchmarks 1,307 global markets

The Net Zero Race in Hospitality: Radisson vs Marriott vs Accor

Radisson Hotel Group, Marriott International, and Accor Hotels all follow long-term net-zero goals. However, their timelines and strategies differ.

  • Radisson Hotel Group

Radisson Hotel Group aims for net zero across Scope 1, 2, and 3 emissions by 2050. It has a near-term target to cut Scope 1 and 2 emissions by 46.2% by 2030 (2019 base year) and reduce Scope 3 emissions by 27.5%.

Radisson has also launched “Verified Net Zero” hotels powered by 100% renewable electricity and low-waste operations. It is adding energy-saving upgrades. This includes LED lighting, smart heating and cooling systems, and building retrofits throughout its portfolio. It also pushes waste reduction programs, including food waste tracking and recycling systems in many hotels.

  • Marriott International

Marriott International also targets net zero across its value chain by 2050, with science-based approval. It plans to reduce Scope 1 and 2 emissions by 46.2% and Scope 3 emissions by 27.5% by 2030 (2019 baseline). It is investing in large-scale renewable electricity procurement through long-term power purchase agreements.

Marriott is also improving building efficiency with smart energy management systems across thousands of properties. Marriott is also promoting low-carbon supply chains. They are working with suppliers to reduce packaging and use more sustainable materials.

  • Accor

Accor also targets net zero by 2050, with a strong focus on operational efficiency and procurement reform. It is upgrading hotels with energy-efficient systems and expanding renewable electricity use across its brands.

Accor is also reducing food-related emissions by increasing plant-based menu options and cutting food waste. However, it provides less detailed interim emission reduction percentages than Radisson and Marriott. It focuses more on operational efficiency and engaging suppliers to make progress.

Radisson vs Marriott vs Accor net zero
Data from company reports

Overall, all three groups are moving toward net zero, but Radisson and Marriott show more defined short-term emissions targets. In contrast, Accor focuses more on operational changes and supply chain improvements.

ESG and Sustainable Hospitality: Green Travel Is No Longer Optional

Sustainability is becoming a stronger factor in travel decisions. More guests now prefer hotels that show clear environmental performance and use verified sustainability systems.

Corporate travel buyers are also adding ESG requirements to hotel contracts. This includes emissions reporting, renewable energy use, and waste reduction commitments. As a result, sustainability is becoming a competitive factor in hotel selection.

The global hospitality sector is adopting structured plans for decarbonization. This includes energy efficiency upgrades and using renewable electricity. Digital tracking of emissions is also becoming more common, especially for large hotel groups.

Radisson’s net-zero hotels are part of this shift. Sustainability-focused hotels can boost guest engagement and enhance brand positioning. This is backed by industry case studies. These strategies help hotels stand out in competitive markets.

The Hard Truth About Scaling Net Zero Hotels

Scaling net-zero hotels globally is complex. One major challenge is the cost of retrofitting existing buildings. Many hotels require major upgrades to heating, cooling, and kitchen systems to reduce emissions.

Another challenge is uneven access to renewable electricity across regions. Some markets still rely heavily on fossil fuels. This limits emissions reductions, even when hotels switch to cleaner operations.

Supply chain emissions also remain difficult to control. These include food sourcing, construction materials, and outsourced services. Tracking and reducing Scope 3 emissions requires coordination across many suppliers.

Finally, implementation varies by country due to differences in regulation, infrastructure, and energy systems. This creates uneven progress across global hotel portfolios.

Can Net Zero Become the New Hotel Standard?

Radisson’s plan to reach 100 net-zero hotels by 2030 marks a significant step in hospitality decarbonization. If achieved, it would create one of the largest verified net-zero hotel networks globally.

The strategy also supports its long-term goal of achieving net zero emissions across its entire value chain by 2050, aligned with global climate targets.

Future progress relies on quicker electrification of hotel operations, broader access to renewable energy, better ESG reporting, and ongoing investment in low-carbon technologies.

If done right, net-zero hotels could be the norm in global hospitality within the decade. This would change how hotels run and compete in international travel.

The post Radisson Hotel Group Ramps Up Net Zero Push by 2030: How Does it Compare with Marriott and Accor? appeared first on Carbon Credits.

Microsoft Hits Pause on All Carbon Removal Purchases: A Major Shift in Corporate Climate Strategy

Microsoft Hits Pause on All Carbon Removal Purchases: A Major Shift in Corporate Climate Strategy

Microsoft has temporarily halted all new carbon removal purchases as it reviews its broader climate strategy. The move affects direct air capture, biochar, and other engineered carbon removal solutions supported by its $1 billion Climate Innovation Fund, launched in 2020. It could delay hundreds of millions of dollars in planned investments across the carbon removal sector.

The pause was first reported by Heatmap News, in which a company spokesperson said that Microsoft is not indefinitely halting all of its purchases. Rather, she stated:

“We continually review and assess our carbon removal portfolio along with market conditions for the optimal balance on our path to carbon negative.”

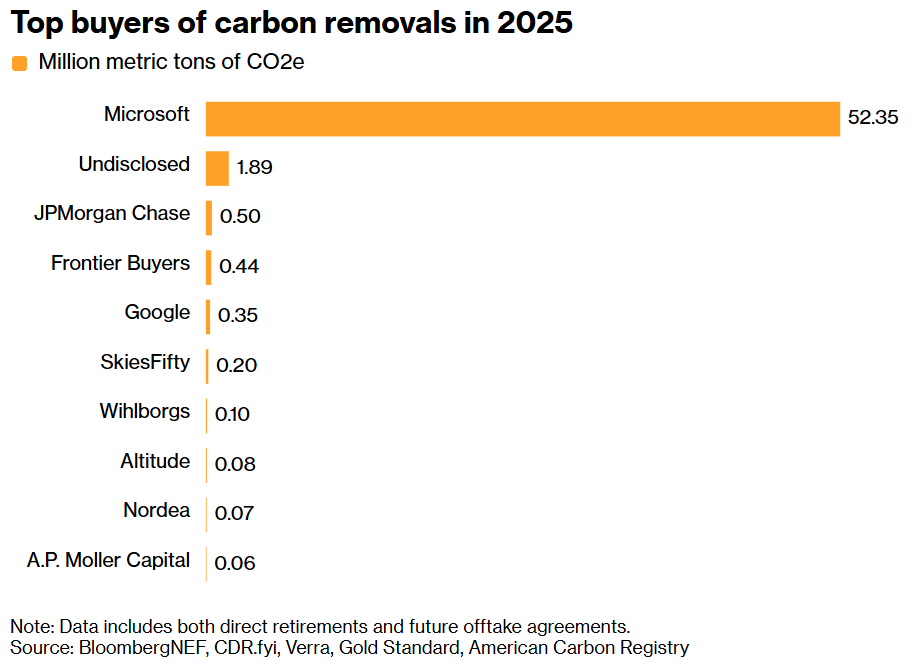
Microsoft has been one of the largest corporate buyers of high-quality carbon removal credits. Its decision signals a shift in how major companies evaluate carbon offsets and removal technologies.

The review focuses on whether current solutions can deliver reliable, long-term emissions reductions at scale. It also reflects growing scrutiny of corporate net-zero claims from regulators, investors, and climate groups.

Impact on Carbon Removal Market Pricing

Microsoft’s pause is expected to have an immediate impact on the voluntary carbon market (VCM). The company has played a leading role in scaling demand for engineered carbon removal credits.

These credits are more expensive than traditional offsets. Microsoft has typically paid between $100 and $600 per metric ton of CO₂ removed, compared with $5 to $15 per ton for many nature-based or avoidance credits.

Industry estimates suggest that Microsoft’s pause could significantly reduce demand in the engineered carbon removal market. The tech giant has accounted for as much as 80% to 90% of global purchases of carbon removals.

Several suppliers are directly exposed. Companies such as Climeworks and Carbon Engineering have signed multi-year agreements with Microsoft worth a combined $200 million to $300 million. These deals helped fund the early deployment of direct air capture facilities.

The broader voluntary carbon market has already seen price pressure. According to the Ecosystem Marketplace, average prices for carbon credits vary widely depending on quality. Premium removal credits trade at a steep premium due to limited supply and higher verification standards.

Microsoft’s exit, even if temporary, may accelerate a correction in these high prices. It may also reduce near-term funding for early-stage carbon removal technologies.

Microsoft’s Net-Zero Targets Face a Reality Check

Microsoft has some of the most ambitious climate goals in the corporate sector. The company aims to become carbon negative by 2030 and remove all the carbon it has emitted since its founding by 2050.

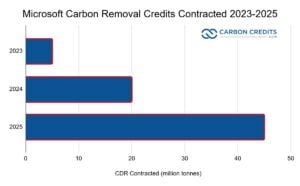
To support this, the tech giant has committed significant capital to carbon removal. By 2025, it had invested more than $750 million in carbon removal projects and contracted roughly 45 million tonnes of removals.

microsoft carbon removal contracts 2023-2025

The current review is examining whether these investments can scale fast enough to meet long-term targets. Key concerns include:

  • The permanence of carbon storage, especially for geological projects
  • The high cost of engineered removal compared to direct emissions cuts
  • The limited capacity of current technologies to deliver millions of tons annually

Many removal methods are still in early stages. Direct air capture, for example, currently removes only a small fraction of global emissions. The International Energy Agency estimates that global carbon removal capacity remains well below what is needed to meet net-zero scenarios by mid-century.

Microsoft is also reviewing how carbon removal fits into its broader decarbonization strategy. This includes aligning removal purchases with renewable energy investments and operational emissions reductions

SEE MORE:

Broader Big Tech Climate Strategy Shifts

Microsoft’s move reflects a broader shift across the technology sector. Other major companies, including Amazon, Meta, and Google, have slowed their carbon removal purchases in recent quarters.

Instead, many are focusing more on reducing emissions directly. This includes expanding renewable energy use, improving energy efficiency, and redesigning supply chains.

This trend aligns with updated guidance from the Science Based Targets initiative (SBTi). The SBTi emphasizes that companies should prioritize emissions reductions across Scope 1, 2, and 3 before relying on carbon removal.

Under this framework, carbon removal is treated as a solution for residual emissions that cannot be eliminated. This approach reduces reliance on offsets and increases pressure on companies to decarbonize core operations.

At the same time, regulatory scrutiny is increasing. In the United States, the U.S. Securities and Exchange Commission has proposed new climate disclosure rules. These rules would require companies to provide more detailed reporting on emissions and climate-related risks.

This is pushing companies to strengthen verification standards for carbon credits and avoid reputational risks linked to low-quality offsets.

A Turning Point for Carbon Removal Investment Models

Microsoft’s decision may signal a broader shift in how companies support carbon removal technologies. Instead of buying credits directly, some firms are exploring new funding models.

These include advance market commitments, where companies guarantee future demand, and direct investments in technology development. These approaches can provide more stable funding while reducing reliance on spot market purchases.

The technology sector has been a major driver of carbon removal demand. Since 2022, it has accounted for about 40% of high-quality removal credit purchases. Between 2020 and 2025, major tech companies committed billions of dollars to carbon removal initiatives.

total cdr sales cdr.fyi data
Source: image from CDR.fyi

If large buyers step back, developers may face funding gaps in the short term. However, this could also push the industry to improve cost efficiency and scalability.

Current removal costs remain high. Direct air capture can exceed $500 per ton, though companies aim to reduce this below $100 per ton over time. Achieving this will require technological advances, economies of scale, and supportive policy frameworks.

What It Means for Carbon Markets and Climate Goals

Microsoft’s pause marks a key moment for the VCM. It highlights the growing demand for higher standards, better verification, and clearer climate impact.

In the short term, the decision may slow growth in the premium carbon removal segment. Prices could soften, and some projects may face delays or funding challenges.

However, the long-term impact could be positive. Stronger scrutiny may lead to more reliable and transparent carbon removal solutions. This would help build trust in the market and attract new investment.

For companies, the message is clear. Net-zero strategies must focus first on reducing emissions. Carbon removal remains important, but it must be credible, scalable, and cost-effective.

For the carbon removal sector, the challenge is to prove that its technologies can deliver on these expectations. If successful, it will play a critical role in global climate efforts.

The International Energy Agency and other bodies have made it clear that carbon removal will be essential to achieving net-zero emissions by 2050. The question is not whether it is needed, but how fast it can scale.

As the sector evolves, companies that can deliver verified, permanent, and affordable carbon removal solutions are likely to lead the next phase of expansion.

The post Microsoft Hits Pause on All Carbon Removal Purchases: A Major Shift in Corporate Climate Strategy appeared first on Carbon Credits.

Philippines Taps Blue Carbon and Biodiversity Credits to Protect Coasts and Climate

Philippines Taps Blue Carbon and Biodiversity Credits to Protect Coasts and Climate

The Philippines is stepping up efforts to protect its coastal ecosystems. The government recently advanced its National Blue Carbon Action Partnership (NBCAP) Roadmap. This plan aims to conserve and restore mangroves, seagrass beds, and tidal marshes. It also explores biodiversity credits — a new market linked to nature conservation.

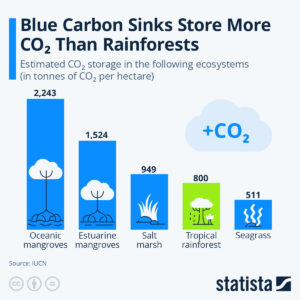
Blue carbon refers to the carbon stored in coastal and marine ecosystems. These habitats can hold large amounts of carbon in plants and soil. Mangroves, for example, store carbon at much higher rates than many land forests. Protecting them reduces greenhouse gases in the atmosphere.

Biodiversity credits are a related concept. They reward actions that protect or restore species and ecosystems. They work alongside carbon credits but focus more on ecosystem health and species diversity. Markets for biodiversity credits are being discussed globally as a complement to carbon markets.

Why the Philippines Is Targeting Blue Carbon

The Philippines is rich in coastal ecosystems. It has more than 327,000 hectares of mangroves along its shores. These areas protect coastlines from storms, support fisheries, and store carbon.

Mangroves and seagrasses also support high levels of biodiversity. Many fish, birds, and marine species depend on these habitats. Restoring these ecosystems helps conserve species and supports local food systems.

The NBCAP Roadmap was handed over to the Department of Environment and Natural Resources (DENR) during the Philippine Mangrove Conference 2026. The roadmap is a strategy to protect blue carbon ecosystems while linking them to climate goals and local livelihoods.

DENR Undersecretary, Atty. Analiza Rebuelta-Teh, remarked during the turnover:

“This Roadmap reflects the Philippines’ strong commitment to advancing blue carbon accounting and delivering tangible impact for coastal communities.” 

Edwina Garchitorena, country director of ZSL Philippines, which will oversee its implementation, also commented:

“The handover of the NBCAP Roadmap to the DENR represents a turning point in advancing blue carbon action and strengthening the Philippines’ leadership in coastal conservation in the region.”

The plan highlights four main pillars:

  • Science, technology, and innovation.
  • Policy and governance.
  • Communication and community engagement.
  • Finance and sustainable livelihoods.

These pillars aim to strengthen coastal resilience, support community well‑being, and align blue carbon action with national climate commitments.

What Blue Carbon Credits Could Mean for Markets

Globally, blue carbon markets are growing. These markets allow coastal restoration projects to sell carbon credits. Projects that preserve or restore mangroves, seagrass meadows, and tidal marshes can generate credits. Buyers pay for these credits to offset emissions.

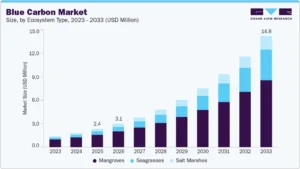
According to Grand View Research, the global blue carbon market was valued at US$2.42 million in 2025. It is projected to reach US$14.79 million by 2033, growing at a compound annual growth rate (CAGR) of almost 25%.

blue carbon market grand view research
Source: Grand View Research

The Asia Pacific region led the market in 2025, with 39% of global revenue, due to its extensive coastal ecosystems and government support. Within the market, mangroves accounted for 68% of revenue, reflecting their high carbon storage capacity.

Blue carbon credits belong to the voluntary carbon market. Companies purchase these credits to offset emissions they can’t eliminate right now. Buyers are often motivated by sustainability goals and environmental, social, and corporate governance (ESG) standards.

Experts at the UN Environment Programme say these blue habitats can capture carbon 4x faster than forests:

blue carbon sequestration
Source: Statista

Why Biodiversity Credits Matter: Rewarding Species, Strengthening Ecosystems

Carbon credits aim to cut greenhouse gases. In contrast, biodiversity credits focus on saving species and habitats. These credits reward projects that improve ecosystem health and may be used alongside carbon markets to attract finance for nature.

Biodiversity credits are particularly relevant in the Philippines, one of 17 megadiverse countries. The nation is home to thousands of unique plant and animal species. Supporting biodiversity through market mechanisms can strengthen conservation efforts while also supporting local communities.

Globally, biodiversity credit markets are still developing. Organizations such as the Biodiversity Credit Alliance are creating standards to ensure transparency, equity, and measurable outcomes. They want to link private investment to good environmental outcomes. They also respect the rights of local communities and indigenous peoples.

These markets complement carbon markets. They can support conservation efforts. This boosts ecosystem resilience and protects species while also capturing carbon.

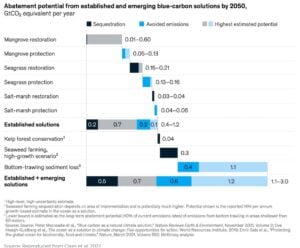
Together with blue carbon credits, they form part of a broader nature-based solution to climate change and biodiversity loss. A report by the Ecosystem Marketplace estimates the potential carbon abatement for every type of blue carbon solution by 2050.

blue carbon abatement potential by 2050
Source: Ecosystem Marketplace

Science, Policy, and Funding: The Roadblocks Ahead

Building blue carbon and biodiversity credit markets is not easy. There are several challenges ahead for the Philippines.

One key challenge is measurement and verification. To sell carbon or biodiversity credits, projects must prove they deliver real and measurable benefits. This requires science‑based methods and monitoring systems.

Another challenge is finance. Case studies reveal that creating a blue carbon action roadmap in the Philippines may need around US$1 million. This funding will help set up essential systems and support initial actions.

Policy frameworks are also needed. Laws and rules must support credit issuance, protect local rights, and ensure fair sharing of benefits. Coordination across government agencies, local communities, and investors will be important.

Stakeholder engagement is key. The NBCAP Roadmap and related forums involve scientists, policymakers, civil society, and private sector partners. This teamwork approach makes sure actions are based on science, inclusive, and fair in the long run.

Looking Ahead: Coastal Conservation as Climate Strategy

Blue carbon and biodiversity credits could provide multiple benefits for the Philippines. Protecting and restoring coastal habitats reduces greenhouse gases, conserves species, and supports local economies. Coastal ecosystems also provide natural defenses against storms and rising seas.

If blue carbon and biodiversity credit markets grow, they could fund coastal conservation at scale while supporting global climate targets. Biodiversity credits could further enhance ecosystem protection by linking nature’s intrinsic value to market mechanisms. 

The market also involves climate finance and corporate buyers looking for quality credits. Additionally, international development partners focused on coastal resilience may join in.

For the Philippines, the next few years will be critical. Implementing the NBCAP roadmap, establishing credit systems, and strengthening governance could unlock new opportunities for climate action, sustainable development, and regional leadership in blue carbon finance.

The post Philippines Taps Blue Carbon and Biodiversity Credits to Protect Coasts and Climate appeared first on Carbon Credits.

Global EV Sales Set to Hit 50% by 2030 Amid Oil Shock While CATL Leads Batteries

The global electric vehicle (EV) market is gaining speed again. A sharp rise in oil prices, triggered by the recent U.S.–Iran conflict in early 2026, has changed how consumers think about fuel and mobility. What looked like a slow market just months ago is now showing strong signs of recovery.

According to SNE Research’s latest report, this sudden shift in energy markets is pushing EV adoption faster than expected. Rising gasoline costs and uncertainty about future oil supply are driving buyers toward electric cars. As a result, the EV transition is no longer gradual—it is accelerating.

Oil Price Shock Changes Consumer Behavior

The conflict in the Middle East sent oil markets into turmoil. Gasoline prices jumped quickly, rising from around 1,600–1,700 KRW per liter to as high as 2,200 KRW. This sudden spike acted as a wake-up call for many drivers.

Consumers who once hesitated to switch to EVs are now rethinking their choices. High and unstable fuel prices have made traditional gasoline vehicles less attractive. At the same time, EVs now look more cost-effective and reliable over the long term.

SNE Research noted that even if oil prices stabilize later, the fear of future spikes will remain. This uncertainty is a key driver behind early EV adoption. People no longer want to depend on volatile fuel markets.

EV Growth Forecasts Get a Major Boost

SNE Research has revised its global EV outlook. The firm now expects faster adoption across the decade.

  • EV market penetration is projected to reach 29% in 2026, up from an earlier estimate of 27%.
  • By 2027, the share could jump to 35%, instead of the previously expected 30%.
  • Most importantly, EVs are now expected to cross 50% of new car sales by 2030, earlier than prior forecasts.

The research firm also highlighted a clear timeline shift. EV demand has moved forward by half a year in 2026. By 2027, this lead increases to one full year. From 2028 onward, adoption is expected to accelerate by more than two years. This shows that the global EV transition is happening much faster than industry players had originally planned.

EV growth

Higher Fuel Costs Improve EV Economics

One of the biggest drivers behind this shift is simple: EVs are becoming cheaper to own compared to gasoline cars.

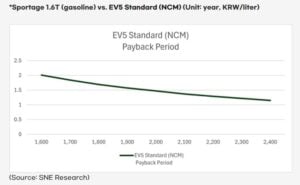
SNE Research compared two popular models—the gasoline-powered Kia Sportage 1.6T and the electric Kia EV5. The results highlight how rising fuel prices change the equation.

At a gasoline price of 1,600 KRW per liter, it takes about two years to recover the higher upfront cost of an EV. However, when fuel prices rise to 2,000 KRW per liter, the payback period drops to just one year and two months.

ev sales

So, over a longer period, the savings are even clearer:

  • Total 10-year cost of a gasoline car: 59–65 million KRW
  • Total 10-year cost of an EV: around 44 million KRW

This large gap makes EVs a smarter financial choice, especially when fuel prices remain high.

Battery Shake-Up: Market Struggles While CATL Surges Ahead

While EV demand is improving, the battery industry is seeing mixed results.

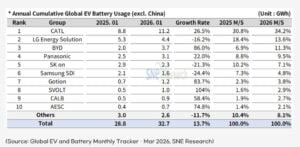
In the first two months of 2026, global EV battery usage reached 134.9 GWh, a modest increase of 4.4% year-over-year. However, not all companies are benefiting equally.

South Korean battery makers—LG Energy Solution, SK On, and Samsung SDI—saw their combined market share fall to 15%, down by 2.2 percentage points. Each company reported declining growth:

  • LG Energy Solution: down 2.7%
  • SK On: down 12.9%
  • Samsung SDI: down 21.9%

This drop was mainly due to weaker EV sales in the U.S. market earlier in the year.

  • In contrast, Chinese battery giant CATL continued to expand its lead. Its market share grew from 38.7% to 42.1%, strengthening its global dominance.

SNE Research explained that future competition will depend less on overall EV growth and more on supply chain strategy. Companies that diversify across customers and regions will be in a stronger position.

catl battery

Automakers Feel the Impact Across Markets

Battery demand also reflects trends in automaker performance. Samsung SDI, for example, supplies batteries to brands like BMW, Audi, and Rivian. However, slower EV sales across these companies reduced overall battery demand.

Some key factors include:

  • Lower sales of BMW’s electric lineup, including models like the i4 and iX
  • Weak demand for Audi EVs despite new launches
  • Declining sales from North America-focused brands like Rivian and Jeep

In some cases, new models even reduced demand for older ones. For instance, Audi’s Q6 e-tron impacted sales of the Q8 e-tron, lowering overall battery usage.

ev sales

A Structural Shift in the EV Market

Despite short-term fluctuations, SNE Research believes the EV market is entering a new phase. The current surge is not just a reaction to oil prices—it reflects a deeper shift in consumer mindset.

People now see EVs as a safer and more stable option. Energy security, cost savings, and environmental concerns are all playing a role.

As SNE Research’s Vice President Ik-hwan James Oh explained, even if oil prices fall, the memory of sudden spikes will remain. This lasting concern will continue to push EV adoption.

In conclusion, the events of early 2026 have shown how quickly market dynamics can change. A single geopolitical shock has reshaped the global auto industry outlook.

For automakers, the message is clear: EV demand can rise faster than expected. For battery companies, the focus must shift to global expansion and supply chain resilience. For consumers, the decision is becoming easier as EVs offer both savings and stability.

The global EV market is no longer just growing—it is accelerating. And if current trends continue, the shift to electric mobility could arrive much sooner than anyone expected.

The post Global EV Sales Set to Hit 50% by 2030 Amid Oil Shock While CATL Leads Batteries appeared first on Carbon Credits.

AI Data Centers Power Crisis: Massive Energy Demand Threatens Emissions Targets and Latest Delays Signal Market Shift

AI Data Centers Power Crisis: Massive Energy Demand Threatens Emissions Targets and Latest Delays Signal Market Shift

The rapid growth of artificial intelligence (AI) is creating a new challenge for global energy systems. AI data centers now require far more electricity than traditional computing facilities. This surge in demand is putting pressure on power grids and raising concerns about whether climate targets can still be met.

Large AI data centers typically need 100 to 300 megawatts (MW) of continuous power. In contrast, conventional data centers use around 10-50 MW. This makes AI facilities up to 10x more energy-intensive, depending on the scale and workload.

AI Data Centers Are Driving a Sharp Rise in Power Demand

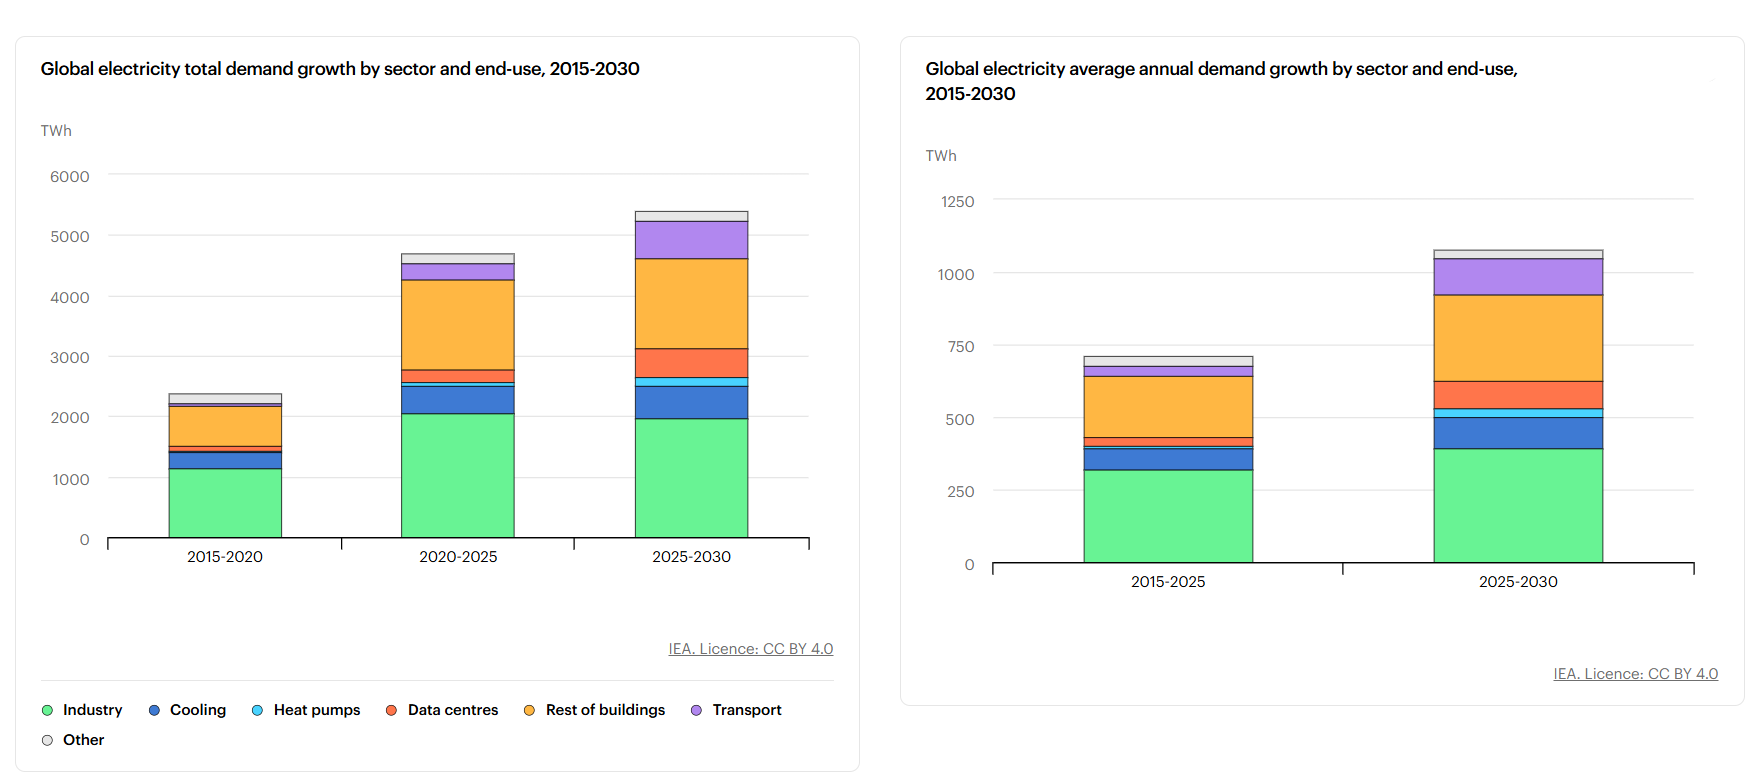
The increase is happening quickly. The International Energy Agency estimates that global data center electricity use reached about 415 terawatt-hours (TWh) in 2024. That number could rise to more than 1,000 TWh by 2026, largely driven by AI applications such as machine learning, cloud computing, and generative models. global electricity demand by sector 2030 IEA

At that level, data centers would consume as much electricity as an entire mid-sized country like Japan

In the United States, the impact is also growing. Data centers could account for 6% to 8% of total electricity demand by 2030, based on utility projections and grid operator estimates. AI is expected to drive most of that increase as companies continue to scale infrastructure to support new applications.

Training large AI models is especially energy-intensive. Some estimates say an advanced model can use millions of kilowatt-hours (kWh) just for training. For instance, training GPT-3 needs roughly 1.287 million kWh, and Google’s PaLM at about 3.4 million kWh. Analytical estimates suggest training newer models like GPT-4 may require between 50 million and over 100 million kWh.

That is equal to the annual electricity use of hundreds of households. When combined with ongoing usage, known as inference, total energy consumption rises even further.

ChatGPT vs Claude AI energy and carbon use

This rapid growth is creating a gap between electricity demand and available supply. It is also raising questions about how the technology sector can expand while staying aligned with global climate goals.

The Grid Bottleneck: Why Data Centers Are Waiting Years for Power

Power demand from AI is rising faster than grid infrastructure can support. Utilities in key regions are now facing a surge in interconnection requests from technology companies building new data centers.

This has led to delays in several major projects. In many cases, developers must wait years before they can secure enough electricity to operate. These delays are becoming more common in established tech hubs where grid capacity is already stretched.

The main constraints include:

  • Limited transmission capacity in high-demand areas, 
  • Slow grid upgrades and long permitting timelines, and
  • Regulatory systems not designed for AI-scale demand.

Grid stability is another concern. AI data centers require constant and uninterrupted power. Even short disruptions can affect performance and reliability. This makes it more difficult for utilities to balance supply and demand, especially during peak periods.

In some regions, utilities are struggling to manage the size and concentration of new loads. A single large data center can use as much electricity as a small city. When several projects are planned in the same area, the pressure on local infrastructure increases significantly.

As a result, some companies are rethinking their expansion strategies. Projects may be delayed, scaled down, or moved to new locations where energy is more accessible. These shifts could slow the pace of AI deployment, at least in the short term.

Renewable Energy Growth Faces a Reality Check

Technology companies have made strong commitments to clean energy. Many aim to power their operations with 100% renewable electricity. This is part of their larger environmental, social, and governance (ESG) goals.

For example, Microsoft plans to become carbon negative by 2030, meaning it will remove more carbon than it emits. Google is targeting 24/7 carbon-free energy by 2030, which goes beyond annual matching to ensure clean power is used at all times. Amazon has committed to reaching net-zero carbon emissions by 2040 under its Climate Pledge.

Despite these targets, AI data centers present a difficult challenge. They need reliable electricity around the clock, while renewable energy sources such as wind and solar are not always available. Output can vary depending on weather conditions and time of day.

To maintain stable operations, many facilities rely on a mix of energy sources. This often includes grid electricity, which may still be partly generated from fossil fuels. In some cases, natural gas backup systems are used more frequently than planned.

Battery storage can help balance supply and demand. However, long-duration storage remains expensive and is not yet widely deployed at the scale needed for large AI facilities. This creates both technical and financial barriers.

Thus, there is a growing gap between corporate clean energy goals and real-world energy use. Closing that gap will require faster deployment of renewable energy, improved storage solutions, and more flexible grid systems.

Carbon Credits Use Surge as Tech Tries to Close the Emissions Gap

The mismatch between AI growth and clean energy supply is also affecting carbon markets. Many technology companies are increasing their use of carbon credits to offset emissions linked to data center operations.

According to the World Bank’s State and Trends of Carbon Pricing 2025, carbon pricing now covers over 28% of global emissions. But carbon prices vary widely—from under $10 per ton in some systems to over $100 per ton in stricter markets. This gap is pushing companies toward voluntary carbon markets.

GHG emissions covered by carbon pricing
Source:

The Ecosystem Marketplace report shows rising demand for high-quality credits, especially carbon removal rather than avoidance credits. But supply is still limited.

Costs are especially high for engineered removals. The IEA estimates that direct air capture (DAC) costs today range from about $600 to over $1,000 per ton of CO₂. It may fall to $100–$300 per ton in the future, but supply is still very small.

Companies are focusing on credits that:

  • Deliver verified emissions reductions,
  • Support long-term carbon removal, and
  • Align with ESG and net-zero commitments.

At the same time, many firms are taking a more active role in energy development. Instead of relying only on offsets, they are investing directly in renewable energy projects. This includes funding new solar and wind farms, as well as entering long-term power purchase agreements.

These investments help secure a dedicated clean energy supply. They also reduce long-term exposure to carbon markets, which can be volatile and subject to changing standards.

Companies Are Adapting Their Energy Strategies: The New AI Energy Playbook

AI companies are changing how they design and operate data centers to manage rising energy demand. Here are some of the key strategies:

  • Energy efficiency improvements (new hardware and cooling systems) that reduce data center power use.
  • More efficient AI chips, specialized processors, that drive performance gains.
  • Advanced cooling systems that cut energy waste and can help cut total power use per workload by 20% to 40%.
  • Data center location strategy is shifting, where facilities are built in regions with stronger renewable energy access.
  • Infrastructure is becoming more distributed, where firms deploy smaller data centers across multiple locations to balance demand and improve resilience.
  • Long-term renewable energy contracts are expanding, which helps companies secure power at stable prices.

A Turning Point for Energy and Climate Goals

The rise of AI is creating both risks and opportunities for the global energy transition. In the short term, increased electricity demand could lead to higher emissions if fossil fuels are used to fill supply gaps.

At the same time, AI is driving major investment in clean energy and infrastructure. The long-term outcome will depend on how quickly clean energy systems can scale.

If renewable supply, storage, and grid capacity keep pace with AI growth, the technology sector could help accelerate the shift to a low-carbon economy. If progress is too slow, however, AI could become a major new source of emissions.

Either way, AI is now a central force shaping global energy demand, infrastructure investment, and the future of carbon markets.

The post AI Data Centers Power Crisis: Massive Energy Demand Threatens Emissions Targets and Latest Delays Signal Market Shift appeared first on Carbon Credits.
Japan Unveils First Hydrogen Engine for Large Ships

Japan Unveils First Hydrogen Engine for Large Ships

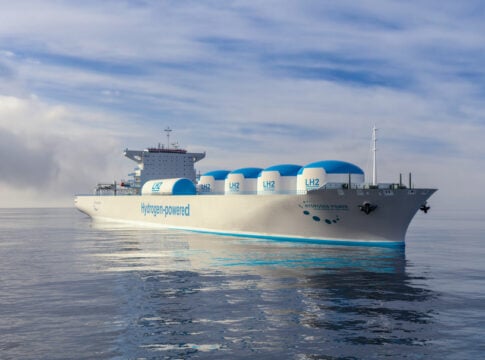
Japan has taken a major step in clean shipping. A consortium led by Japan Engine Corporation and Kawasaki Heavy Industries has successfully tested the world’s first hydrogen-fueled main engine for a large commercial vessel.

This engine is designed for deep-sea cargo ships, not just small vessels. That makes it a key milestone. Most earlier hydrogen ship projects focused on ferries or short routes.

The 3% Problem: Shipping’s Emissions Challenge

The engine is a low-speed, two-stroke design. This is the standard for large ocean-going ships. It can run mainly on hydrogen fuel. In tests, it achieved about 95% hydrogen use at full load, showing stable performance.

The engine will be installed on a 17,500-deadweight-ton multipurpose vessel. The ship is expected to be delivered in 2027. It will then undergo a three-year demonstration period starting in 2028.

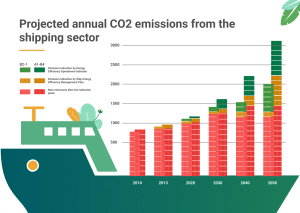
Shipping is a major source of global emissions. The sector produces about 2–3% of global greenhouse gas emissions, based on data from the International Maritime Organization (IMO).

shipping sector annual emissions projection to 2050
Source: Sabarish, B. & Sathishkumar, Anbalagan & M, Cheralathan. (2025). Enhancing Marine HVAC Efficiency Through Free Cooling and Thermal Energy Storage… International Journal of Thermophysics. 46. 10.1007/s10765-025-03646-x.

Most ships today use heavy fuel oil or marine diesel. These fuels produce high emissions. As global trade grows, shipping emissions could increase without new solutions.

Hydrogen is one option. When used as a fuel, it produces no carbon dioxide at the point of use. This makes it attractive for long-term decarbonization.

However, scaling hydrogen for large ships has been difficult. Key challenges include fuel storage, engine design, and safety. Japan’s latest engine test shows that progress is being made.

How Hydrogen Engines Work in Large Vessels

Hydrogen-powered ships can use fuel cells or combustion engines. Japan’s new system uses combustion. This means hydrogen burns inside the engine, similar to diesel. This approach allows easier integration with existing ship systems. It also reduces the need for full redesigns of vessels.

The engine uses liquid hydrogen fuel and advanced injection systems. Engineers have focused on stable combustion and material strength. Hydrogen burns faster than traditional fuels, so precision is critical.

The project includes partners such as Mitsui O.S.K. Lines (MOL), Onomichi Dockyard, and ClassNK. These groups support design, safety checks, and future operations.

The move is part of Japan’s Green Innovation Fund. The Ministry of Economy, Trade, and Industry has funded the program with about 2 trillion yen to help the country reach carbon neutrality by 2050.

Japan’s Net Zero Strategy and Hydrogen Push

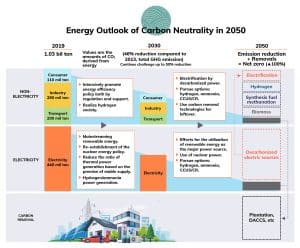
This hydrogen engine project fits into Japan’s broader climate strategy. The country has pledged to reach net-zero greenhouse gas emissions by 2050. This goal was announced by former Prime Minister Yoshihide Suga in 2020.

Japan carbon neutrality 2050 energy outlook
Source: Bloomberg

Japan sees hydrogen as a key part of its energy transition. Under its Basic Hydrogen Strategy, the government aims to expand hydrogen use across power, transport, and industry.

Japan plans to increase its hydrogen supply to 20 million tonnes per year by 2050, up from much lower current levels. The country is also investing in hydrogen imports, storage, and infrastructure.

Shipping plays a major role in this plan. Japan depends heavily on imports of energy and raw materials. Decarbonizing shipping is important for both climate and energy security.

Projects like the hydrogen engine help link domestic policy with global action. They support Japan’s goal to build a full hydrogen value chain, from production to transport and end use.

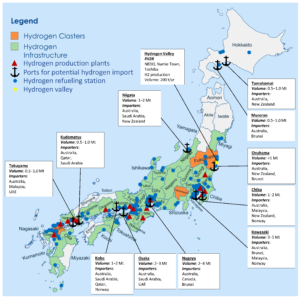
Japan hydrogen domestic landscape
Japan’s domestic hydrogen geographic landscape, including hydrogen clusters, infrastructure, production plants, potential import ports, and refilling stations. Source: Hydrogen 2025, 6(3), 61; https://doi.org/10.3390/hydrogen6030061

Current Hydrogen Ferries in Operation

Japan has already started using hydrogen-powered ferries on real routes. One example is the Hanaria. This hybrid ship uses hydrogen fuel cells, lithium-ion batteries, and biodiesel. It began service in Kitakyushu in April 2024.

The ship can cut carbon dioxide emissions by 53% to 100% compared to regular vessels. It was built for a unit of Mitsui O.S.K. Lines and uses fuel cell technology developed with parts from Toyota.

Another example is the Mahoroba, built by Iwatani Corporation. This is a zero-emission hydrogen catamaran that can carry up to 150 passengers. It started commercial service in April 2025, transporting visitors to the Osaka-Kansai Expo.

In October 2025, the Tokyo Metropolitan Government agreed to bring the vessel to Tokyo Bay. It is expected to start operating there in fiscal year 2026. It will support environmental education and international events.

Japan has also invested in hydrogen transport systems. One example is the Suiso Frontier, which was launched to carry liquefied hydrogen across long distances. These efforts show that Japan is not only testing technology but also building the systems needed to scale hydrogen use globally.

From Ferries to Freighters: Scaling Hydrogen at Sea

Japan is part of a wider global shift. Many countries are testing hydrogen and other clean fuels for shipping.

For example, Norway launched the MF Hydra in 2023. Belgium introduced the Hydrotug 1 in 2024.

However, most of these vessels are small or operate on short routes. Japan’s project targets large cargo ships, which are more complex and more impactful for emissions.

Governments are also exploring hydrogen shipping corridors. These are planned routes where hydrogen-powered vessels can operate with proper fueling infrastructure. This global activity shows that hydrogen is moving from early testing to larger applications.

A $300B Hydrogen Market Meets Maritime Demand

The hydrogen economy is expanding quickly. Global demand is rising as industries look for low-carbon solutions.

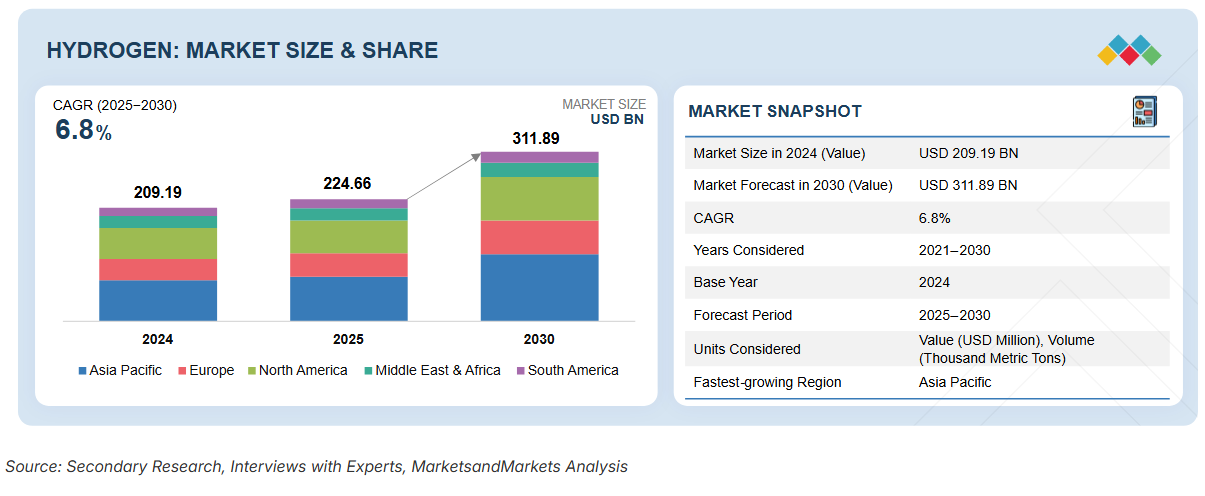
Industry estimates suggest the global hydrogen market could exceed US$300 billion by 2030. Growth is driven by energy, transport, and industrial use.

hydrogen market size and projection
Source: MarketsandMarkets

In shipping, hydrogen competes with other fuels like ammonia and methanol. Each has strengths and challenges. Hydrogen stands out for its zero carbon emissions at the point of use.

Cost, Storage, and Infrastructure Barriers

Still, hydrogen has limits. Several barriers remain before hydrogen ships become common:

  • High costs compared to traditional fuels,
  • Limited supply of green hydrogen,
  • Lack of port infrastructure, and
  • Strict safety requirements.

Despite these issues, investment is growing. Governments and companies are funding research, pilot projects, and infrastructure.

Japan’s demonstration project will help address those gaps. The planned three-year trial will provide real-world data on performance, safety, and costs. If successful, hydrogen engines could become a practical option for large vessels. This would help reduce emissions from global shipping.

Can Hydrogen Power the Future of Global Trade?

Japan’s hydrogen engine test marks a key moment for the shipping industry. It shows that hydrogen can power not only small vessels but also large commercial ships.

The link to Japan’s net-zero strategy makes this development even more important. It connects national policy with global climate goals.

The coming years will shape how fast hydrogen shipping grows. With strong policy support and continued innovation, hydrogen could play a major role in building a low-carbon maritime sector.

The post Japan Unveils First Hydrogen Engine for Large Ships appeared first on Carbon Credits.
Bioleaching Breakthrough in Canada: How MIRARCO’s Pilot Facility Turns Mine Waste into Critical Minerals

A new wave of innovation is reshaping how the mining industry approaches waste. CBC News, Canada, reported that researchers in Sudbury, northern Ontario, are developing a bacteria-based technology called bioleaching, which uses naturally occurring microbes to extract valuable metals such as nickel, cobalt, and copper from old mine tailings.

Led by MIRARCO Mining Innovation, the team recently opened a pilot facility in October 2025 to scale up this process, aiming to transform mining waste into a source of critical minerals while cutting emissions, reducing environmental risks, and unlocking billions of dollars in untapped resources.

Sudbury Moves Toward Commercial Bioleaching

Sudbury has a long history of mining, leaving behind massive piles of tailings—the leftover rock and sediment from ore extraction. These materials still hold billions of dollars’ worth of metals, but until now, recovering them was difficult, energy-intensive, and expensive. The bioleaching technology changes that. By using bacteria that naturally digest minerals, scientists can release metals from waste rock without relying on harsh chemicals or high temperatures.

According to Nadia Mykytczuk, CEO of MIRARCO, the new pilot facility represents a shift toward sustainable mining. She precisely mentioned that,

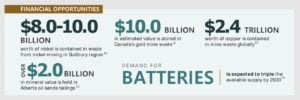
In Sudbury alone, the tailings contain $8 billion to $10 billion worth of nickel. With this facility, we are shaping a new era of mining innovation—one that focuses on clean technology, critical minerals, and preparing the workforce of tomorrow.

The facility connects research, industry, and community partners, creating a hub for applied research in bioleaching and bioprocessing.

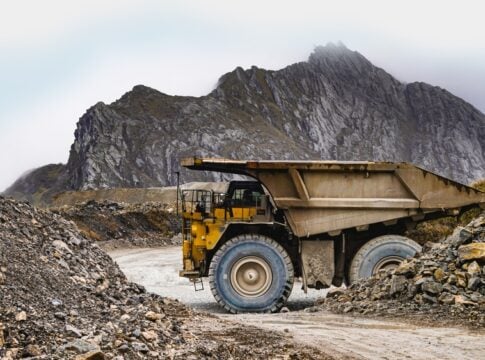
canada mining
Source: MIRARCO Mining

Before moving to the new facility, MIRARCO operated within Laurentian University, and the long-standing partnership continues. The pilot center allows researchers to handle larger samples of mine waste and test how bioleaching works at a scale closer to industrial operations. This is essential for proving that the process can be commercially viable in Canada.

Bioleaching Breakthrough: Turning Tailings into Critical Minerals

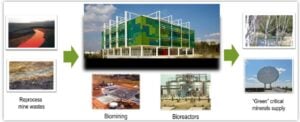
  • The process starts by grinding the mine tailings and mixing them with a nutrient-rich liquid. Scientists then introduce specialized bacteria into the mixture.
  • These microbes feed on the minerals, producing chemical reactions that dissolve metals into the liquid.
  • The resulting slurry moves through a series of reactors, where the process continues, and metals are eventually collected in a liquid form.

Early experiments are promising. Scientists at MIRARCO have noted that the process can recover 98–99 percent of nickel from the tested tailings. The value surpasses traditional methods that often leave large amounts of valuable minerals behind.

In separate research, scientists are growing and refining the bacteria. Different microbes target specific minerals. Some thrive in acidic conditions, ideal for breaking down sulfide tailings, while others focus on iron oxides or silicate rocks.

This flexibility allows scientists to extract not only common metals like nickel and copper but also rare earth elements and lithium, which are critical for batteries and renewable energy technology.

bioleaching
Source: Mirarco Mining

Environmental and Carbon Benefits

Traditional metal extraction uses energy-intensive methods, including high-temperature processing, chemical treatments, and heavy machinery. This approach produces substantial carbon emissions and generates more waste. Bioleaching operates at ambient temperature and pressure, reducing energy use by an estimated 30–40 percent.

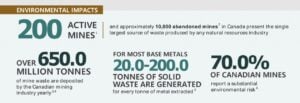
It also tackles the challenge of storing mining waste. Canada produces around 650 million tons of mine tailings every year. Much of this material sits in ponds behind dams, which can be unstable and pose long-term environmental risks.

Significantly, tailings may generate acid or release metals into the environment, and dam failures can have serious consequences. The 2014 Mount Polley mine tailings dam failure incident in British Columbia is a stark reminder of these dangers.

CANADA MINE tailings
Source: MIRARCO Mining

By turning tailings into a source of metals, bioleaching reduces the volume of waste requiring storage, cutting both environmental risk and the legacy costs of old mining sites.

Overcoming Challenges

While promising, the technology is not without hurdles. Processing tailings can be costly, and the bacteria require careful monitoring and specific growth conditions. Scaling up from pilot operations to full commercial production will also need investment in infrastructure and specialized equipment.

Environmental experts, such as MiningWatch Canada, note that tailings can behave unpredictably. They may chemically react over time or shift physically, posing stability concerns. Effective containment and monitoring are critical to ensure the process remains safe at larger scales.

Despite these challenges, researchers are optimistic. Early pilot studies indicate that the bacterial method could recover 65–80 percent of minerals left behind by conventional processing. This is a significant improvement that makes further investment worthwhile.

Fueling Canada’s Clean Energy Future

The technology comes at a crucial time. Global demand for critical minerals is rising as electric vehicles, wind turbines, and solar panels become more widespread. Canada has identified 31 minerals essential for the energy transition, but many are currently imported from regions with supply risks. Bioleaching offers a way to unlock domestic resources while reducing dependence on imports.

The process could provide materials for electric vehicle batteries, grid infrastructure, and industrial applications. Lithium and cobalt can power EVs, rare earth elements like neodymium and dysprosium support wind turbines and other clean energy systems, and copper and nickel are essential for electrical grids.

By recovering these from tailings, Canada could strengthen its supply chains while reducing environmental impact.

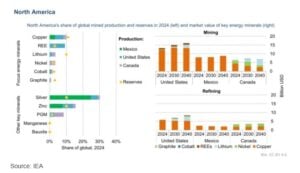
By 2040, the IEA expects the value of North America’s energy minerals to grow to around USD 30 billion for mining and USD 14 billion for refining. Mining growth will mainly come from copper in the United States and Mexico, and from lithium and nickel in Canada.

For refining, the region could make up about 4% of the global market, led by copper and lithium refining in the United States and copper and nickel refining in Canada.

canada critical minerals

Moving Toward Commercial Deployment

MIRARCO aims to transition from pilot testing to full-scale operations in the next two to three years. Globally, bioleaching is already in use at around 30 mining sites, but Canada has yet to deploy it commercially. The pilot facility in Sudbury is helping bridge that gap by testing continuous processing and demonstrating commercial viability.

Government support is also playing a key role. CBC further highlighted that funding through Canada’s Clean Technology Program and provincial innovation grants is helping advance research and development. The technology aligns with national goals to position Canada as a global leader in sustainable critical minerals production by 2030.

Overall, industry analysts predict bioextraction could become commercially viable within three to five years for specific minerals, with broader adoption following as operational experience grows.

The post Bioleaching Breakthrough in Canada: How MIRARCO’s Pilot Facility Turns Mine Waste into Critical Minerals appeared first on Carbon Credits.

Solar Plus Batteries Can Meet 90% of India’s Electricity Needs, Says Ember

A new analysis by Ember shows that solar energy, combined with battery storage, could meet up to 90% of India’s electricity demand at a lower cost than what most states currently pay for power. The findings highlight a major shift: clean energy is no longer just sustainable—it is becoming the most economical option.

India’s solar journey has already begun, but the real opportunity lies in scaling it up and making it available round the clock.

India’s Solar Potential Is Massive but Underused

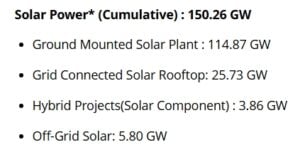
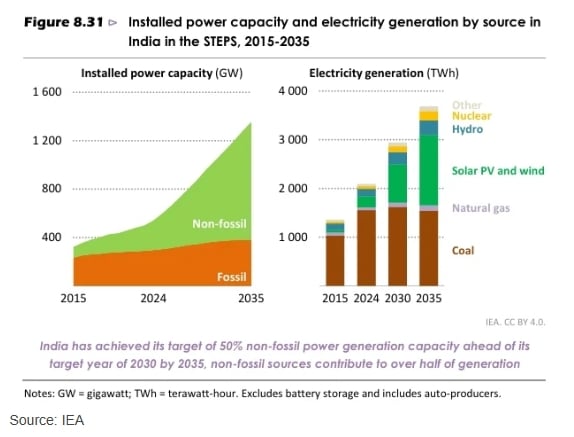
India’s cumulative solar capacity as of March 2026 was 150.26 GW. While this sounds significant, the Ember report states that it represents only about 4% of the country’s estimated 3,343 GW ground-mounted solar potential. In simple terms, India has barely tapped into its solar resources.

india solar
Source: MINISTRY OF NEW AND RENEWABLE ENERGY (MRNE) India

This untapped capacity is enormous. The total feasible solar potential could generate nearly three times the country’s electricity demand in 2024. Even more striking, this estimate uses only a small portion of available land—just 6.7% of suitable wasteland, which is less than 1% of India’s total land area.

Moreover, this figure excludes other major opportunities. Rooftop solar alone could add over 600 GW, while floating solar projects may contribute up to 300 GW. Technologies like agrivoltaics, which combine farming with solar panels, could further expand capacity.

Solar power is already making a visible impact. In 2025, it contributed 9.4% of India’s electricity. During peak sunny hours, it met nearly a quarter of demand. However, the challenge remains clear: solar stops working after sunset. To fully unlock its potential, India must solve the “night problem.”

Why Solar + Storage Makes 90% Clean Power Possible

Now, battery storage is the missing piece. It allows excess solar power generated during the day to be stored and used at night. Thanks to falling battery costs, this solution is now economically viable.

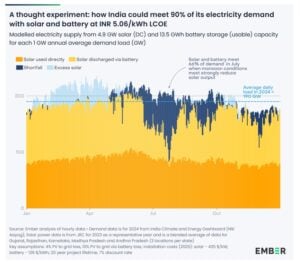
  • According to Ember’s modeling, solar combined with batteries can meet up to 90% of India’s electricity demand at a levelized cost of electricity (LCOE) of about INR 5.06 per kWh. This is cheaper than the average power purchase cost in many states today.

solar battery storage India

However, reaching 100% solar is not as simple. Each additional percentage beyond 90% requires significantly more solar panels and storage capacity. This leads to rising costs, making 90% the most practical and cost-effective target.

To meet this level of demand, India would need around 930 GW of solar capacity. This is still less than one-third of its total feasible ground-mounted potential. Alongside this, about 2,560 gigawatt-hours (GWh) of battery storage would be required.

In practical terms, for every 1 GW of average demand, the system would need about 4.9 GW of solar capacity and 13.5 GWh of storage.

Seasonal Patterns Shape Solar Performance

Solar energy does not perform the same way throughout the year. Its effectiveness depends heavily on seasonal patterns and weather conditions.

The Ember report further highlighted that during the early months of the year, from January to April, solar radiation is strong. In this period, solar and batteries can meet nearly 100% of daily electricity demand. Batteries store excess energy during the day and release it at night, ensuring a stable supply.

In peak summer months like May and June, electricity demand rises by about 10%. Even then, solar and storage can still meet around 88% of demand.

The real challenge appears during the monsoon season. Cloud cover reduces solar output significantly, especially in July. During this time, solar and batteries can meet only about 66% of demand.

This limitation is not due to battery capacity. Instead, it is caused by reduced solar generation over several cloudy days. Batteries can shift energy from day to night, but they cannot store large amounts of power for extended low-sunlight periods.

This is why a balanced energy mix is essential.

Wind and Hydro Will Fill the Gaps

India does not need to rely on solar alone. Other clean energy sources can complement solar power effectively.

Wind energy is especially important. It tends to generate more power during the monsoon months, when solar output is low. This natural balance helps stabilize the overall energy system.

Hydropower and nuclear energy can also provide steady, reliable electricity. Together, these sources reduce the need for excessive solar and battery capacity, keeping costs under control.

As a result, solar becomes the backbone of the system, while other clean sources fill in the gaps. Looking ahead, solar will play a major role in meeting energy demand. Around 50% of India’s additional electricity demand through 2030 is expected to come from solar power.

india solar

State-Level Trends Show Strong Potential

The feasibility of solar-plus-battery systems varies across states. This depends not only on sunlight availability but also on how and when electricity is used.

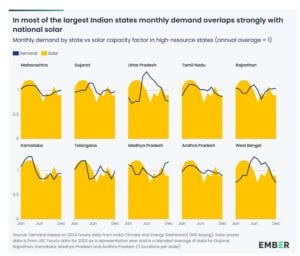
States like Andhra Pradesh, Maharashtra, Karnataka, Telangana, and Tamil Nadu show strong alignment between solar generation and electricity demand. In these regions, demand peaks during sunny months, making it easier for solar to meet a large share of electricity needs.

For example, demand in these states is often 10% to 29% higher than average during high-solar months. At the same time, demand drops during the monsoon, which helps offset lower solar output.

Other states like Gujarat, Rajasthan, and Madhya Pradesh also show favorable conditions. Their demand remains relatively stable throughout the year, which makes solar integration smoother.

india states solar

However, not all states are equally suited. Uttar Pradesh and West Bengal face more challenges. In these regions, electricity demand peaks during the monsoon, when solar output is weakest. This mismatch makes it harder for solar-plus-storage systems to meet demand efficiently.

These differences explain why the same solar and battery setup performs better in some states than others.

Transmission Will Unlock National Benefits

India’s renewable energy strategy already reflects a smart approach. Large-scale solar projects are being developed in high-resource states with strong sunlight and available land. At the same time, the country is expanding its transmission network to move electricity across regions.

This interconnected system allows solar-rich states to supply power to areas with higher demand or lower solar potential. It also improves the overall efficiency of the grid.

As transmission infrastructure grows, the benefits of solar and storage will spread across the country.

The analysis makes one thing clear: India has the resources to transform its power system. Solar energy, backed by battery storage, can deliver clean, reliable, and affordable electricity at scale.

  • In the broader context, the Asia-Pacific region led the global BESS market, generating USD 17.31 billion in 2025 and expected to reach USD 21.32 billion in 2026.

battery energy storage

However, the transition will require careful planning. Seasonal variations, regional differences, and the need for complementary energy sources must all be considered.

Still, the direction is clear. With falling costs and abundant resources, solar plus storage is no longer a future possibility—it is a present-day solution.

India now stands at a turning point. By scaling up solar and investing in storage and grid infrastructure, the country can move closer to a low-cost, low-carbon energy system that meets demand day and night.

The post Solar Plus Batteries Can Meet 90% of India’s Electricity Needs, Says Ember appeared first on Carbon Credits.