Surge Battery Metals Strengthens Nevada North With High-Grade Expansion and Infill Success

Surge Battery Metals (TSX-V: NILI | OTCQX: NILIF | FRA: DJ5C) delivered two strong updates from its Nevada North Lithium Project (NNLP) in February 2026. Together, these results confirm expansion potential, reinforce high-grade continuity, and advance technical work needed for the upcoming Pre-Feasibility Study (PFS).

On February 17, Surge reported a major step-out success. The company drilled a 31-meter intercept grading 4,196 ppm lithium from surface in a hole located 640 meters southeast of the existing resource boundary. This intercept sits well above the current resource average grade of 3,010 ppm lithium. The wide step-out confirms that high-grade mineralization extends significantly beyond the defined resource footprint.

Just one week later, on February 25, Surge released the final batch of results from its 2025 core drilling program. These infill holes focused on upgrading inferred resources to higher confidence categories and collecting technical data for the PFS. The results returned some of the strongest intercepts drilled to date.

Together, these two updates strengthen the project’s scale, quality, and development readiness. 

Infill Drilling Confirms a Thick, High-Grade Core

The February 25 news highlighted Hole NNL-030 as a standout result. The hole intersected 116 meters, averaging 3,752 ppm lithium. Within that interval, a 32.1-meter zone graded 4,521 ppm lithium. These grades exceed the project’s current average and confirm the presence of a thick, ultra-high-grade core.

Hole NNL-032 also delivered strong results, returning 82.29 meters, averaging 3,664 ppm lithium. Hole NNL-036 intersected 78.63 meters, averaging 3,141 ppm lithium, including a deep 9.4-meter zone grading 4,580 ppm lithium.

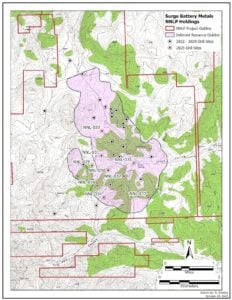
Surge Battery Metals North Nevada drilling results
Source: Surge Battery Metals

These intercepts show both lateral and vertical continuity. They show that high-grade lithium persists across wide widths and at depth. Importantly, most of these zones occur near the surface. Near-surface mineralization reduces stripping requirements and can improve early-year mine economics.

The infill drilling supports resource upgrading efforts. It helps convert Inferred resources into Indicated and Measured categories. Higher confidence categories are critical for mine planning, financing, and permitting.

The results confirm that Nevada North’s high-grade core is consistent, thick, and scalable.

Mr. Greg Reimer, President & Chief Executive Officer and Director of Surge, stated, 

“This infill drilling is doing exactly what it was designed to do: upgrade the resource, confirm continuity of some of our best lithium intercepts, and de-risk the early years of a potential mine plan at Nevada North. Coupled with a robust PEA economic profile, we believe Nevada North is strongly positioned as we move forward with the development of our PFS. We look forward to updating the Mineral Resource Estimate as our next key milestone.”

Expansion Beyond the Current Resource Boundary

The February 17 step-out result adds a new dimension to the project story. The 31-meter intercept grading 4,196 ppm lithium occurred 640 meters beyond the existing resource area. This large extension demonstrates strong mineral continuity outside the current pit-constrained model.

Step-out drilling is important because it tests the limits of a deposit. A successful 640-meter extension suggests the deposit remains open and may support future resource growth.

Nevada North already hosts a pit-constrained Inferred Resource of 11.24 million tonnes of lithium carbonate equivalent (LCE) grading 3,010 ppm lithium at a 1,250 ppm cutoff. High-grade step-out intercepts increase confidence that future resource updates may expand both tonnage and overall contained lithium.

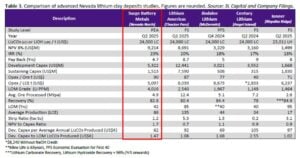
Surge Nevada lithium clay comparison

Highly anomalous soil values and geophysical surveys also suggest the clay horizons could extend even further. The mineralized zone currently spans more than 4,300 meters in strike length and over 1,500 meters in width. Continued drilling could increase the overall scale of the project.

This combination of strong infill and wide step-out success strengthens Nevada North’s long-term growth profile.

Advancing Toward Pre-Feasibility and Permitting

The 2025 drilling program did more than confirm grade. It also collected critical technical data required for the upcoming PFS and environmental permitting.

Hole NNL-035 was strategically positioned near Texas Spring to gather hydrogeological data. The hole successfully installed the Vibrating Wire Piezometers (VWPs) to monitor groundwater conditions. This data will help model basin hydrology and support environmental approvals.

The company also completed detailed geotechnical logging across all holes. High-resolution televiewer surveys mapped fault structures. Representative samples from each rock unit are now undergoing rock strength testing. These tests will help determine safe pit wall angles for future mine planning.

Remarkably, quality control procedures were rigorous. Of the 806 total samples analyzed, 134 were QA/QC samples. Certified reference standards, blanks, and duplicates were systematically inserted.

Standards are performed within acceptable limits. Duplicate samples fell within 10% tolerance. These results confirm strong analytical accuracy and reproducibility.

This technical work reduces development risk. This, in turn, ensures that the PFS is built on high-quality geological and engineering data.

Strategic Upside: By-Products and Strong Economics

In addition to lithium, the infill drilling consistently returned elevated cesium and rubidium values. Cesium reached up to 163 ppm and rubidium up to 349 ppm in association with the lithium core. Surge is evaluating the deportment of these elements in ongoing metallurgical studies.

If recoverable, these critical minerals could add value to the project economics. By-product potential can improve revenue streams and enhance overall project returns.

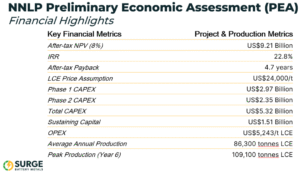
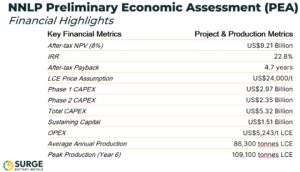
Nevada North already shows strong economic metrics from its Preliminary Economic Assessment. The PEA reports an after-tax NPV (8%) of approximately US$9.17 billion and an after-tax IRR of 22.8% at a lithium price of US$24,000 per tonne LCE. Operating costs are estimated at roughly US$5,243 per tonne LCE.

Surge - NNLP Preliminary Economic Assessment (PEA)

High grades play a central role in these economics. Thick intervals averaging 3,500–4,500 ppm lithium reduce the tonnage required to produce each unit of lithium. This supports lower operating costs and stronger early cash flow potential.

The joint venture with Evolution Mining also strengthens the project’s development pathway. Evolution is a globally recognized mining company with operational expertise. This partnership adds technical depth and financial strength to the Nevada North project.

A Strengthened Position in the U.S. Lithium Landscape

The United States is working to strengthen its domestic lithium supply chain. Federal incentives and policy measures emphasize secure, locally sourced battery materials. Projects that combine high grade, large scale, and technical readiness are well-positioned in this environment.

Nevada North now demonstrates three key strengths at once:

  1. Proven high-grade core through infill drilling,
  2. Expansion potential through 640-meter step-out success, and
  3. Advancing technical data for PFS and permitting.

These updates reinforce Nevada North as one of the highest-grade lithium clay projects in the United States. They show both growth and de-risking in the same drilling campaign.

As global demand for lithium continues to rise, supply sources with strong grade, scale, and development momentum will stand out. Surge Battery Metals’ recent results highlight meaningful progress on all three fronts.

The company’s Nevada North Lithium Project is not only expanding. It is advancing toward higher confidence resources, improved technical definition, and future development milestones. These combined achievements strengthen Surge’s position within the evolving North American lithium supply chain.

DISCLAIMER 

New Era Publishing Inc. and/or CarbonCredits.com (“We” or “Us”) are not securities dealers or brokers, investment advisers, or financial advisers, and you should not rely on the information herein as investment advice. Surge Battery Metals Inc. (“Company”) made a one-time payment of $50,000 to provide marketing services for a term of two months. None of the owners, members, directors, or employees of New Era Publishing Inc. and/or CarbonCredits.com currently hold, or have any beneficial ownership in, any shares, stocks, or options of the companies mentioned.

This article is informational only and is solely for use by prospective investors in determining whether to seek additional information. It does not constitute an offer to sell or a solicitation of an offer to buy any securities. Examples that we provide of share price increases pertaining to a particular issuer from one referenced date to another represent arbitrarily chosen time periods and are no indication whatsoever of future stock prices for that issuer and are of no predictive value.

Our stock profiles are intended to highlight certain companies for your further investigation; they are not stock recommendations or an offer or sale of the referenced securities. The securities issued by the companies we profile should be considered high-risk; if you do invest despite these warnings, you may lose your entire investment. Please do your own research before investing, including reviewing the companies’ SEDAR+ and SEC filings, press releases, and risk disclosures.

It is our policy that information contained in this profile was provided by the company, extracted from SEDAR+ and SEC filings, company websites, and other publicly available sources. We believe the sources and information are accurate and reliable but we cannot guarantee them.

CAUTIONARY STATEMENT AND FORWARD-LOOKING INFORMATION

Certain statements contained in this news release may constitute “forward-looking information” within the meaning of applicable securities laws. Forward-looking information generally can be identified by words such as “anticipate,” “expect,” “estimate,” “forecast,” “plan,” and similar expressions suggesting future outcomes or events. Forward-looking information is based on current expectations of management; however, it is subject to known and unknown risks, uncertainties, and other factors that may cause actual results to differ materially from those anticipated.

These factors include, without limitation, statements relating to the Company’s exploration and development plans, the potential of its mineral projects, financing activities, regulatory approvals, market conditions, and future objectives. Forward-looking information involves numerous risks and uncertainties and actual results might differ materially from results suggested in any forward-looking information. These risks and uncertainties include, among other things, market volatility, the state of financial markets for the Company’s securities, fluctuations in commodity prices, operational challenges, and changes in business plans.

Forward-looking information is based on several key expectations and assumptions, including, without limitation, that the Company will continue with its stated business objectives and will be able to raise additional capital as required. Although management of the Company has attempted to identify important factors that could cause actual results to differ materially, there may be other factors that cause results not to be as anticipated, estimated, or intended.

There can be no assurance that such forward-looking information will prove to be accurate, as actual results and future events could differ materially. Accordingly, readers should not place undue reliance on forward-looking information. Additional information about risks and uncertainties is contained in the Company’s management’s discussion and analysis and annual information form for the year ended December 31, 2024, copies of which are available on SEDAR+ at www.sedarplus.ca.

The forward-looking information contained herein is expressly qualified in its entirety by this cautionary statement. Forward-looking information reflects management’s current beliefs and is based on information currently available to the Company. The forward-looking information is made as of the date of this news release, and the Company assumes no obligation to update or revise such information to reflect new events or circumstances except as may be required by applicable law.

Carboncredits.com receives compensation for this publication and has a business relationship with any company whose stock(s) is/are mentioned in this article.

Additional disclosure: This communication serves the sole purpose of adding value to the research process and is for information only. Please do your own due diligence. Every investment in securities mentioned in publications of carboncredits.com involves risks that could lead to a total loss of the invested capital.

Please read our Full RISKS and DISCLOSURE here.

The post Surge Battery Metals Strengthens Nevada North With High-Grade Expansion and Infill Success appeared first on Carbon Credits.
ENGIE’s Brazil Solar Plant Explores Energy Storage and Bitcoin to Solve Grid Curtailment

ENGIE has officially brought its Assú Sol photovoltaic complex into full commercial operation. The French utility secured final approval from Brazilian authorities on February 13, 2026, after completing construction in December 2025. With a total investment of BRL 3.3 billion, the project now stands as ENGIE’s largest operational solar asset worldwide.

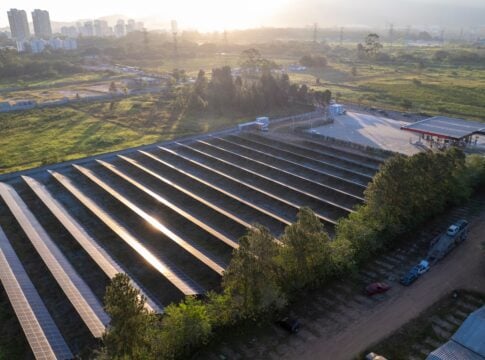
Located in Rio Grande do Norte in northeast Brazil, Assú Sol has an installed capacity of 895 MWp. The complex spans 2,344 hectares and consists of 16 solar plants. At full output, it can generate enough electricity to meet the annual demand of roughly 850,000 people.

  • In 2025, Brazil added 7.4 GW of new large-scale electricity generation capacity, driven primarily by over 2.81 GW of solar PV, according to the energy regulator Agência Nacional de Energia Elétrica (ANEEL).
  • In August 2025, ABSOLAR reported Brazil’s solar capacity hit 60 GW and forecasted strong distributed generation growth through 2030.

By January 1, 2026, the country’s total large-scale power generation capacity reached 215.9 GW, with renewables accounting for 84.6% of the mix. ANEEL projects a 23.4% increase in renewable capacity in 2026, equivalent to an additional 9.14 GW.

However, while the scale is impressive, the project also reflects a deeper shift underway in Brazil’s renewable energy market.

BRAZIL SOLAR

Assú Sol Delivers at Scale: Advanced Tech Powers Brazil’s Largest Solar Plant

ENGIE completed the project over 30 months, keeping it on schedule and within budget. More than 4,500 direct jobs were created during construction. The development required over 1.5 million solar modules, extensive cabling, and new internal road infrastructure.

Importantly, the company adopted advanced construction technologies. Drone-based aerial mapping improved site planning. Automated graders linked to 3D models enhanced precision. In addition, ENGIE deployed Brazil’s first dedicated automatic pile-driving machine for a solar project.

As a result, execution was faster, safer, and more efficient. Assú Sol demonstrates that large-scale renewables can be delivered with industrial discipline. Yet commissioning marked only the beginning of a more complex challenge.

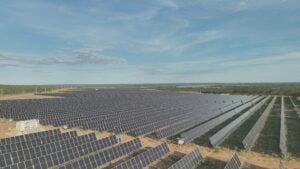
Assú Sol photovoltaic complex

Assú Sol photovoltaic complex engie
Source: Engie

Curtailment Pressures Test Solar Profitability

Despite reaching full operations, Assú Sol faces curtailment — a structural issue affecting Brazil’s clean energy sector since 2023. Curtailment occurs when renewable plants must reduce output because the grid cannot absorb all available electricity.

Brazil has added wind and solar capacity at record speed. At the same time, electricity demand has grown slowly. Distributed generation, especially rooftop solar, has also expanded rapidly. Consequently, supply often exceeds transmission capacity and real-time demand.

According to Reuters, ENGIE’s Brazil country manager Eduardo Sattamini confirmed that Assú Sol’s production has already been curtailed to balance the grid. Although specific volumes were not disclosed, the impact is material enough to prompt strategic adjustments.

In other words, renewable abundance does not automatically translate into revenue. Infrastructure constraints now shape project economics as much as generation capacity does.

How ENGIE Plans to Use Storage and Bitcoin

Reuters further revealed that to address this imbalance, ENGIE is evaluating two parallel strategies: battery storage and localized demand solutions such as bitcoin mining data centers.

Battery storage provides the most direct fix. By storing excess midday solar output and discharging it during peak demand hours, batteries reduce curtailment and improve grid stability. They also open access to ancillary service markets, strengthening revenue streams.

However, ENGIE is also studying a more unconventional model — using surplus electricity to power bitcoin mining operations. At first glance, the combination may seem unusual. Yet, from an energy economics perspective, it offers several compelling advantages.

Solar farms often produce maximum output during midday, precisely when grid demand can soften. Instead of shutting down generation, operators can redirect excess electricity to mining operations that can scale consumption up or down in real time.

This model delivers multiple strategic benefits.

  • Lower carbon intensity: Solar-powered mining sharply reduces emissions compared to fossil-fuel-based operations, helping reposition crypto infrastructure within a cleaner energy framework.

  • Flexible demand response: Mining facilities can quickly ramp power usage up or down, absorbing excess electricity during peak solar hours and easing pressure during grid stress.

  • Stable long-term energy costs: Solar generation offers predictable operating expenses after initial capital deployment, protecting operators from volatile power markets.

  • Improved asset utilization: Co-locating data centers with large solar plants maximizes land use and monetizes electricity that might otherwise be curtailed.

  • Diversified revenue streams: Developers gain an additional income channel beyond wholesale power sales, strengthening overall project economics.

Of course, integration comes with challenges. Both solar infrastructure and mining facilities require significant upfront investment. Moreover, energy supply must remain balanced to avoid operational disruptions. Smart-grid systems and, ideally, battery storage will play a critical role in stabilizing performance.

Sattamini made clear that such initiatives would take time to implement. Nonetheless, the strategy signals an evolution in renewable business models — from pure generation toward integrated energy ecosystems.

Community Development and Long-Term Strategy

The company has also invested in the Assú region’s social infrastructure. It supported the construction of a school, a health center, and sports facilities. It improved access to water and provided agricultural equipment to local communities. Such initiatives enhance local acceptance and reinforce the long-term sustainability of the project.

ENGIE’s Renewable and Storage Capacity Goal

Looking ahead, it aims to reach 95 GW of renewable and storage capacity globally by 2030. More than 80% of its planned capital expenditure aligns with the European Taxonomy framework, focusing on low-carbon generation, infrastructure modernization, green gas, and storage technologies.

The company currently operates 15.7 GW of fully renewable installed capacity across hydropower, wind, and solar assets. It also manages 3,200 kilometers of transmission lines and 22 substations.

Some significant achievements include:

  • In late 2025, ENGIE commissioned the Serra do Assuruá wind complex in Bahia, adding 846 MW of onshore wind capacity.
  • Meanwhile, the Asa Branca transmission project continues to expand grid infrastructure across several states, with more than 1,000 kilometers planned upon completion.
  • Another initiative, the Graúna transmission project, will further strengthen interconnections in southern Brazil.
engie decarbonization
Source: Engie

These investments are critical. Without stronger transmission networks, renewable curtailment will persist. Therefore, grid expansion and flexibility solutions must advance alongside generation growth.

As renewable penetration rises, profitability depends not only on installed megawatts but also on flexibility, storage, and innovative demand-side solutions. In that context, combining solar power with storage or even bitcoin mining may redefine how excess clean energy is valued.

And Assú Sol is part of ENGIE’s broader renewable expansion in Brazil, setting an example for renewable markets facing maturity challenges.

The post ENGIE’s Brazil Solar Plant Explores Energy Storage and Bitcoin to Solve Grid Curtailment appeared first on Carbon Credits.

Kazatomprom Deepens Strategic Ties with India in Major Long-Term Uranium Supply Deal

National Atomic Company Kazatomprom JSC, the world’s largest uranium producer, has moved closer to sealing a massive long-term supply deal with India. The Kazakh state miner announced that it plans to sell a significant portion of its natural uranium concentrates to India’s Department of Atomic Energy (DAE).

However, the transaction is so large that it requires shareholder approval under Kazakhstan’s Joint Stock Companies law. As a result, the company has called an Extraordinary General Meeting (EGM) at the initiative of its Board of Directors.

If approved, the agreement could tighten an already strained global uranium market.

A Deal That Could Reshape Uranium Supply

The proposed contract signed with the Directorate of Purchase & Stores (DPS) under India’s DAE, covers the long-term sale of natural uranium concentrates (U₃O₈) for physical delivery to India.

The value of the transaction equals or exceeds 50% of Kazatomprom’s total book asset value. Under Kazakh law, such a major transaction must go before shareholders for approval.

While pricing, volumes, and delivery schedules remain confidential due to commercial sensitivity, the scale alone signals its strategic weight.

Kazatomprom’s Q4 2025 Fourth-Quarter Uranium Output

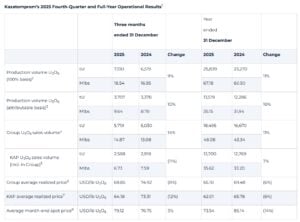
Kazatomprom currently accounts for about 20% of global uranium production. In 2025, it produced 25,839 tonnes of uranium (around 67.2 million pounds U₃O₈) on a 100% basis. That marked a 10–11% increase from 2024, driven largely by ramp-up at JV Budenovskoye.

  • Meanwhile, spot transactions increased sharply. Spot volumes rose 50% year-over-year to 55.3 million pounds U₃O₈ (around 21,270 tonnes), with an average price of $72.75 per pound.
  • Group sales volumes reached 5,719 tonnes (14.87 million pounds U₃O₈), up 14% from the previous year.
Kazatomprom uranium
Source: Kazatomprom

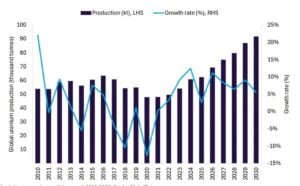
At the same time, global uranium mine production for 2025 was projected at 62.2 kilotonnes (ktU), according to industry estimates. Reactor demand stands higher at 68.9 ktU. This gap highlights a persistent supply deficit. Therefore, removing a sizeable share of Kazakh output under long-term contracts with India could tighten spot availability even further.

global uranium output
Source: Mining.com, data from Global Data

Fueling India’s Nuclear Ambitions: Why Uranium Imports Matter

India’s nuclear expansion explains the urgency behind this deal.

The country’s domestic uranium production currently meets only about 36% of its needs. Between 2025 and 2033, imports were projected to reach roughly 9,000 tonnes of uranium (tU) to support new reactor capacity.

India holds recoverable reserves estimated at 252,500 tU below $260/kgU. In addition, the Atomic Minerals Directorate for Exploration and Research (AMD), a unit of the Department of Atomic Energy, has identified 433,800 tonnes of in-situ U₃O₈ resources across 47 deposits in states including Andhra Pradesh, Jharkhand, Rajasthan, and Telangana.

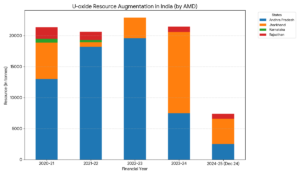
Mining at Jaduguda began in 1967 under Uranium Corporation of India Limited (UCIL). Recently, AMD discovered 26,437 tonnes of additional in-situ uranium oxide resources at the Jaduguda North–Baglasai–Mechua deposit in Jharkhand. This discovery is expected to extend the mine’s life significantly.

Still, domestic output alone cannot support India’s long-term reactor fleet expansion. Hence, securing a stable overseas supply has become a strategic priority.

The DPS, which handles procurement and inventory for India’s nuclear industry, accepted Kazatomprom’s commercial offer within its validity period. That move now awaits shareholder approval in Kazakhstan.

uranium output india
Source: Atomic Minerals Directorate for Exploration and Research (AMD)

Uranium Supply in a Shifting Geopolitical Landscape

The uranium market remains highly concentrated in 2025, and this proposed deal reflects a broader shift in global nuclear geopolitics.

  • Looking ahead, Kazatomprom’s 2026 production guidance stands at 27,500–29,000 tonnes on a 100% basis, slightly below nominal capacity due to sulphuric acid supply constraints. Group sales are expected at 19,500–20,500 tonnes.

If the India contract absorbs a major portion of future output, the free market could feel the impact quickly, especially given the structural supply gap.

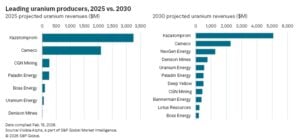
Reports say that by 2050, Kazakhstan and Canada are expected to dominate uranium exports. And in this market, uranium giants like Kazatomprom and Canada’s Cameco Corp. will dominate global revenue and production. Yet pricing trends have shown volatility. As demand for nuclear energy grows, countries are likely to form tighter supply alliances to secure fuel.

global uranium output

Balancing Strategy and Market Risk

At present, we can perceive that political tensions and energy security concerns are reshaping trade routes in oil and gas. And uranium may follow a similar path. Significantly, the IAEA has repeatedly noted that primary mining will remain the main source of uranium supply. Secondary sources, such as stockpiles and recycled materials, can only play a limited role.

Therefore, policymakers must rethink production and export strategies. Uranium-rich nations may reassess how much supply they allocate to long-term bilateral deals versus the open market.

For importing nations like India, long-term contracts provide stability. They reduce exposure to spot price volatility. They also strengthen diplomatic and economic ties. However, for the broader market, such agreements may reduce liquidity and amplify price swings during supply shocks.

The post Kazatomprom Deepens Strategic Ties with India in Major Long-Term Uranium Supply Deal appeared first on Carbon Credits.

Why Grade Matters More Than Ever in Lithium Clay Projects

Disseminated on behalf of Surge Battery Metals Inc.

Grade matters because it affects how much lithium a project can produce and how costly it is to operate. Higher grades generally mean more lithium can be recovered with lower costs. This matters for projects that want to compete in the fast‑growing electric vehicle (EV) and energy storage markets.

Let’s explore why grade is essential for lithium clay projects and learn how it affects economics, operations, and investor interest. More notably, we highlight how Surge Battery Metals’ Nevada North Lithium Project (NNLP) stands out in this context. 

What “Grade” Means in Lithium Projects

In mining, “grade” refers to how much lithium is present in a deposit. It is usually reported in parts per million (ppm) or as lithium carbonate equivalent (LCE). A higher grade means there is more lithium per tonne of rock.

For lithium clay, grades can vary widely. Some clay deposits have grades below 1,000 ppm. Others reach several thousand ppm. The higher the grade, the more lithium metal is available to extract.

U.S. lithium clay peers usually range from 800 to 2,540 ppm Li. Some areas are lower, at 120 to 766 ppm, like American Lithium’s Tonopah claims. Others can reach 1,690 to 2,900 ppm in drilling. Common cutoffs start at 1,000–1,250 ppm for economic viability, far above the <500 ppm in some global clays like Australia’s Kaolin resources.

Grade affects several key project factors:

  • Revenue potential – Higher grade means more lithium output per tonne of material moved.
  • Cost efficiency – Projects with a higher grade may spend less on mining and processing per unit of lithium produced.
  • Product quality – Higher-grade feedstock can result in higher‑purity lithium products, which are valuable in battery markets. 

Investors and developers pay close attention to grade because it is a strong indicator of future project performance.

Why Grade Matters More Than Ever

The global lithium market is changing fast. EV production is growing quickly. Energy storage systems are expanding. Demand for lithium is outpacing supply in many markets. This puts pressure on producers and developers to find the most competitive resources.

In this environment, grade has become a key differentiator among lithium clay projects. Several market trends explain why grade now matters more than ever:

  • Rising Demand for Battery‑Grade Lithium

Battery manufacturers require consistent, high‑purity lithium feedstock. Higher-grade deposits can deliver more lithium for refining into battery materials. They can also reduce the amount of waste material that needs to be processed. 

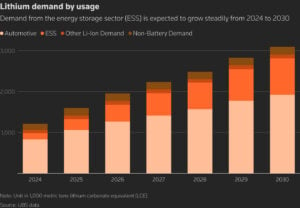
Global lithium demand is forecast to reach 2.4–3.1 Mt LCE by 2030 (from ~0.7 Mt in 2022), with batteries driving >90% growth. High-grade clays minimize waste in refining to meet this.

lithium demand by use 2030

  • Cost Pressures in Battery Supply Chains

Global competition in battery manufacturing pushes producers to lower costs. Projects with higher grades can reduce lithium production costs. This improves project economics and makes supply chains more resilient.

Higher grades cut opex by reducing tonnage processed. For instance, >3,000 ppm clays enable <US$6,000/t LCE vs. lower-grade brine equivalents >US$10,000/t.

  • Shift Toward Domestic Supply Security

Countries like the United States are prioritizing domestic lithium production. This is part of a broader energy and industrial policy. 

U.S. holds ~115 Mt lithium resources, per USGS 2025 data, up from 98 Mt in 2024. However, production is <1% global. IRA mandates 80% domestic or allied sourcing by 2027, favoring high-grade projects for faster permitting/offtakes.

Projects with strong grades are more likely to secure investment, permit approvals, and supply agreements. They offer clearer pathways to sustainable production.

In this landscape, projects with both good size and high grade stand out. They can produce more lithium with fewer inputs. They also attract stronger interest from investors and manufacturers looking for reliable sources of battery metals.

Nevada North: High-Grade Lithium in Action

Among lithium clay projects in the United States, Surge Battery Metals’ (TSX-V: NILI | OTCQX: NILIF) Nevada North Lithium Project (NNLP) is a standout example of why grade matters. NNLP hosts one of the highest‑grade lithium clay resources in the country. It also shows strong potential for expansion and future development.

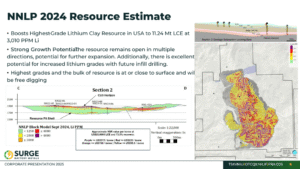
According to the 2024 resource estimate, NNLP now has an inferred resource of 11.24 million tonnes (Mt) of LCE at an average grade of 3,010 ppm lithium using a 1,250 ppm cutoff. This represents a significant increase in both size and quality compared to earlier estimates. It also positions NNLP as one of the highest‑grade lithium clay deposits in the United States.

NNLP 2024 resource estimate

Within that total resource, a core portion of 7.43 Mt of LCE grades 3,843 ppm lithium at a higher cutoff level. Higher cutoffs generally indicate more concentrated lithium zones, which are especially valuable for economic studies and future mine planning.

NNLP’s strong grades have grown progressively through drilling campaigns. In 2023, early drilling returned exceptionally high lithium values, including intervals that ranged up to 8,070 ppm lithium in specific clay horizons. These high grades were encountered close to the surface, which could simplify mining logistics.

Surge Nevada lithium clay comparison

Surge recently reinforced this grade advantage with new drilling results at NNLP. The company reported a 31-meter intercept grading 4,196 ppm lithium from surface in a 640-meter step-out hole to the southeast. This intercept is nearly 40% higher than the project’s current average grade of 3,010 ppm lithium. 

The 640-meter extension also confirms that high-grade mineralization continues well beyond the existing resource boundary. Near-surface grades above 4,000 ppm further support low stripping ratios and efficient future development.

Surge Battery Metals North Nevada drilling results

Mr. Greg Reimer, CEO, President, and Director of Surge, said,

“These drill holes materially enhance the scale of the Nevada North Lithium Project. Intersecting nearly 4,200 ppm lithium in a 640‑meter step-out to the southeast in NNL‑037 is a significant achievement. Not only is the system continuous, but we are encountering some of our highest grades at the very edges of the known footprint. It is increasingly clear that we have only begun to tap the true potential size of this premier lithium asset.”

NNLP’s resource is also shallow and laterally extensive. The deposit extends over kilometers of strike and remains open for expansion in several directions. This suggests that further drilling could add more tonnes or improve the average grade even further.

These characteristics give NNLP a competitive advantage. High grades can translate into lower production costs per tonne of lithium. They can also support strong economic outcomes as the project progresses toward prefeasibility and eventual development.

Economics Speak for Itself

High lithium grades help improve the economic profile of a project. For developers like Surge Battery Metals, this means stronger project metrics in studies such as preliminary economic assessments (PEAs).

In the case of NNLP, the high-grade and large resource support robust economic results. A recent PEA shows an after‑tax net present value (NPV) of US$9.21 billion and an internal rate of return (IRR) of 22.8% at a lithium price of US$24,000 per tonne LCE. These figures reflect the project’s ability to generate strong cash flows over its lifespan.

Surge-NNLP-Preliminary-Economic-Assessment-PEA

High grade also means that a project can produce significant lithium volumes without requiring excessively large mining operations. This can reduce environmental footprint, capital cost, and permitting complexity. The Nevada North deposit’s grades help make future processing and extraction more efficient.

For investors, grade is a key signal of potential project strength. Projects with grades well above the global average often trade at premium valuations relative to peers with lower grades. 

NNLP’s resource quality has attracted notable attention from analysts and market observers because it combines a strong grade with domestic location in a mining‑friendly jurisdiction.

The Strategic Edge in a Competitive Market

The lithium market will continue to evolve over the next decade. Global EV adoption and energy storage deployment are expected to drive demand for lithium to new highs. This will require reliable supply sources that can deliver consistent volume and quality.

In this context, grade will remain a core metric for comparing lithium clay projects. Deposits with higher grades are more likely to attract the capital, partnerships, and offtake agreements needed to advance through development phases. They also offer clearer economic paths compared to lower‑grade alternatives.

For Surge Battery Metals and its Nevada North Project, high grade is more than a number on a chart. It is a core advantage that differentiates NNLP from many peer projects. It supports strong resource economics, efficient processing potential, and a compelling narrative for domestic supply chain relevance in electric vehicle and battery markets.

As global competition for lithium intensifies, projects with both size and quality will stand out. NNLP’s high‑grade resource positions it as a leading example of how grade can influence outcomes in modern lithium clay development.


DISCLAIMER 

New Era Publishing Inc. and/or CarbonCredits.com (“We” or “Us”) are not securities dealers or brokers, investment advisers, or financial advisers, and you should not rely on the information herein as investment advice. Surge Battery Metals Inc. (“Company”) made a one-time payment of $75,000 to provide marketing services for a term of three months. None of the owners, members, directors, or employees of New Era Publishing Inc. and/or CarbonCredits.com currently hold, or have any beneficial ownership in, any shares, stocks, or options of the companies mentioned.

This article is informational only and is solely for use by prospective investors in determining whether to seek additional information. It does not constitute an offer to sell or a solicitation of an offer to buy any securities. Examples that we provide of share price increases pertaining to a particular issuer from one referenced date to another represent arbitrarily chosen time periods and are no indication whatsoever of future stock prices for that issuer and are of no predictive value.

Our stock profiles are intended to highlight certain companies for your further investigation; they are not stock recommendations or an offer or sale of the referenced securities. The securities issued by the companies we profile should be considered high-risk; if you do invest despite these warnings, you may lose your entire investment. Please do your own research before investing, including reviewing the companies’ SEDAR+ and SEC filings, press releases, and risk disclosures.

It is our policy that information contained in this profile was provided by the company, extracted from SEDAR+ and SEC filings, company websites, and other publicly available sources. We believe the sources and information are accurate and reliable but we cannot guarantee them.


CAUTIONARY STATEMENT AND FORWARD-LOOKING INFORMATION


Certain statements contained in this news release may constitute “forward-looking information” within the meaning of applicable securities laws. Forward-looking information generally can be identified by words such as “anticipate,” “expect,” “estimate,” “forecast,” “plan,” and similar expressions suggesting future outcomes or events. Forward-looking information is based on current expectations of management; however, it is subject to known and unknown risks, uncertainties, and other factors that may cause actual results to differ materially from those anticipated.

These factors include, without limitation, statements relating to the Company’s exploration and development plans, the potential of its mineral projects, financing activities, regulatory approvals, market conditions, and future objectives. Forward-looking information involves numerous risks and uncertainties and actual results might differ materially from results suggested in any forward-looking information. These risks and uncertainties include, among other things, market volatility, the state of financial markets for the Company’s securities, fluctuations in commodity prices, operational challenges, and changes in business plans.

Forward-looking information is based on several key expectations and assumptions, including, without limitation, that the Company will continue with its stated business objectives and will be able to raise additional capital as required. Although management of the Company has attempted to identify important factors that could cause actual results to differ materially, there may be other factors that cause results not to be as anticipated, estimated, or intended.

There can be no assurance that such forward-looking information will prove to be accurate, as actual results and future events could differ materially. Accordingly, readers should not place undue reliance on forward-looking information. Additional information about risks and uncertainties is contained in the Company’s management’s discussion and analysis and annual information form for the year ended December 31, 2025, copies of which are available on SEDAR+ at www.sedarplus.ca.

The forward-looking information contained herein is expressly qualified in its entirety by this cautionary statement. Forward-looking information reflects management’s current beliefs and is based on information currently available to the Company. The forward-looking information is made as of the date of this news release, and the Company assumes no obligation to update or revise such information to reflect new events or circumstances except as may be required by applicable law.

Carboncredits.com receives compensation for this publication and has a business relationship with any company whose stock(s) is/are mentioned in this article.

Additional disclosure: This communication serves the sole purpose of adding value to the research process and is for information only. Please do your own due diligence. Every investment in securities mentioned in publications of carboncredits.com involves risks that could lead to a total loss of the invested capital.

Please read our Full RISKS and DISCLOSURE here.

The post Why Grade Matters More Than Ever in Lithium Clay Projects appeared first on Carbon Credits.

Microsoft Hits 100% Renewable Electricity Milestone With 40GW Clean Energy Portfolio

Microsoft Hits 100% Renewable Electricity Milestone With 40GW Clean Energy Portfolio

Microsoft has achieved a major sustainability milestone by matching 100% of its global electricity use with renewable energy. The target, set in 2020, was part of the company’s wider climate goals and originally slated for completion by 2025.

The company bought enough clean power to meet all its electricity needs. This covers the total use at its data centers, offices, campuses, and facilities around the world for the year.

It is one of the largest corporate clean energy achievements ever recorded. The milestone shows how major energy buyers can boost renewable infrastructure and cut emissions.

Microsoft’s Chief Sustainability Officer, Melanie Nakagawa, said:

“This is an important step on our path to carbon negativity. Electricity is a major source of emissions for Microsoft – and for many organizations. Microsoft’s experience building our clean energy portfolio has served as an important catalyst in driving commercial demand for infrastructure and innovation across the power sector.”

The Scale of Microsoft’s Renewable Energy Portfolio

Microsoft’s renewable matching does not mean every kilowatt-hour it uses comes directly from clean sources every hour of the day. Instead, the company matched its total annual electricity use with clean energy it helped finance.

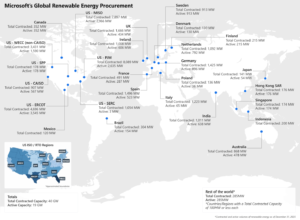
The tech giant’s renewable energy portfolio is extensive and global in scale. Since 2013, when the company signed its first 110 MW power purchase agreement in Texas, it has grown its clean energy commitments. As of 2025, Microsoft has contracted about 40 gigawatts (GW) of new renewable energy supply across 26 countries.

Microsoft clean energy potfolio
Source: Microsoft

Of this total, roughly 19 GW is already online and delivering electricity to the grid. The remaining 21 GW are expected to become operational during the next five years.

  • To help put this scale into context, 40 GW of renewable capacity is roughly enough electricity to power 10 million U.S. homes.

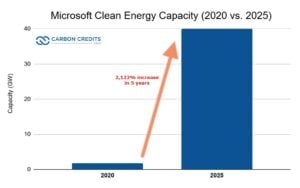
The big tech company quickly grew its renewable energy contracts. It went from about 1.8 gigawatts in 2020 to 40 gigawatts by 2025, showing an increase of around 2,100% in just five years. This sharp rise reflects the company’s accelerated clean energy procurement strategy.

Microsoft Clean Energy Capacity (2020 vs. 2025)

The scale of growth shows how quickly large technology firms are securing long-term clean power contracts to support expanding data center and AI operations while reducing emissions.

Microsoft’s clean energy contracts include solar, wind, hydro, and other renewables. These projects are built under long-term agreements called power purchase agreements (PPAs). These PPAs usually last 10 to 15 years, which gives renewable energy developers steady revenue. It also helps them fund new clean energy plants.

How Renewable Matching Works

Matching 100% of electricity use with renewables means Microsoft buys as much renewable energy as it uses each year.

The company achieves this mainly through long-term PPAs, which finance new generation capacity. PPAs occur when Microsoft contracts with renewable energy developers to buy power at a set price over many years.

Microsoft buys renewable energy in key U.S. markets like PJM Interconnection, MISO, and ERCOT. It also invests in renewable capacity in Europe, the Asia Pacific, and Latin America.

Renewables from grid programs and clean tariffs count toward the matching goal. This is true when they have long-term contracts, not short-term “spot” credits.

This approach helps ensure that Microsoft’s demand supports new renewable capacity, not just transfers ownership of existing clean power. Long-term contracts allow developers to build new projects.

SEE MORE on Microsoft: 

Powering the Path to Carbon Negative by 2030

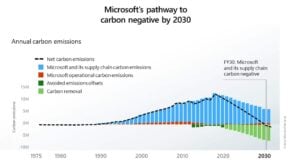
Matching 100% of electricity use with renewable energy is a central step in Microsoft’s broader climate strategy. In 2020, Microsoft announced a “moonshot” goal to become carbon negative by 2030. This means removing more carbon than it emits.

Microsoft 2030 carbon negative goal
Source: Microsoft

The renewable matching effort also helps reduce Scope 2 emissions, which are those associated with purchased electricity. Microsoft estimates it has cut its Scope 2 CO₂ emissions by around 25 million metric tons since starting its clean energy journey.

Microsoft’s renewable electricity commitment is part of a larger climate plan. This plan includes investing in carbon removal, improving efficiency, and exploring new technologies.

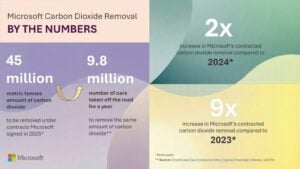
Microsoft carbon removals by the numbers 2025

The tech giant created a Climate Innovation Fund. It has invested hundreds of millions in energy systems, storage, and grid innovation.

The company closely tracks Scope 2 progress. It also tracks how fast artificial intelligence (AI) and cloud computing grow. This growth impacts total energy demand and emissions.

From Texas to India: A Global Procurement Strategy

Microsoft’s renewable energy contracts span many countries and energy markets.

In the United States, Microsoft has focused on major grid regions like PJM Interconnection (about 8,089 MW contracted), MISO (7,897 MW), and ERCOT (4,696 MW).

In Europe, the UK leads with about 1,666 MW of renewable capacity contracted, followed by Spain (1,496 MW) and Germany (1,425 MW).

Renewable capacity is also growing in the Asia Pacific. India leads with 1,011 MW, while Australia follows with 868 MW. This geographic diversity spreads investment. It also boosts renewable capacity in markets at different stages of energy transition.

Microsoft is exploring new procurement models and agreements. They are tailoring solutions for local markets and regulations.

Big Tech’s Expanding Role in Grid Decarbonization

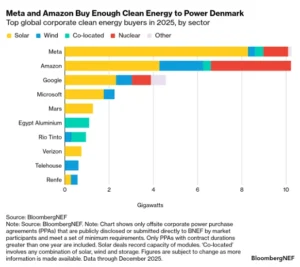
Microsoft’s renewable energy milestone reflects a wider shift in corporate clean energy demand. Bloomberg New Energy Finance reports that over 200 global companies have bought almost 200 GW of clean energy since 2008. Microsoft’s efforts are part of this broader trend.

Big tech companies like Google, Amazon, and Meta have pledged to use renewable energy for their data centers and operations. These companies typically use PPAs to finance new wind and solar projects around the world.

corporate clean energy purchases BNEF 2025

The renewable energy demand from major corporations helps mobilize capital, lower financing costs, and accelerate the deployment of clean infrastructure.

This market signal can boost investor confidence. It also encourages utilities to adopt cleaner generation plans. These plans align with long-term decarbonization goals.

Analysts say that matching yearly renewable energy use with clean electricity doesn’t mean all power use is emissions-free at every moment. Balancing electricity supply with demand each hour, known as 24/7 carbon-free electricity, is a tough task.

Microsoft’s milestone is a big win for corporate climate action. This is true even with the challenges faced.

Beyond Annual Matching: The 24/7 Clean Power Challenge

Microsoft says it will continue to conduct renewable energy contracting to support future growth and climate goals.

Through 2030, the company plans to maintain 100% annual renewable matching and expand into emerging markets. This includes looking into more carbon-free sources like nuclear power. It also covers grid-enabling technologies to meet clean energy needs anytime.

The company is also scaling partnerships to extend its clean energy footprint. It has several contracts with global energy partners that each provide more than 1 GW of capacity.

As energy demand from cloud and AI services continues to grow, Microsoft’s renewable portfolio and innovation efforts will be central to balancing electrification with climate commitments.

The post Microsoft Hits 100% Renewable Electricity Milestone With 40GW Clean Energy Portfolio appeared first on Carbon Credits.
Verra’s First DMRV Solar Project Pushes Carbon Credits into the Digital Era

Verra approved the first carbon credits under its new digital monitoring, reporting, and verification (DMRV) pilot. This move signals a major shift in how carbon credits are issued. Instead of waiting for annual verification cycles, projects can now receive high-frequency issuances, including monthly or bi-monthly approvals. As a result, the carbon market may become faster, more transparent, and more data-driven.

The first credits under this pilot came from the Foumbouni-Mitsamiouli solar farm project (Verra Project 3788) in the Union of Comoros.

Foumbouni-Mitsamiouli Solar Project Leads Verra’s Digital Carbon Shift

The project operates on Grande Comore Island, also known as Ngazidja. It was developed and is operated by Innovent Comores and Aera Group. The project follows the Clean Development Mechanism (CDM) methodology AMS I.D, which applies to grid-connected renewable electricity generation.

The solar initiative includes two photovoltaic parks, each with a capacity of 4 megawatt-peak (MWp). One is located in Foumbouni in the south of the island, while the other is in Mitsamiouli in the north. Together, the facilities use 10,080 solar modules rated at 405 Wp each. The panels are mounted on single-axis trackers with a backtracking system, which improves efficiency by adjusting panel angles throughout the day.

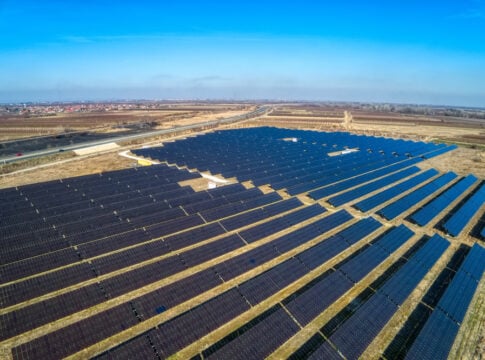
solar farm
Foumbouni-Mitsamiouli solar project: Aera

In addition, the project integrates 1 MW/2 MWh of battery storage. This storage system allows the solar plants to operate in hybrid mode and islanding mode. In simple terms, the plants can stabilize the grid and export clean power even when grid conditions fluctuate.

This development marked a turning point for the island’s energy system. Before the solar farms came online, the national utility SONELEC relied almost entirely on diesel-fired power plants. Electricity access remained below 60%, and supply was often unreliable. Diesel imports were costly and exposed the country to fuel price volatility.

Now, each plant generates around 12.7 gigawatt-hours (GWh) of electricity per year. On average, the bundled project reduces 9,384 tons of carbon dioxide equivalent annually. Beyond emissions cuts, the project strengthens national energy security and creates local employment opportunities.

Most importantly, it replaces fossil fuel-based electricity with renewable solar power. For a country that depended heavily on diesel generation, this shift is significant.

Fully Digital Verification Sets a New Standard for Carbon Credit Integrity

SustainCERT acted as the validation and verification body (VVB). It conducted a fully digital verification process. Project developers submitted monitoring data electronically, and the verification process took place entirely online. This marked the first successful digital verification under Verra’s DMRV pilot.

Verra Project Hub Powers a New Digital Era

Verra launched the DMRV pilot as part of a broader plan to digitize its entire project cycle. The organization aims to improve efficiency, reliability, speed, and transparency across the voluntary carbon market.

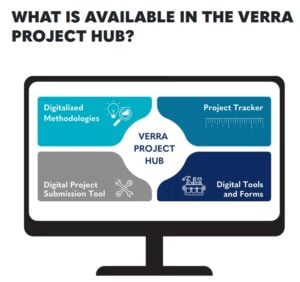
At the center of this transformation is the Verra Project Hub. This online platform serves as a comprehensive tool for creating and managing projects under Verra’s standards programs. It allows project proponents to submit validation, monitoring, and verification documents digitally. It also integrates directly with the Verra Registry, enabling faster issuance once approvals are granted.

The platform simplifies several steps in the project lifecycle. For example:

  • It enables the digital submission of monitoring data.
  • It automates calculations of emission reductions and removals using built-in engines aligned with approved methodologies.
  • It allows VVBs to access project records and submit verification reports directly.
  • It tracks milestones, deliverables, and reviews progress in real time.

As a result, stakeholders can collaborate more efficiently. Communication between project developers, VVBs, and Verra becomes smoother. At the same time, the system enhances transparency because documentation and data are centrally managed and traceable.

Verra is also digitalizing its most widely used methodologies. Templates collect all required project information in a structured format. A built-in calculation engine then computes emission reductions or removals for a given crediting period. This reduces human error and improves consistency across projects.

Verra digital carbon credits
Source: Verra

Digital Project Submission Tool for QC

In parallel, the Digital Project Submission Tool strengthens quality control. It checks data consistency and completeness using automated validation logic. If data is missing or incorrect, the system flags it immediately. Corrections can be made quickly, and all changes are logged for traceability. This improves auditability and builds trust among credit buyers.

Safeguards and Phased Credit Issuance

Under the DMRV pilot, Verra introduced a phased issuance structure to manage risks.

If a DMRV-based verification request for a high-frequency issuance installment is approved, the project proponent may request 80% of the approved credits. Verra withholds the remaining 20% as a safeguard during the pilot phase.

After one year of high-frequency issuances, the project must undergo a full traditional verification. This broader review covers additional elements such as safeguards, stakeholder engagement, and other non-digitized parameters. If Verra approves this non-DMRV-based verification request, the proponent can request issuance of the remaining 20%.

This structure balances innovation with risk management. It allows projects to benefit from faster cash flow while maintaining environmental integrity.

Verra is currently piloting this digital process for other project types as well. These include carbon capture and storage (CCS) activities and clean cookstove projects. If successful, the DMRV approach could expand across multiple sectors.

LATEST:

Carbon Market Supply and Demand Shift in 2025

While Verra pushes digital innovation, the broader carbon market also experienced notable changes in 2025.

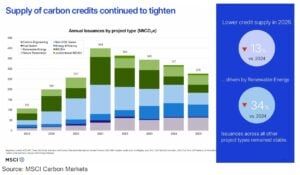
As of December 31, 2025, more than 10,200 projects were registered across 18 major carbon credit registries tracked by MSCI. During the year, these projects issued 294 million tonnes of carbon dioxide equivalent (MtCO2e). Since the Paris Agreement was signed in late 2016, cumulative issuances have surpassed 2.6 billion credits.

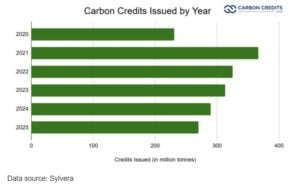
Also, according to Sylvera, new issuances declined to roughly 270 million tonnes in 2025. This marked the lowest annual issuance level since 2020.

sylvera carbon credits issuances

On the supply side, renewable energy credits saw the sharpest drop. For years, market participants debated their additionality. Many buyers increasingly viewed grid-connected renewable projects as having limited incremental climate impact, especially in markets where renewables are already competitive. As confidence weakened, fewer new renewable credits entered the market.

Nature-based projects still dominate overall volumes. Forestry and land-use projects remain the largest sources of issued and retired credits. However, even within this segment, the mix is evolving. Buyers now focus more on quality, permanence, and robust monitoring systems.

On the demand side, retirements fell slightly in 2025. Yet this does not necessarily signal declining corporate interest. The number of buyers remained relatively stable. What changed was purchasing behavior.

msci carbon credit demand and supply

Companies became more selective. They scrutinized methodologies, co-benefits, and verification standards more closely. In many cases, they shifted toward higher-integrity credits, even if volumes were lower. At the same time, price sensitivity increased in some segments.

Therefore, the market is not shrinking. Instead, it is maturing. Buyers demand stronger transparency, clearer impact, and better data.

Digitalization Could Restore Confidence

In this context, Verra’s DMRV initiative arrives at a critical moment. As the voluntary carbon market faces scrutiny over quality and additionality, digital monitoring and automated calculations can improve credibility.

High-frequency issuance also benefits project developers. Faster approvals improve cash flow and reduce administrative delays. Meanwhile, automated systems reduce manual paperwork and the risk of calculation errors.

For buyers, digital verification enhances confidence. Real-time data submission and traceable logs create a clearer audit trail. Over time, this may help rebuild trust in segments where credibility has weakened.

Ultimately, the Foumbouni-Mitsamiouli solar project represents more than just a renewable energy investment. It marks the beginning of a new digital chapter for carbon markets. If Verra successfully scales DMRV across sectors, the VCM could become more transparent, efficient, and resilient in the years ahead.

The post Verra’s First DMRV Solar Project Pushes Carbon Credits into the Digital Era appeared first on Carbon Credits.
Google Taps Earth’s Heat in 150MW Geothermal Deal with Ormat Technologies to Power Data Centers

Google Taps Earth’s Heat in 150MW Geothermal Deal with Ormat Technologies to Power Data Centers

Google has signed a long-term agreement with renewable energy company Ormat Technologies to bring new geothermal power to its data centers in Nevada, U.S.A. The deal could deliver up to 150 megawatts (MW) of electricity from geothermal sources under a special tariff program.

Ormat will develop a portfolio of geothermal projects across Nevada. These projects are set to come online between 2028 and 2030. Once operational, the electricity will support Google’s growing digital infrastructure.

The guide for this arrangement is NV Energy’s Clean Transition Tariff (CTT), a utility program designed to let large energy users buy new clean power while covering costs without shifting them to other customers.

The contract will begin when the first project starts commercial operation. It will run for 15 years beyond the final project’s completion, creating a long-term revenue stream for Ormat and a stable source of clean energy for Google.

Why Geothermal Delivers 24/7 Clean Baseload Power

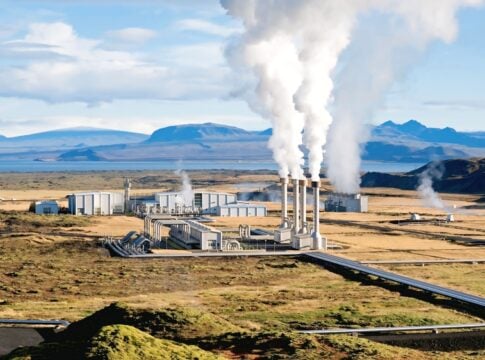
Geothermal energy uses heat from deep underground to generate electricity. It can run 24 hours a day, unlike solar or wind, which depend on sunlight or wind. This makes it a baseload power source — always available. That feature is critical for data centers, which require constant electricity.

Ormat is one of the world’s longest-standing geothermal power companies. It designs, builds, and runs plants that convert heat into electricity. Its global portfolio includes nearly 1,700 MW of capacity, with about 1,310 MW in geothermal and solar generation and 385 MW in energy storage.

Here’s how Ormat’s geothermal process works:

In recent years, the tech industry has shown rising interest in geothermal energy. Some operators, including Google, have already signed smaller geothermal power deals in other regions. For example, Google previously secured a 10 MW geothermal PPA in Taiwan and a separate arrangement to procure 115 MW of geothermal power from Fervo Energy in Nevada.

AI’s Energy Appetite and the Need for Clean Power

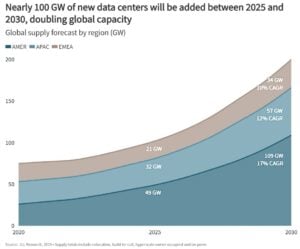
Data centers consume large amounts of electricity. They house computers that run search engines, Artificial Intelligence (AI), cloud services, and other digital tools. As digital activities grow, so does demand for power.

AI and advanced computing drive particularly strong electricity use. Without reliable clean energy sources like geothermal, data centers often depend on fossil fuels or intermittent renewables that don’t run continuously.

AI data center energy GW 2030

By partnering with Ormat, Google ensures a reliable, carbon-free power supply to meet its needs and reduce its environmental footprint. The new geothermal portfolio is expected to scale with future energy demand from AI and cloud computing workloads.

The Clean Transition Tariff (CTT) model used in this deal is designed so that Google pays full costs for its electricity. This limits cost impacts for other utility customers while enabling investment in new clean generation.

The Ormat–Google Deal: A 150MW Bet on Long-Term Clean Power

The Ormat–Google agreement covers up to 150 MW of geothermal capacity. To put that in context:

  • 150 MW can power tens of thousands of homes if it were used for residential consumption.
  • For data centers, it represents a meaningful share of electricity demand, especially as AI services expand.

The projects will ramp up over time. The first facilities are expected to start operating by 2028, with additional capacity coming online through 2030. This flexible build-out allows Ormat to expand the portfolio site by site.

The long-term nature of the contract, with a 15-year term after the final project completes, gives both Ormat and Google forecasting clarity. It assures stable revenue for Ormat and long-duration clean power for Google.

From Climate Pledges to Policy-Backed Power Deals

Google has long pledged to reduce its carbon footprint. It aims to operate on carbon-free energy 24/7 by 2030 across all its data centers and offices. This new geothermal deal aligns with that goal by adding dispatchable clean energy to its power mix.

Google carbon-free energy goal 2030
Source: Google

Geothermal energy can play a key role in meeting this aim because it provides baseload power that complements other renewables like wind and solar. Together, these sources help tech firms reach net-zero goals more reliably.

On the policy side, the extension of federal geothermal tax credits under U.S. law strengthens the economics of geothermal development. Programs such as the Oil and Gas Geothermal Tax Credit (OGBTC) and incentives in the Inflation Reduction Act (IRA) have expanded support for geothermal and other clean technologies.

The Clean Transition Tariff is another policy signal. It creates a scalable structure that utilities in other U.S. markets might adopt. This could help large users, not just Google, secure new clean generation that aligns with climate and reliability goals.

Tech Giants Turn to Deep Earth Energy

The Ormat–Google deal fits a broader industry trend. As demand for reliable, low-carbon power grows, more tech and cloud companies seek direct ties to physical clean energy projects.

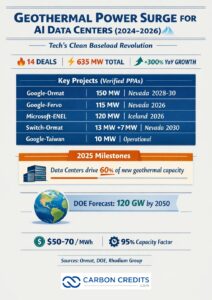
Tech giants signed 14 geothermal PPAs totaling 635 MW in 2025 alone, up 3x from 2024. Data centers now drive 60% of new geothermal capacity, targeting 120 GW by 2050, per DOE’s forecast.

geothermal energy infographics

One example is Switch, a major data center operator that signed a 20-year Power Purchase Agreement (PPA) with Ormat to supply about 13 MW of geothermal power from the Salt Wells plant in Nevada. That agreement begins energy deliveries around 2030, contingent on upgrades to the facility.

Switch’s PPA also includes an option to add roughly 7 MW of solar PV to support the geothermal site’s auxiliary needs. This hybrid approach supports stability and broader sustainability objectives.

Other tech giants are exploring geothermal and other firm clean energy sources, recognizing that intermittent renewables alone cannot supply constant power for large computing loads. Key deals are:

  • Google-Fervo: 115 MW enhanced geothermal (Nevada, online 2026) via NV Energy CTT—Ormat deal doubles Google’s NV commitment.
  • Microsoft-ENEL: 120 MW Hellisheidi (Iceland, operational 2026)—world’s largest geothermal data center link.
  • Google-Taiwan: 10 MW PPA (operational).

These moves underline a broader shift toward long-term, grid-connected clean power strategies. Grid-tied PPAs signal seismic shift: tech won’t wait for battery breakthroughs.

For Google, geothermal unlocks 24/7 carbon-free baseload when it needs it online: 2028, matching the NV data center expansion phase.

A Blueprint for Future Clean Power Partnerships

The Ormat–Google geothermal deal could serve as a model for future clean power partnerships. If the Nevada Public Utilities Commission approves the agreement in late 2026, the structure may be replicated in other states.

Developers may use similar portfolio PPAs to build geothermal and other clean energy projects. Utilities and policymakers may also adopt clean transition tariffs or flexible frameworks that allow large users to co-finance new clean generation.

For Google, securing scalable clean power helps future-proof data centers against rising energy demand from AI and cloud services. For Ormat, the deal provides long-term revenue and validates its strategy to expand geothermal capacity.

Geothermal energy, once a niche clean source, is gaining traction as a firm, reliable part of the renewable mix. And as digital infrastructure grows, deals like this one show how deep underground heat can power the next wave of cloud and AI computing sustainably.

The post Google Taps Earth’s Heat in 150MW Geothermal Deal with Ormat Technologies to Power Data Centers appeared first on Carbon Credits.
Rio Tinto’s HY25 Profit Falls 14%, but Copper Projects and Sustainability Efforts Stand Out

Rio Tinto delivered a mixed but resilient performance in the full-year 2025. While weaker iron ore prices weighed on profits, strong copper growth and disciplined cost control helped the mining giant keep earnings stable and maintain its dividend.

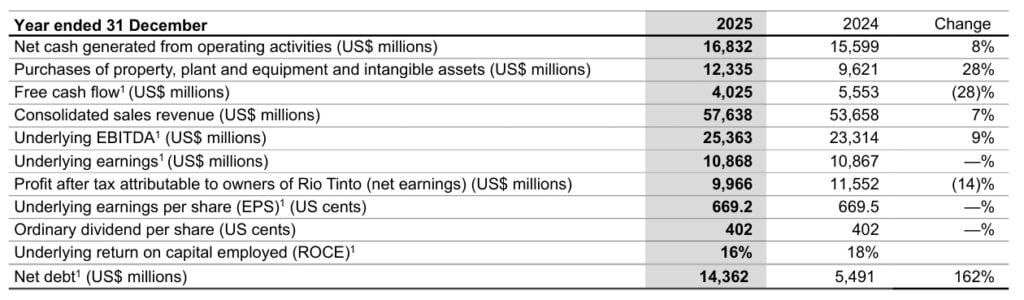
The world’s largest iron ore producer reported underlying earnings of $10.87 billion for the year ended December 31, unchanged from 2024. However, net profit fell 14% to $9.97 billion, compared to $11.55 billion a year earlier.

Despite the profit decline, Rio Tinto kept its shareholder payout steady. It declared an ordinary dividend of $6.5 billion, maintaining a 60% payout ratio. This marked the tenth straight year the company paid at the top end of its target range.

rio tinto earnings
Source: Rio Tinto

Iron Ore Softens, Copper and Aluminium Step Up

Lower iron ore prices hurt earnings. As the backbone of Rio Tinto’s business, iron ore remains critical. However, copper and aluminium delivered strong support.

Copper production rose 11% year over year. The key driver was the ramp-up of the Oyu Tolgoi underground project in Mongolia, where output surged 61%. This project is now complete and will play a major role in future copper growth.

Aluminium also performed well across the value chain. The company achieved record annual bauxite production of 62.4 million tonnes. As a result of higher volumes and better productivity, Rio Tinto reduced operating unit costs by 5% in real terms during 2025.

rio tinto copper
Source: Rio Tinto

Operational cash flow strengthened. Net cash from operating activities rose 8% to $16.8 billion. Meanwhile, underlying EBITDA climbed 9% to $25.4 billion. These gains reflected operational discipline and tighter cost management.

Looking ahead, the company aims to deliver a 4% compound annual unit cost improvement through 2030. It also expects productivity initiatives to generate $650 million in annual benefits by early 2026.

Big Projects Drive Future Growth

Rio Tinto made significant progress across its global project pipeline in 2025. The major milestones are explained below:

Simandou Iron Ore Project

The Simandou project in Guinea reached a major milestone. The company shipped its first high-grade iron ore in December. This project is expected to strengthen long-term supply and improve product quality.

Pilbara Replacement Mines

In Western Australia’s Pilbara region, the Western Range replacement mine opened on time and on budget. Additionally, construction began at three more brownfield iron ore mines. Four of the five major replacement projects are now either ramping up or under construction.

Copper Expansion

The Oyu Tolgoi underground development is complete. Rio Tinto also achieved first production of Nuton copper at the Johnson Camp mine. The company remains on track to deliver 3% compound annual growth in copper-equivalent production through 2030.

Lithium Growth

In March, Rio Tinto closed its acquisition of Arcadium ahead of schedule. The focus now shifts to advancing lithium projects in Argentina and Canada. The company targets 200,000 tonnes per year of lithium carbonate equivalent capacity by 2028.

Together, these projects strengthen Rio Tinto’s position in future-facing commodities like copper and lithium, which are essential for electrification and the energy transition.

Strong Balance Sheet and Capital Discipline

Despite profits falling, Rio Tinto’s financial position remains solid. Its strong cash flow supports consistent dividends and future investment. The company plans to unlock between $5 billion and $10 billion from its asset base. It is currently reviewing options for its borates and titanium dioxide (TiO₂) businesses and considering infrastructure monetization.

Management also streamlined operations. It reduced its structure from four product groups to three core divisions, i.e., iron ore, aluminium & lithium, and copper

Additionally, the company reduced contractor numbers and discretionary spending. It also placed the Jadar project into care and maintenance and stopped non-core studies. These steps sharpened its focus on value-generating assets.

Climate Action: Progress with Challenges

Sustainability remains an important part of Rio Tinto’s long-term strategy. The company spent $612 million on decarbonization initiatives in 2025, up from $589 million in 2024

In 2025:

  • Gross Scope 1 and 2 emissions were 31.5 million tonnes of CO₂ equivalent, down 14% from the 2018 baseline of 36.7 million tonnes.
  • Scope 3 emissions, which include customer use of products, reached 575.7 million tonnes of CO₂ equivalent. These emissions represent the largest share of its climate footprint. After applying high-quality carbon offsets, net emissions were 17% below baseline.
rio tinto emissions
Source: Rio Tinto

However, progress slowed compared to prior years. Emissions fell by just 0.2 million tonnes from 2024 levels. Increased production in iron ore and copper partly offset reductions.

Renewable Energy Contracts and Carbon Credits

The mining giant relies on renewable energy contracts and renewable diesel use, especially at its Kennecott site. It also retired about 1.01 million Australian Carbon Credit Units (ACCUs) to meet regulatory requirements.

Still, the path to its 2030 target of a 50% reduction in Scope 1 and 2 emissions depends on third-party renewable projects and successful commercial agreements. These factors remain outside the company’s direct control.

Around 7% of its electricity came from renewable sources, slightly lower than 78% in 2024 due to accounting adjustments in reported figures.

renewable energy
Source: Rio Tinto

Environmental and Water Management

Air quality indicators such as NOx, SOx, and fluoride levels remained relatively stable over five years. However, PM10 levels increased slightly over the past three years. To reduce emissions at the source, Rio Tinto continues to upgrade equipment with best-available technologies. It also expands air monitoring networks around its operations.

Water management improved in 2025. Total operational water withdrawals declined to 1,147 gigalitres, down from 1,250 gigalitres in 2024. Freshwater withdrawals also fell slightly to 386 gigalitres.

Water recycling increased to 374 gigalitres, showing better reuse practices. Meanwhile, total water discharges dropped to 626 gigalitres.

The company advanced several community-focused water initiatives, including implementing a new water strategy at QIT Madagascar Minerals. It also increased transparency by publishing detailed water performance data.

The Bigger Picture

Overall, Rio Tinto delivered steady underlying earnings in a challenging pricing environment. Iron ore weakness pressured profits, yet copper and aluminium provided strong support.

At the same time, disciplined capital allocation, operational efficiency, and large-scale project execution strengthened its long-term outlook.

Looking forward, growth will rely heavily on copper and lithium. These metals sit at the heart of global electrification and decarbonization trends. If Rio Tinto delivers on its cost improvements and project milestones, margins and cash flow could improve further.

However, climate targets remain ambitious. Achieving deeper emissions cuts will require faster renewable energy deployment and broader collaboration across its value chain.

In short, 2025 showed resilience rather than rapid growth. Rio Tinto balanced shareholder returns, project expansion, and sustainability progress. Now, its future depends on executing its copper-led strategy while navigating commodity cycles and climate commitments.

The post Rio Tinto’s HY25 Profit Falls 14%, but Copper Projects and Sustainability Efforts Stand Out appeared first on Carbon Credits.
Silver in 2026 and Beyond: Rising Prices, Solar Substitution, and a Market Still in Deficit

Silver entered 2026 with strong momentum. Prices surged over the past year. Industrial users adjusted to rising costs. Investors returned to the market. At the same time, solar manufacturers began cutting silver use to save money.
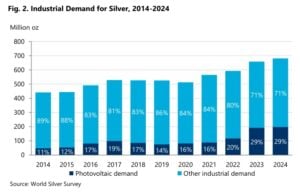
Even with a higher supply, the global market stayed in deficit for the sixth straight year. In short, silver’s story in 2026 is one of tight supply, shifting demand, and rising importance.

Silver Prices Rise as Investors Return

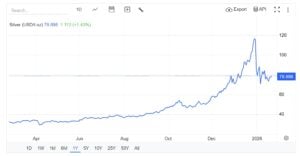
Silver prices recently stayed above $78 per ounce, helped by geopolitical tensions and light trading in Asia. After a volatile stretch, the metal was on track for its first weekly gain in four weeks.
silver prices

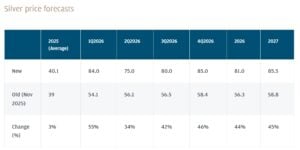
J.P. Morgan projects silver could average $81 per ounce in 2026, more than double its 2025 average. Yet the forecast depends on global demand and economic conditions. In 2025, silver jumped by over 130%. Industrial demand and tariff uncertainty fueled the rally. Later, U.S. Federal Reserve rate cuts boosted investor interest.
silver prices
Source: J.P. Morgan Commodities Research, $/oz, quarterly and annual averages.

However, high prices bring challenges. Investors benefit, but industrial users face rising costs. Prolonged price pressure could reduce demand and cause more volatility.

Solar Manufacturers Cut Usage as Costs Climb

One of the most significant shifts in 2026 comes from the solar sector. According to BloombergNEF, solar manufacturers—the largest industrial consumers of silver—are accelerating efforts to reduce silver intensity in photovoltaic (PV) modules.

Silver demand from PV installations is expected to fall to roughly 194 million ounces, or about 6,028 metric tons, this year, marking a 7% year-on-year decline. This drop comes even as global solar capacity continues to expand by around 15%.

Simply put, as manufacturers are using less silver per cell, total silver demand from the sector is projected to decline.

Rising costs explain the shift. Silver now accounts for an estimated 17–29% of PV module costs per watt, up sharply from just 3% in 2023. As prices climbed toward and even above $80 per ounce, manufacturers intensified substitution efforts.

silver demand

Chinese Solar Makers Lead the Silver Substitution Push

Chinese producers are leading the transition. Longi Green Energy Technology Co. announced plans to replace silver with base metals such as copper in its back-contact cells, with mass production expected in the second quarter of 2026. Similarly, Jinko Solar Co. signaled large-scale copper-based panel production, while Shanghai Aiko Solar Energy Co. has already launched silver-free solar cells.

However, substitution remains technically challenging. Copper can increase assembly costs and raise reliability concerns. Moreover, certain technologies, such as TOPCon cells, are less compatible with alternative metals due to high-temperature fabrication processes. As a result, silver continues to play a central role in high-efficiency solar designs, even as overall usage declines.

So, What’s Fueling Silver Demand in 2026?

Industrial Segments

Although solar demand softens, other industrial segments continue to support silver consumption. The Silver Institute highlighted strong structural growth in data centers, artificial intelligence infrastructure, and the automotive sector. This is because it conducts electricity better than almost any other metal. As electrification and digital growth continue, these sectors help support steady industrial demand.

silver demand

Investment Demand

On the other hand, investment demand is rising. Global physical investment is forecast to increase about 20% to 227 million ounces, reaching a three-year high. Western investors are returning after several weak years, supported by strong prices and economic uncertainty. At the same time, investment demand in India remains strong, helped by positive sentiment and recent gains.

Supply Growth Fails to Close the Gap

On the supply side, total global output is projected to increase 1.5% in 2026, reaching a decade high of 1.05 billion ounces. Mine production is expected to rise modestly to around 820 million ounces, supported by stronger output from existing operations and recently commissioned projects.

  • Growth is anticipated in Mexico’s primary silver mines and at China Gold International’s Jiama polymetallic mine.
  • In Canada, new and expanding projects such as Hecla’s Keno Hill and New Gold’s New Afton are contributing additional supply.
  • By-product silver from gold mines is also expected to increase, with gains from operations including Barrick’s Pueblo Viejo in the Dominican Republic and Gold Fields’ Salares Norte in Chile.

Recycling is expected to climb 7%, surpassing 200 million ounces for the first time since 2012. High prices encourage consumers to sell scrap, especially silverware.

Even so, the market remains undersupplied. The Silver Institute forecasts a 67 million-ounce deficit in 2026. As a result, the market relies on stored silver reserves, adding pressure to an already tight supply.

BHP and Wheaton Strike a Record Silver Deal

Corporate activity reflects silver’s strength. BHP entered a long-term streaming agreement with Wheaton Precious Metals Corp. BHP received $4.3 billion upfront in exchange for silver linked to its share of production at the Antamina mine in Peru.

This deal, the largest streaming transaction by upfront payment, lets BHP monetize silver as a by-product while keeping full exposure to copper, zinc, and lead. It doesn’t affect BHP’s joint venture rights or customer contracts.

Strategically, the deal shows how miners turn non-core metals into cash to strengthen balance sheets and fund growth projects.

2030 Outlook: Silver Demand and Supply

A research paper published recently looked at how much silver the solar industry may require by 2030. It also considered demand from other industries that use silver, such as electronics and automotive.

The findings raise concerns.

  • By 2030, total silver demand could reach 48,000 to 54,000 tons per year. However, supply may only cover 62% to 70% of that need. In other words, the world could face a serious silver shortage.

Solar is expected to be the fastest-growing source of demand. The industry alone may require 10,000 to 14,000 tons per year, which could account for 29% to 41% of total supply. At the same time, other industries will continue to use large amounts of silver. Even with slower growth, demand from these sectors could still reach 38,000 to 40,000 tons per year by 2030.

silver demand supply forecast
Source: Science Direct

In conclusion, the silver market continues to run in deficit. As long as supply lags total demand, prices may stay high. At the same time, higher prices could speed up substitution and increase volatility.

The post Silver in 2026 and Beyond: Rising Prices, Solar Substitution, and a Market Still in Deficit appeared first on Carbon Credits.