China’s lithium market is sending a mixed signal. Lithium prices have dropped to their lowest level in five months as traders look ahead to a possible oversupply in 2027. Yet, demand from electric vehicles (EVs) and battery storage remains strong.
The market is no longer reacting to today’s conditions. Instead, traders are pricing in what the industry could look like over the next two years.
The shift marks a new phase for the lithium industry. After years of worrying about shortages, investors are asking whether new mines and processing plants will produce more lithium than the market needs. Even so, analysts remain confident that global electrification will continue to support long-term demand.
Lithium Prices Drop as Traders Look Beyond 2026
China’s most-active lithium carbonate futures contract on Guangzhou Futures Exchange fell to 143,999 yuan (US$21,282) per tonne, its lowest level since February. Prices now sit about 31% below their May high level.
The decline does not reflect weaker demand. Instead, traders are focusing on a possible supply surplus in 2027. New lithium projects will add more material to the market over the next two years.
China will also introduce a 2% battery consumption tax in September 2026, then raise it to 4% a year later. Some analysts say the higher tax may slow battery demand over time, although it could encourage buyers to make purchases earlier.
Supply expectations are changing, too. China’s battery giant CATL plans to restart production at its Jianxiawo lithium mine. The restart will add up to 45,000 tonnes of lithium supply during the second half of the year and help narrow the current supply gap.
Despite weaker prices, market fundamentals remain healthy. Lithium inventories continue to fall, while demand from EV makers and energy storage projects stays resilient.
EVs and Battery Storage Keep Demand Strong
While lithium prices have weakened, demand continues to grow.
The International Energy Agency (IEA) reports that global electric car sales topped 21 million vehicles in 2025. EVs accounted for about 25%, or one in four, of all new passenger car sales worldwide. The agency also forecasts continued growth as battery prices decline and more affordable EV models enter the market.
China remains the world’s largest EV market. According to the China Association of Automobile Manufacturers (CAAM), EVs made up 58.5% of all new vehicle sales in June 2026, the highest monthly share on record.
Source: CnEVPost
First-half EV sales reached 7.45 million vehicles, up 7.3% from a year earlier. EV exports climbed 120% year over year during the same period.
Energy storage has also become a major driver of lithium demand.
As countries add more solar and wind power, they need batteries to store electricity and balance the grid. Reuters reports that lithium demand from energy storage could grow 55% in 2026, following 71% growth in 2025. By 2026, the sector could consume nearly one-third of the world’s lithium, making demand less dependent on EV batteries alone.
These trends explain why many analysts view the recent price decline as a response to future supply, not weaker demand. Even if the market moves into surplus in 2027, global lithium consumption will continue to grow as countries expand clean transport and renewable energy.
More supply is driving the weaker price outlook. The IEA reports that global investment in critical minerals reached a record high in 2024, with lithium remaining one of the fastest-growing sectors. Producers in Australia, Argentina, Chile, China, and Africa are expanding existing mines while bringing new projects online.
Chile, the world’s second-largest lithium producer, is increasing output. Codelco and SQM are expanding operations in the Salar de Atacama, while Argentina continues to attract billions of dollars in new lithium investments.
The country’s two largest producers are planning a major expansion that could increase output from their joint venture by more than 70%. Moreover, as part of a $3 billion upgrade in the Atacama Desert, the Novandino venture said it aims to raise annual lithium production to 470,000 metric tons, up from the 270,000 tons expected in 2026.
Benchmark Mineral Intelligence forecasts that new supply will outpace demand growth in 2027. That imbalance would put additional pressure on lithium prices even as global consumption keeps rising.
Lower Prices Could Speed Up the Energy Transition
Lower lithium prices also create opportunities.
Cheaper lithium reduces battery costs, making electric vehicles and energy storage systems more affordable. According to the IEA, average battery pack prices fell below US$100 per kilowatt-hour (kWh) for the first time in 2024, reaching about US$97/kWh.
According to the benchmark BloombergNEF (BNEF) Lithium-Ion Battery Price Survey, global average battery pack price dropped to a record low of US$108/kWh in 2025. Lower lithium prices helped drive that milestone.
Lower battery costs also support grid-scale energy storage. BloombergNEF forecasts rapid growth in energy storage installations through the end of the decade as countries expand renewable energy and strengthen electricity grids.
Lower lithium prices may reduce miners’ profits, but they also make clean energy technologies more affordable for consumers and businesses.
Miners Face a More Competitive Market
Lithium producers face a tougher business environment. Higher-cost mines may struggle if prices stay low. Several companies have already slowed expansion plans or delayed new projects after lithium prices fell sharply over the past two years.
At the same time, the industry’s largest producers continue investing for long-term growth. They see strong demand from EVs, batteries, and energy storage well beyond 2030.
That shift will reward low-cost producers with high-quality resources while putting greater pressure on higher-cost operations.
A Short-Term Correction, Not a Long-Term Slowdown
The latest price drop reflects changing market expectations, not weaker demand.
Traders are preparing for a larger supply pipeline in 2027. Meanwhile, the long-term drivers of lithium demand remain strong. Governments continue promoting transport electrification. Utilities are building more battery storage. Automakers are launching new electric models every year.
The lithium market has always moved in cycles. Lower prices often encourage more demand while pushing producers to improve efficiency and control costs.
For investors and the broader clean energy industry, today’s price weakness looks less like a warning sign and more like a market adjustment. As supply catches up with demand, lower lithium prices can help accelerate the global shift to electric mobility and renewable energy.
https://globalcarbonfund.com/wp-content/uploads/2018/10/GCF_header_logo_340x156.png00carbonfundhttps://globalcarbonfund.com/wp-content/uploads/2018/10/GCF_header_logo_340x156.pngcarbonfund2026-07-22 16:14:312026-07-22 16:14:31Why Falling Lithium Prices, Hitting Lowest Level in Five Months, Could Be Good News for the Clean Energy Boom?
Nuclear power is gaining new attention. It is not only producing clean electricity but is also becoming a valuable asset in environmental markets. Xpansiv has launched trading for New England Power Pool (NEPOOL) Emission-Free Energy Certificates (EFECs) on its CBL spot exchange. The new certificates will trade alongside PJM EFECs, Renewable Energy Certificates (RECs), carbon credits, and alternative fuel credits.
CBL is the world’s largest environmental commodity spot exchange, giving buyers and sellers one place to trade a wide range of environmental products. Over U1 trillion in environmental commodities have been traded through the platform.
The Leading Exchange for U.S. Nuclear Certificates
The move comes as electricity demand rises quickly. Artificial intelligence (AI), cloud computing, and electric vehicles (EVs) all need huge amounts of reliable, carbon-free electricity. As a result, companies are placing greater value not only on clean power itself but also on certificates that prove where that power came from.
Xpansiv says its registry network already supports more than 25 gigawatts (GW) of nuclear generation. That represents about one-quarter of total U.S. nuclear capacity. The company also tracks more than 90 GW of renewable energy across North America through its registry network.
According to the company, it has achieved this milestone:
During the first week after launching PJM Emission-Free Energy Certificates (EFECs) in 2024, 675,000 MWh of nuclear certificates were traded on CBL.
That represented one of the fastest starts for a new environmental commodity on the exchange.
Now, with NEPOOL EFECs added, the exchange covers two of the largest U.S. competitive electricity markets:
PJM serves 65 million people across 13 states plus Washington, D.C.
ISO New England (NEPOOL) serves about 15 million people across six New England states.
AI is changing the global power market. The International Energy Agency (IEA) says data center electricity use will more than double by 2030. It will hit around 945 terawatt-hours (TWh) each year. That is more electricity than Japan uses today, and AI will be the biggest reason for this growth.
Electric vehicles are adding to demand as well. The IEA estimates that about 21 million EVs were sold worldwide in 2025, or nearly 1 in 4 new passenger cars sold globally was electric.
Together, AI and EVs are putting more pressure on power grids. Utilities must supply more electricity while also cutting emissions.
Solar and wind are growing fast, but they depend on the weather. Data centers, hospitals, factories, and other large users need electricity every hour of the day. That is bringing new attention to nuclear power because it can provide 24/7 emissions-free baseload electricity.
Why Nuclear Energy Certificates Are Becoming More Valuable
Emission-Free Energy Certificates, or EFECs, work much like Renewable Energy Certificates. The difference is that they represent electricity produced from nuclear and other qualifying emission-free sources.
Companies buy these certificates to support their climate goals and show they are using carbon-free electricity. Utilities, large manufacturers, and technology companies could become major buyers as demand for clean electricity continues to grow.
The launch of NEPOOL EFEC trading also expands the environmental markets available through Xpansiv. Bringing nuclear certificates into New England could improve market liquidity, price transparency, and trading activity. It also gives companies another way to support clean electricity while meeting voluntary sustainability commitments.
Source: Xpansiv, IEA
Russell Karas, Senior Vice President, Xpansiv, remarked:
“The launch of our NEPOOL EFEC contract is an important step in our strategy to support the development of robust, dispatchable, emissions-free electricity as the industry works to keep pace with rising demand and energy transition goals.”
More importantly, it reflects a broader trend. As electricity demand grows, environmental markets are expanding beyond traditional carbon credits and renewable certificates. Nuclear energy is now part of this transition. It gives businesses more ways to cut their carbon footprint while also supporting reliable, emissions-free power.
Nuclear Is Returning to the Climate Conversation
Nuclear power is making a comeback as countries look for reliable clean electricity.
The International Energy Agency (IEA) says that global nuclear power generation will hit a record high in 2025. It will keep growing in 2026, too. New reactors in China, India, and South Korea, along with reactor restarts in Japan and strong output in the United States and France, are driving that growth.
Source: IEA
The technology already plays a major role in cutting emissions. The IEA says nuclear provides about 9% of the world’s electricity and around one-quarter of global low-emissions electricity. It is one of the largest sources of carbon-free power after hydropower.
Nuclear plants in the United States generate about one-fifth of the nation’s electricity. They provide nearly half of the carbon-free electricity, which is vital for the country’s clean energy goals. Bloomberg Intelligence projects that nuclear capacity in the U.S. will double by 2050.
Source: BI
Large technology companies are also helping revive interest in nuclear energy. Microsoft, Amazon, Google, and Meta are teaming up with nuclear energy firms. They want reliable, constant power for their AI data centers and cloud computing needs.
Environmental Markets Expand Beyond Traditional Carbon Credits
The launch of NEPOOL EFECs also shows how environmental markets are changing.
For years, voluntary carbon credits have dominated these markets. Today, companies are purchasing more environmental products. This includes Renewable Energy Certificates (RECs), nuclear certificates, methane certificates, and sustainable aviation fuel (SAF) certificates.
This shift reflects changing corporate climate strategies. Many companies now want proof that the electricity they use comes from low- or zero-carbon sources. Environmental certificates provide that evidence and help companies report progress toward their climate goals.
By adding New England nuclear certificates, Xpansiv is expanding the range of environmental products available on its exchange. More trading can improve market liquidity, price discovery, and transparency, making it easier for buyers and sellers to value carbon-free electricity.
A Growing Role for Nuclear in Net Zero
The launch of NEPOOL EFEC trading may seem like a niche market development, but it points to a much bigger trend.
As AI, cloud computing, and transport electrification increase electricity demand, the need for reliable clean power is also growing. Solar and wind energy will keep growing fast. However, many experts think nuclear power will stay key in the energy mix. It provides reliable electricity all day long.
That is also changing environmental markets. Companies are no longer looking only for carbon offsets. They are increasingly buying verified environmental attributes linked to clean electricity generation.
For Xpansiv, the expansion into New England strengthens a growing market for nuclear certificates. For the wider energy sector, it shows that environmental commodities are evolving alongside the global transition to cleaner power.
As countries work toward net-zero emissions, the value of carbon-free electricity—and the certificates that verify it—is likely to keep growing. Nuclear energy is becoming part of that story once again.
https://globalcarbonfund.com/wp-content/uploads/2018/10/GCF_header_logo_340x156.png00carbonfundhttps://globalcarbonfund.com/wp-content/uploads/2018/10/GCF_header_logo_340x156.pngcarbonfund2026-07-22 09:14:322026-07-22 09:14:32Xpansiv Expands Nuclear Credit Trading as AI Sparks New Boom in Clean Power Markets
Independent carbon ratings are now essential as companies seek quality carbon credits to meet climate goals. Corporate buyers want assurance that each credit delivers a real climate benefit, not just a number.
Reflecting this shift, Danish climate tech firm Agreena has reached a significant milestone. Its AgreenaCarbon Project has earned a BBB BeZero Carbon Rating, placing it among the top soil carbon projects worldwide.
This rating comes after the project’s first issuance of carbon credits under Verra’s Verified Carbon Standard (VCS). It confirms that the project’s performance meets earlier expectations.
What Does a BBB BeZero Carbon Rating Mean?
BeZero Carbon rates projects based on whether each carbon credit represents one metric ton of carbon dioxide equivalent (CO₂e) that has been avoided or removed from the atmosphere.
The rating scale ranges from AAA (highest confidence) to D (lowest confidence). Instead of focusing on financial performance, the rating looks at several project risks, such as:
Accurate measurement of emission reductions
Longevity of carbon benefits
Risks in project execution
Quality of monitoring and verification
Strength of the scientific methodology
A BBB rating indicates strong confidence that the issued credits deliver the claimed climate impact.
BeZero’s Rating Scale
Source: BeZero
For Agreena, this rating ranks its project among the top five ex post BeZero-rated projects in soil-related agricultural practices, showcasing its position in the growing market for regenerative agriculture carbon credits.
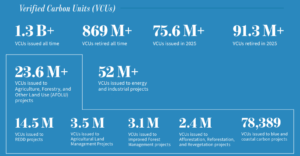
Agreena announced that its AgreenaCarbon Project (VCS 4022) received a BBB ex post BeZero Carbon Rating following the issuance of its first Verified Carbon Units (VCUs) in September 2025.
This rating affirms the earlier BBB.pre ex ante rating from BeZero in February 2025, before any credits were issued. Keeping the same rating after verification is crucial. It shows the project delivered results as expected.
An ex ante assessment estimates future performance, while an ex post rating is based on verified data and actual outcomes. This gives buyers confidence that climate benefits are measured, not just predicted.
The project was developed under Verra’s Verified Carbon Standard using methodology VM0042, with independent auditing before issuing carbon credits.
Frederik Aagaard, Chief Commercial Officer at Agreena, said:
“This independent rating highlights the strength of the AgreenaCarbon Project’s delivery. By providing external, evidence-based validation of our issued credits, it gives stakeholders confidence in the quality of the climate impact we’re already delivering. We’ve built the programme to generate real, verifiable climate impact, and this recognition reinforces that.”
The voluntary carbon market faces scrutiny over the quality and effectiveness of some carbon credits. Buyers now rely more on independent assessments.


Recent research by Patch’s Hidden State of the Voluntary Carbon Market report shows that 79% of companies prefer projects with a BBB BeZero Carbon Rating or higher. Similarly, 83% of buyers seek projects with at least a Tier 2 Sylvera rating, highlighting the rising importance of third-party evaluations.
Source: Patch
Another trend is the growing demand for Core Carbon Principles (CCP)-approved credits. Nearly 40% of buyers now prioritize credits from methodologies approved by the Integrity Council for the Voluntary Carbon Market (ICVCM).

These independent assessments reduce risks for buyers. They lower the chance that purchased credits won’t deliver promised emissions reductions. They also minimize reputational risks as companies face public scrutiny over climate claims.
However, experts warn that ratings shouldn’t be the only quality measure. They offer valuable insights into carbon integrity, but buyers often perform additional checks on project operations, technology, financial stability, and environmental impacts.
Regenerative Agriculture Gains Momentum
Agreena’s project emphasizes regenerative farming practices that enhance carbon storage in soils. Instead of engineered carbon removal technologies, farmers adopt methods that improve soil health and naturally capture more carbon.
Practices can include reducing soil disturbance, increasing crop diversity, and keeping soils covered year-round.
Beyond carbon removal, regenerative agriculture provides other environmental and financial benefits. They are:
Healthier soils improve water retention, support biodiversity, reduce erosion, and enhance resilience during extreme weather.
This approach also provides farmers with an additional source of income through carbon credit sales, helping offset the costs of transitioning to sustainable methods.
Agreena’s Expanding Soil Carbon Program
Agreena is now one of Europe’s largest soil carbon program developers. The company works with thousands of farmers across 20 markets, covering about 5 million hectares of agricultural land.
Its flagship AgreenaCarbon Project spans 1.6 million hectares of regenerative farmland across Europe and has issued 2.3 million Verified Carbon Units under Verra’s Verified Carbon Standard.
A key part of Agreena’s approach is its digital measurement, reporting, and verification (dMRV) platform. This system uses AI, satellite imagery, and field data to monitor carbon storage across large areas while ensuring accuracy.
This technology helps Agreena scale soil carbon projects while providing transparent monitoring for independent verification.
Building Buyer Confidence in Nature-Based Solutions
Nature-based carbon removal projects are gaining interest as businesses expand net-zero strategies. Buyers are becoming more selective, demanding solid evidence that credits reflect true climate benefits.
The global soil and agricultural carbon credit market is worth $4.2 billion today. It is expected to grow to $11.3 billion by 2034, with an annual growth rate of 11.58%.
For Agreena, maintaining its BBB rating after credit issuance shows that verified performance meets earlier expectations, instead of relying on projections.
As voluntary carbon markets grow, buyers need transparency, scientific verification, and independent ratings. Projects with strict monitoring and clear benefits can attract corporate buyers looking for reliable carbon credits. In soil carbon initiatives, focusing on quality builds trust in regenerative agriculture. This trust helps farmers and ecosystems as important nature-based climate solutions.
China’s solar exports are changing direction. While shipments to Europe and the Middle East slowed in June, exports to Southeast Asia, South Asia, and Africa continued to grow, showing that demand for affordable Chinese solar equipment remains strong in emerging markets.
Reuters reported that the country’s latest customs data also suggests that China’s decision to remove export tax rebates is beginning to affect overall shipments. Total exports declined for the second straight month after the policy change took effect on April 1.
Even so, China remains the world’s dominant solar manufacturing hub, producing more than 80% of global solar PV components and supplying countries that are rapidly expanding renewable energy capacity.
Asia and Africa Drive China’s Solar Export Growth
According to China’s customs data, exports of solar cells and panels to Southeast Asia increased 33% year over year to 125,402 metric tons in June.
Africa also emerged as a major growth market, with exports rising 26% to 103,277 metric tons, while shipments to South Asia climbed 12% to 114,643 metric tons.
In contrast, demand weakened across several traditional markets:
Exports to Europe fell 18% to 370,481 metric tons
Shipments to the Middle East dropped 38% to 96,224 metric tons
Exports to Latin America declined 20% to 77,548 metric tons
Despite strong demand in developing economies, China’s total solar exports fell 9% year over year to 980,000 metric tons, worth $2.49 billion in June.
Measured by the number of units exported, shipments dropped 16.5% to 743.2 million solar products, marking the second consecutive monthly decline since the country ended its value-added tax (VAT) export rebate for photovoltaic products.
The recent decline follows a major policy change announced earlier this year.
China eliminated VAT export rebates for photovoltaic products beginning April 1, 2026. The government also reduced export rebates for battery products from 9% to 6% through the end of 2026 before removing them completely from January 1, 2027.
The policy is aimed at reducing excessive competition among Chinese manufacturers and easing trade tensions created by ultra-low-priced exports.
Before the rebate ended, buyers rushed to secure supplies. China’s solar exports surged in March and remained strong in April, even after the policy took effect, as many overseas customers had placed orders in advance.
June’s figures now suggest that the market is beginning to normalize after that rush.
Although exports have slowed, China’s position in the global solar industry remains unmatched.
According to the International Energy Agency (IEA), China accounts for more than 80% of global manufacturing capacity across nearly every stage of the solar supply chain, including polysilicon, wafers, solar cells, and modules.
Data from IEA and BloombergNEF further says that China manufactured 400 GW of solar panels in 2025, 87.9% of global capacity. From 55.6% in 2010, China dominates solar manufacturing.
Source: chinadata.live
The country has invested more than $50 billion in solar manufacturing since 2011, helping drive down panel prices by over 80% worldwide and making solar power the cheapest source of new electricity in many regions.
The IEA also notes that China continues to dominate global exports despite increasing efforts by the United States, Europe, and India to develop domestic manufacturing capacity.
Its latest Energy Technology Perspectives report estimates that China still controls roughly 60% to 85% of production capacity across major clean energy supply chains, with even higher shares in some manufacturing steps.
Emerging Markets Become Key Customers
The latest export data highlights a broader shift in global solar demand.
Many developing countries are expanding renewable energy to improve electricity access while reducing dependence on imported fossil fuels.
Africa has become one of the fastest-growing destinations for Chinese solar equipment because falling panel prices have made large-scale solar projects increasingly affordable. Although China’s removal of export rebates may gradually increase equipment costs, analysts expect solar to remain one of the lowest-cost power options across much of the continent.
Similarly, Southeast Asian and South Asian countries continue to install record amounts of solar capacity as electricity demand rises alongside economic growth.
Energy think tank Ember has also observed growing demand from Asia and Africa, noting that Chinese customs data increasingly reflects these regions’ expanding role in the global solar market.
Source: Ember
Europe’s Demand Is Cooling
Europe remains China’s largest export destination, but imports are slowing.
The region installed record amounts of solar capacity over the past few years, leading to high inventory levels. Combined with slower economic growth and efforts to diversify supply chains, this has reduced new purchases from China.
Trade restrictions have also reshaped global supply chains.
The United States has imposed higher tariffs on solar products originating from several Southeast Asian countries with significant Chinese manufacturing, encouraging companies to relocate production and redirect exports toward other markets.
What Comes Next?
China’s June export data suggests that the country’s solar industry is entering a new phase.
The end of export tax rebates is reducing shipment volumes after months of exceptionally strong sales. However, demand from emerging economies is helping offset weaker purchases from Europe and other mature markets.
As countries continue investing in clean electricity, China is expected to remain the world’s largest supplier of solar equipment. Even with changing trade policies and growing competition from other manufacturing hubs, its scale, established supply chains, and low production costs continue to give it a significant advantage.
The latest figures also highlight an important trend: the next wave of global solar growth is increasingly coming from Asia and Africa, where expanding electricity demand and falling renewable energy costs are accelerating the transition to clean power.
https://globalcarbonfund.com/wp-content/uploads/2018/10/GCF_header_logo_340x156.png00carbonfundhttps://globalcarbonfund.com/wp-content/uploads/2018/10/GCF_header_logo_340x156.pngcarbonfund2026-07-21 16:14:362026-07-21 16:14:36China’s Solar Exports Shift Toward Asia and Africa Despite Tax Rebate Cuts
Electric vehicles (EVs) have become the symbol of cleaner transport, but some of the world’s biggest automakers believe another solution can also help cut emissions—renewable gasoline that works in today’s cars.
Toyota, BMW, Bosch, and Repsol have started a six-month pilot in Spain. They will test 100% renewable gasoline in real-world driving conditions. About 20 Toyota and BMW production vehicles will use Repsol Nexa 100% Renewable Gasoline. Bosch will monitor fuel performance with its Digital Fuel Twin technology.
Unlike electric vehicles, the pilot does not require new engines or charging stations. Instead, it aims to show that renewable fuels can lower emissions from the millions of gasoline-powered cars already on the road.
The project also reflects a growing shift in the auto industry. Rather than relying on a single technology, more companies are pursuing multiple paths to reach net zero.
Pascal Ruch, VP Corporate & Governmental Affairs, Toyota Motor Europe, remarked:
“As the transition progresses, it is becoming clear that there is a growing risk that 100% zero-emission vehicles by 2035 may not be fully achieved. In such a scenario, renewable fuels can help bridge the gap to deliver carbon neutrality, especially when combined with hybrid and plug-in hybrid technologies. This pilot aims to demonstrate how renewable fuels can make a meaningful and sustainable contribution to decarbonisation today, for both new and existing vehicles.”
Renewable Fuel Could Help Cut Emissions Today
The biggest advantage of renewable gasoline is that it works with existing vehicles and fuel stations.
Repsol produces the fuel from renewable waste materials instead of crude oil. The company claims it can cut lifecycle carbon dioxide (CO₂) emissions by up to 90%. This depends on the feedstock and production process used, compared to regular gasoline.
Lifecycle emissions cover the fuel’s full journey. This includes raw materials, production, transport, and final use. Unlike tailpipe emissions, they account for every step.
Renewable gasoline is also considered a drop-in fuel. Drivers can use it without modifying their engines, while fuel suppliers can distribute it through much of the existing infrastructure. That makes it a practical option for reducing emissions while the transition to electric mobility continues.
Why Existing Vehicles Still Matter
The world cannot replace its vehicle fleet overnight. According to the International Energy Agency (IEA), transport produces about 23% of global energy-related CO₂ emissions. Also, road transport accounts for about three-quarters of those emissions.
Source: IEA
At the same time, there are more than 1.5 billion passenger vehicles in operation worldwide, most of which still use gasoline or diesel.
Electric vehicles are expanding rapidly. The IEA’s Global EV Outlook 2026 says global EV sales hit around 20 million in 2025. This is over 20% of new passenger car sales. Yet, replacing the global fleet will take decades, especially in developing countries where vehicles remain on the road longer.
This is where renewable fuels could play an important role. Instead of waiting for every gasoline car to be replaced, they can help lower emissions from vehicles already in service. Many experts now see renewable fuels as a complement to electrification rather than a competitor.
Governments Are Backing Low-Carbon Fuels
Support for renewable fuels is also growing through public policy.
The European Union’s Renewable Energy Directive (RED III) encourages greater use of advanced biofuels made from waste and non-food feedstocks. In the United States, programs such as the Renewable Fuel Standard (RFS) and California’s Low Carbon Fuel Standard (LCFS) continue to support cleaner transport fuels and new investments.
As these policies expand, energy companies and automakers are investing across the low-carbon fuel market. Renewable gasoline, renewable diesel, sustainable aviation fuel (SAF), and synthetic e-fuels are all expected to play a bigger role in reducing transport emissions over the coming decades.
The Toyota-BMW-Repsol pilot is one example of that broader shift. Rather than choosing between electric vehicles and renewable fuels, the industry is increasingly exploring how both can work together to speed up the journey toward net-zero transport.
Why Toyota, BMW, Bosch, and Repsol Are Joining Forces
The pilot also supports the climate goals of all four companies.
Toyota aims to become carbon neutral by 2050. Instead of focusing only on EVs, the company follows a “multi-pathway” strategy. It is investing in hybrids, battery EVs, hydrogen fuel cells, and renewable fuels. Toyota says different markets need different solutions to reduce emissions.
BMW also targets a climate-neutral value chain by 2050. By 2030, it plans to cut lifecycle CO₂ emissions per vehicle by at least 40% compared with 2019. The company is using more renewable electricity, recycled materials, and low-carbon manufacturing. It also supports renewable fuels for vehicles that will stay on the road for many years.
Source: BMW
Bosch has already achieved carbon neutrality for its Scope 1 and Scope 2 emissions across more than 400 locations worldwide. The company continues to invest in electrification, hydrogen, and digital technologies that improve vehicle efficiency and lower emissions.
For Repsol, renewable fuels are becoming a key part of its energy transition. The company aims to become net zero by 2050. It is expanding production of renewable fuels and has opened one of Europe’s first large-scale plants that produces renewable diesel and SAF from waste-based feedstocks.
Estíbaliz Pombo, Deputy Director of Energy Products at Repsol, stated:
“At Repsol, we believe every emissions-reduction solution has a role to play in decarbonizing transport. As the only company currently supplying 100% renewable gasoline at public service stations in Spain, Repsol is proud to contribute its expertise and infrastructure alongside Toyota, BMW, and Bosch. The project’s real-world data will demonstrate the value of a technology-neutral approach to Europe’s mobility transition.”
Renewable Fuels Gain Momentum Worldwide
Renewable fuels are becoming an important part of the energy transition.
The IEA expects renewable energy use in transport to grow by 50% by 2030. Biofuels already supply more than 3.5% of global transport energy demand.
Source: IEA
Their share of liquid transport fuels could rise from 4% in 2024 to over 6% by 2030, reaching about 235 billion liters annually. In an accelerated case, it could further jump to 313 billion liters per year.
Government policies are driving this growth, backing the market with massive financial support. Various programs in different regions continue to fuel investment in these transport biofuels and renewable fuels, as shown below.
EVs Aren’t the Only Road to Net Zero
Most experts agree that transport will need more than one low-carbon solution.
Renewable fuels can help lower emissions from these existing vehicles because they work with today’s engines and fueling infrastructure. That is why Toyota, BMW, Bosch, and Repsol are investing in renewable fuels alongside EVs, hydrogen, and other clean technologies.
Rather than competing with electrification, renewable fuels can help speed up the transition to net-zero transport.
If the technology proves successful and production expands, renewable fuels could become an important bridge in the shift to cleaner mobility. Together with electric vehicles and other low-carbon technologies, they could help speed up the transition to a net-zero transport sector while making use of existing vehicles and fuel infrastructure.
https://globalcarbonfund.com/wp-content/uploads/2018/10/GCF_header_logo_340x156.png00carbonfundhttps://globalcarbonfund.com/wp-content/uploads/2018/10/GCF_header_logo_340x156.pngcarbonfund2026-07-21 12:14:322026-07-21 12:14:32Toyota, BMW, and Bosch Back Renewable Gasoline as Race for Net-Zero Cars Widens
Delta Air Lines and Shell are deepening their partnership to help expand sustainable aviation fuel (SAF) across the United States. The companies have signed a five-year agreement to increase SAF supply and strengthen the infrastructure needed to deliver it at airports.
The deal goes beyond supplying cleaner fuel. It also focuses on building the storage, blending, and distribution network needed to scale SAF across Delta’s operations.
The timing is significant. Airlines face growing pressure to cut emissions while passenger demand continues to recover. Delta aims to reach net-zero greenhouse gas emissions by 2050, while Shell is expanding its lower-carbon fuels business as part of its energy transition strategy.
Their SAF agreement will expand production for flights involving five major airports:
Los Angeles International Airport (LAX),
Portland International Airport (PDX),
John F. Kennedy International Airport (JFK),
Logan International Airport (BOS), and
Minneapolis-St. Paul International Airport (MSP).
Aviation Has Few Low-Carbon Alternatives
Aviation remains one of the world’s hardest industries to decarbonize. According to the International Energy Agency (IEA), aviation produces about 2.5% of global energy-related CO₂ emissions.
Air travel demand also continues to grow, increasing fuel consumption. Also, long-haul aircraft still cannot rely on batteries or hydrogen at a commercial scale.
That makes sustainable aviation fuel one of the few technologies available today that can significantly reduce lifecycle emissions while using existing aircraft and airport infrastructure.
The International Civil Aviation Organization (ICAO) has adopted a long-term goal for international aviation to achieve net-zero carbon emissions by 2050. Airlines worldwide have also committed to the same target through the IATA.
Source: ICAO
Meeting that goal will require a mix of cleaner fuels, more efficient aircraft, improved operations, and new propulsion technologies.
SAF Production Is Growing, But Supply Remains Tight
Sustainable aviation fuel production is rising quickly, but it still represents only a tiny share of global jet fuel. According to the IEA and IATA:
Global SAF production reached about 2 million tonnes, or 2.5 billion liters, in 2025.
That represents about 0.7% of global airline fuel consumption, more than double the share in 2024.
Production is expected to continue increasing in 2026 as new refineries and expansion projects come online, although it will still remain well below demand.
The numbers highlight why airlines continue signing long-term supply agreements. Demand is growing much faster than production, driving investment across the entire supply chain—from feedstock collection and fuel production to airport infrastructure.
Delta has made sustainable aviation fuel a core part of its climate strategy. The airline’s roadmap to net-zero emissions by 2050 focuses on cutting emissions directly across its operations instead of relying mainly on carbon offsets.
Source: Delta Airlines
Its strategy includes expanding sustainable aviation fuel use, modernizing its fleet with more fuel-efficient aircraft, improving operational efficiency, and supporting next-generation aviation technologies.
Fleet renewal is already delivering results. New-generation aircraft such as the Airbus A321neo burn about 20% less fuel per seat than the older aircraft they replace, reducing both fuel costs and emissions.
Delta has also invested in flight optimization, lighter onboard equipment, and other operational improvements that reduce fuel burn across its network. The airline continues to describe SAF as its largest long-term opportunity to cut aviation emissions because it works with today’s aircraft and fueling infrastructure.
Amelia DeLuca, the airline’s Chief Sustainability Officer, remarked:
“Current instability and uncertainty have made one thing very clear to consumers and businesses alike — supply diversity matters. With Shell, we’re proving that scaling SAF isn’t theoretical, it’s achievable. This is about activating real supply chains at scale and creating a model that others can build on as we work across the industry to expand lower-impact travel.”
Delta has disclosed substantial procurement commitments, even if it has not disclosed their total value:
Bought 23.4 million gallons of SAF in 2025, an 80% increase from 2024. Since 2021, it has used 42 million gallons of SAF.
Committed to sourcing 400 million gallons of SAF annually by 2030 to meet its target of using SAF for 10% of its fuel consumption.
The airline’s previously announced contracts include:
75 million gallons per year for seven years from Gevo (about 525 million gallons total),
10 million gallons from Shell for LAX under the 2023 agreement, and
The new 2026 Shell agreement provides at least 15 million gallons in 2026, with options to increase volumes each year through 2030.
Shell Builds a Bigger Role in Low-Carbon Aviation
The agreement also supports Shell’s broader energy transition strategy. The company continues investing in several lower-carbon businesses, including SAF, renewable fuels, hydrogen, electric vehicle charging, and carbon capture and storage (CCS).
Reema Bari, Head of Aviation Americas at Shell, stated:
“This collaboration delivers on today’s fuel needs and tomorrow’s aviation solutions. By supplying conventional jet, SAF, and longer-term innovation, the deal will help strengthen energy security and contribute to the transformation of aviation.”
The energy giant aims to become a net-zero emissions energy business by 2050, in step with society’s progress toward achieving the goals of the Paris Agreement.
Source: Shell
As governments introduce new aviation fuel policies and blending requirements, demand for SAF continues to grow. Expanding supply partnerships allows Shell to strengthen its position in one of the fastest-growing low-carbon fuel markets.
Producing more SAF is only part of the solution. The fuel must also reach airports efficiently. Unlike conventional jet fuel, SAF requires dedicated infrastructure, including:
Storage tanks,
Blending facilities,
Quality testing systems, and
Distribution and pipeline networks.
Without these investments, higher fuel production alone cannot meet growing airline demand.
As more airlines commit to SAF, airports must also expand their fuel handling systems. Industry experts increasingly see infrastructure as one of the biggest barriers to scaling sustainable aviation fuel.
Infrastructure is becoming one of the industry’s biggest challenges. According to the International Air Transport Association, airlines will need 449 billion liters of SAF each year by 2050 to reach the industry’s net-zero target.
Source: IATA
Building the fuel alone will not be enough. Airports must also develop the facilities needed to receive and deliver those much larger volumes.
Carbon Markets Help Fuel the SAF Boom
Carbon markets are becoming an important driver of SAF investment.
Under the Carbon Offsetting and Reduction Scheme for International Aviation (CORSIA), airlines can reduce their compliance obligations by using eligible sustainable aviation fuels that deliver verified lifecycle emissions reductions.
Many SAF pathways also qualify for programs such as the U.S. Low Carbon Fuel Standard (LCFS) and federal clean fuel incentives. These policies improve project economics and encourage producers to expand capacity.
The industry is also adopting book-and-claim systems and SAF certificates. These mechanisms allow companies to support SAF production even when physical fuel cannot be delivered to every airport, thereby increasing market demand as infrastructure continues to expand.
Laying the Runway for Net-Zero Flight
The Delta-Shell partnership highlights how the aviation industry is evolving.
Although SAF still supplies less than 1% of global aviation fuel, production continues to increase as airlines strengthen their climate commitments and governments expand support for cleaner fuels.
The agreement also reflects a broader shift across the aviation sector. Companies are investing across the entire SAF value chain—from production and logistics to airport infrastructure—to prepare for much larger volumes in the years ahead.
As the industry works toward its 2050 net-zero goal, expanding fuel supply alone will not be enough. Building a reliable distribution network will be essential to making sustainable aviation fuel available wherever aircraft operate.
https://globalcarbonfund.com/wp-content/uploads/2018/10/GCF_header_logo_340x156.png00carbonfundhttps://globalcarbonfund.com/wp-content/uploads/2018/10/GCF_header_logo_340x156.pngcarbonfund2026-07-21 10:14:302026-07-21 10:14:30Delta and Shell Bet Big on SAF as Airlines Race Toward Net Zero
Toyota Motor and Nvidia are enhancing their long-term partnership. They’re now focusing on physical artificial intelligence (AI) technologies beyond just self-driving cars.
This partnership covers next-gen vehicles, manufacturing, robotics, and urban infrastructure. It shows a trend: AI is moving from data centers into the real world, powering factories, vehicles, and smart cities.
For investors, this strengthens Nvidia’s plan to grow its AI ecosystem beyond cloud computing chips. Toyota is also using AI to modernize vehicle development, boost factory efficiency, and speed up software engineering.
Toyota and Nvidia AI Partnership Moves Beyond Cars
Both companies started working together in 2017. Toyota chose Nvidia’s Drive PX platform for automated driving tests. Their partnership has grown since then.
Last year, Toyota announced plans for next-gen vehicles using Nvidia’s DRIVE AGX computing platform and DriveOS operating system. The new agreement expands their collaboration across nearly all of Toyota’s business.
Now, they will integrate Nvidia’s computing power, AI software, and simulation platforms into vehicle design, manufacturing, software development, robotics, and intelligent transportation systems.
This reflects a shift toward “physical AI,” where systems interact with real-world environments.
Smarter Driver Assistance
A key goal for Toyota is improving advanced driver-assistance systems (ADAS). Future Toyota vehicles are expected to offer Level 2++ driving capabilities. These systems can handle many driving tasks but require drivers to stay alert.
Toyota aims to make these systems more aware of their surroundings. This will help vehicles adapt to changing road conditions while prioritizing safety.
Instead of rushing to full autonomy, Toyota focuses on gradually enhancing real-world driving assistance through AI.
AI Speeds Up Software Development
Software is vital in modern vehicles. With cars relying on millions of lines of code, ensuring quality and safety is complex. To address this, Toyota has created an AI coding assistant using Nvidia’s Megatron-LM and Nemotron large language models.
This system helps engineers generate, review, and validate software while meeting MISRA standards, which are safety-focused coding guidelines.
By automating repetitive tasks and improving code validation, Toyota expects engineers to create software faster without sacrificing quality.
Digital Factories Before Physical Ones
The car maker is also using AI in its manufacturing. With Nvidia Omniverse libraries and the Isaac Sim robotics simulation platform, Toyota is creating digital twins of its factories.
These virtual environments let engineers test robot movements, redesign production lines, and identify operational bottlenecks before making changes in real factories.
Furthermore, this approach can reduce production downtime, enhance efficiency, and lower costs. Lastly, Digital twins are becoming essential in advanced manufacturing, allowing companies to simulate changes before making costly adjustments.
Woven by Toyota Brings AI to Urban Transportation
The partnership also extends to urban infrastructure. Toyota’s mobility tech arm, Woven by Toyota, is developing AI systems to enhance urban transport and smart city infrastructure.
The team has built a multimodal vision-language model using Nvidia H100 Tensor Core GPUs and Megatron-Core software.
This model analyzes traffic conditions using various data types, helping to interpret complex road scenarios and anticipate traffic changes.
Such technology could support traffic management and connected transportation networks in future smart cities, where vehicles and infrastructure share information. This shows Toyota’s growing view of AI as vital for future mobility, not just a car technology.
Toyota Is Investing Billions in AI
The expanded partnership aligns with Toyota’s growing investment in AI. In September 2025, the company launched two funds totaling $1.5 billion.
The first, Toyota Invention Partners (TIP), set aside about $670 million for early-stage tech startups.
The second, Woven Capital Fund II, committed roughly $800 million to later-stage companies focused on AI and advanced mobility.
Two months later, Toyota announced plans to invest another $10 billion over five years in its U.S. operations, focusing on AI and energy tech. These actions build on Toyota’s broader investment strategy from 2024, which allocated around $11.2 billion for future technologies, including AI and electric vehicles.
Together, these initiatives show Toyota’s belief in AI as a core technology for long-term competitiveness.
Image sourced from enkiai.com
Japan Is Betting on AI
Toyota’s strategy reflects Japan’s national goal to lead in AI. It is the key to Japan’s economic plans as the country faces labor shortages from an aging population.
In 2024, the Japan Business Federation urged Japan to become an AI and robotics superpower. They called AI a major growth driver to tackle workforce challenges and boost competitiveness.
The Japanese government has also made AI central to its “Society 5.0” vision, which links digital technologies with everyday life.
This national strategy has sparked rapid innovation in both public and private sectors. AI-related patent applications in Japan have surged over the last decade, reflecting increased research and development during Japan’s third AI boom.
Industry forecasts predict strong market growth. Japan’s AI market, valued at about $1.34 billion in 2026, is expected to reach nearly $6.77 billion by 2031, with a compound annual growth rate (CAGR) of 26.1%. Government support, rising enterprise adoption, and ongoing tech innovation will drive this growth.
What It Means for Nvidia Investors
For Nvidia, the partnership with Toyota is more than just another automotive deal. The company is a leader in AI infrastructure for cloud computing and data centers. However, its future growth depends on entering physical industries like manufacturing, robotics, and transportation.
This strategy supports Nvidia’s premium market value.
Investors believe global AI spending will remain strong this decade. Nvidia’s valuation shows it will stay a top AI infrastructure supplier. Businesses are investing in data centers, autonomous systems, robotics, and smart manufacturing.
At the same time, analysts strongly opine that NVDA stock must protect its market share against custom AI chips and competing platforms.
Source: Yahoo Finance
For Toyota, the partnership offers advanced AI tools to accelerate software development, optimize manufacturing, and enhance future mobility solutions.
Their collaboration highlights AI’s role in the physical economy. As industries digitize factories and transportation networks, partnerships like Toyota and Nvidia’s may shape intelligent infrastructure. This alliance strengthens both companies in the expanding AI market.
Renewable energy is a revolution, reshaping the global power scene. It offers sustainable alternatives to the dirty deeds of fossil fuels. Solar, wind, hydro, geothermal, and bioenergy sources are painting a brighter, cleaner energy landscape for all.
For a comprehensive understanding of solar energy—including technical details, key players, regulatory considerations, and future trends—this guide offers valuable insights.
Solar energy is the radiation that comes from the Sun and can be used to generate heat, electricity, and chemical reactions. The amount of solar energy reaching the Earth is far greater than what we currently use. If harnessed efficiently, it can sustainably meet all our energy needs.
Solar Power’s Role in Achieving Net Zero
Solar power is crucial for achieving net-zero emissions. This goal stems from the Paris Agreement, which seeks to limit global warming to below 2°C, aiming for 1.5°C. Solar energy is carbon-free and renewable, allowing us to use less fossil fuel. This shift helps countries reduce carbon emissions and meet climate targets. With lower costs and better technology, solar power is growing in homes, industries, and cities.
Large solar farms and rooftop panels are taking the place of coal and gas plants, cutting emissions. New technologies like agrivoltaics, floating solar, and building-integrated panels boost solar’s potential. Battery storage and smart grids also make solar energy more reliable.
Governments support solar adoption through incentives, tax credits, and clean energy policies. As a result, solar energy will significantly help reduce carbon emissions by providing clean energy for the grid, transportation, and industries.
This progress will assist countries in meeting their net-zero goals for climate change and lead to a greener future.
Most solar energy today comes from solar PV, which uses special materials called semiconductors—like silicon—to capture sunlight and turn it into electricity. When sunlight hits these materials, it knocks electrons loose, creating an electric current.
Solar panels, often seen on rooftops and in large solar farms, contain many small solar cells made of semiconductor material. These cells absorb sunlight, release electrons, and direct them to flow in the same direction, producing electricity. This power can then be used immediately or stored in batteries for later use.
Solar energy is converted into electricity using two main technologies:
Photovoltaics (PV)
Concentrating solar-thermal power (CSP)
However, both technologies help power homes, businesses, and electric vehicles, making solar energy a key player in the shift to clean power. They are also commonly known as utility-scale solar.
What is Photovoltaic (PV) Technology
Photovoltaic (PV) technology is the most commonly used solar technology. A single PV unit, called a solar cell, is a thin device that typically generates 1 to 2 watts of power. Multiple solar cells connect to form a module or panel, and several panels create an array.
These arrays connect to the electrical grid, forming a complete PV system. An inverter converts the direct current (DC) electricity from panels into alternating current (AC) for home and business use. The solar cells are enclosed in glass or plastic layers to protect them from outdoor conditions
The efficiency of a solar PV depends on the material’s ability to convert sunlight into electricity. It is influenced by factors like light intensity and the semiconductor’s bandgap, which determines how much light the material absorbs.
Moving on, we will explain the materials used in a solar cell.
Silicon and Thin-Film Solar Cells
Silicon: The most common material in solar panels, making up 95% of PV modules. It is one of the most abundant elements on Earth, making up 28% of the Earth’s crust. China dominates production, supplying 79% of the world’s silicon in 2023.
Silicon’s crystal structure helps convert sunlight into electricity effectively. Panels last over 25 years, retaining at least 80% of their power. Thus, silicon is the top choice because it is affordable, efficient, and long-lasting. According to the Renewable Energy Institute’s latest report, in China, the cost of crystalline silicon solar panels was just $0.11 per watt.
Thin-Film Solar Cells: These are made by layering PV materials on glass, plastic, or metal. The two main types are:
Cadmium Telluride (CdTe): The second-most used PV material. It is cheaper to produce but less efficient than silicon.
Copper Indium Gallium Diselenide (CIGS): Offers high efficiency but is harder to manufacture due to its complex composition.
As per the U.S. DOE, thin-film solar cells make up about 3% to 5% of the global market but are generally less efficient than silicon. The highest efficiency for thin-film cells is 22.1%, while monocrystalline silicon cells can reach 25%, and polycrystalline silicon cells exceed 20%.
Although thin-film cells are cheaper, they require extra protection for durability. While PV technology has improved in efficiency and cost, silicon remains the top choice for long-lasting and reliable solar power.
What is Concentrating Solar-Thermal Power (CSP)?
The second type of solar energy is CSP- concentrating solar-thermal power. This technology uses mirrors to generate electricity. Unlike solar panels, which turn sunlight directly into electricity, CSP focuses sunlight onto a receiver to create heat. This heat produces steam, which powers a turbine to generate electricity.
How CSP Plants Work
CSP plants consist of three main components:
Solar Collectors – Mirrors or lenses capture and focus sunlight onto a receiver. Common types include parabolic troughs, power towers, and parabolic dishes.
Thermal Energy Storage – Excess heat is stored, allowing plants to generate power even when sunlight is unavailable.
Power Block – Heat is transferred to a working fluid, such as molten salt or oil, which produces steam. This steam drives a turbine connected to a generator, producing electricity. The electricity is then distributed for residential and commercial use.
The image above illustrates how CSP can work with existing power plants, including fossil fuel systems. It has lower operating costs than nuclear and hydrocarbon plants because it requires less maintenance. It can also combine with other energy sources to keep the power grid stable. As energy demand rises, CSP provides a reliable and sustainable way to generate electricity.
Looking ahead to 2025 and beyond, improvements in solar panel efficiency, energy storage, and system design will help shape the future of global energy.
Global PV vs CSP Market Size Forecast
Renewables Set to Overtake Coal by 2026: Solar Takes the Spotlight
Renewable energy is moving ahead at a rapid pace. According to new forecasts from the International Energy Agency, clean power sources are on track to surpass coal and become the world’s largest source of electricity by 2026 at the latest.
The surge in renewables is largely fueled by strong growth in solar and wind energy. Together, they generated over 4,000 terawatt hours (TWh) of electricity in 2024. This figure is expected to climb sharply and cross 6,000 TWh by 2026.
In fact, solar power is leading the charge. It is projected to add more than 600 TWh each year, making it the fastest-growing energy source. Its share in global electricity generation could nearly double—from about 8% in 2025 to 15% by 2030.
Meanwhile, wind energy is also expanding steadily, with an average annual growth rate of around 10%. Their combined share is set to increase from 17% in 2025 to 27% by 2030.
Source: IEA
As a result of this rapid expansion, renewable energy will continue to gain a larger share of the global electricity mix. Overall, renewables are expected to grow at an average rate of 8.4% through 2030.
Coal’s Decline Becomes Clear
The shift away from coal is becoming more visible. By 2026, the transition is almost certain. At this point:
Renewables are expected to supply 36% of global electricity
Coal’s share will fall to 32%, marking its lowest level in a century
Top Countries Leading the Solar Energy Boom
Clean energy is gaining strong momentum worldwide. Today, nearly 140 countries have climate and energy security policies in place. As a result, renewables like solar and wind have become cost-competitive with fossil fuels.
This shift is driving demand from businesses and households. At the same time, it is boosting local manufacturing of solar panels and wind turbines.
China Powers Ahead with Massive Solar Expansion
China continues to dominate the global solar market. However, its strategy goes beyond meeting current demand. Instead, the country is building extra capacity to prepare for future needs.
This aggressive approach allows China to support energy-intensive sectors such as AI, cloud computing, and electric vehicles. In simple terms, it ensures the grid is ready when demand surges.
According to the National Energy Administration (NEA), in 2025, China set a new record by installing 315.07 GW of new solar PV capacity.
This massive expansion pushed the country’s cumulative installed solar capacity to 1.20 TW by the end of the year. The growth was remarkable, with solar capacity rising 35.4 % year-on-year, underscoring China’s rapid acceleration in renewable energy deployment.
This means the country added more than twice the solar capacity of all other nations combined. As a result, China now accounts for about 67% of global installations. Another key milestone is approaching. China’s total installed solar capacity is expected to surpass coal power capacity for the first time. This marks a major shift in the country’s energy transition.
Looking ahead, solar generation will keep rising strongly. The IEA expects solar output in China to increase by 320–360 TWh every year through 2030. This growth alone will meet about 60% of the country’s annual electricity demand increase.
In fact, China’s solar expansion over the next five years will be larger than the rest of the world combined.
The China Photovoltaic Industry Association estimates that China could add 180–240 GW of solar capacity in 2026. This would represent roughly one-third of global additions.
Between 2026 and 2030, annual installations in China could range between 238 GW and 287 GW. Although additions may slow slightly after the record 315 GW installed in 2025, growth is expected to stabilize and recover. In the most optimistic case, installations could reach around 320 GW again by 2030.
Overall, China remains the world’s largest and fastest-growing solar market.
India is quickly becoming a global solar leader. While it started from a smaller base, its growth rate is among the highest in the world.
Looking ahead, solar will play a major role in meeting energy demand. Around 50% of India’s additional electricity demand through 2030 is expected to come from solar power. Coal will still contribute, but at a much lower share of about 25%.
Source: IEA
Solar generation in India is set to grow rapidly. It is expected to increase by around 24% each year. As a result, solar’s share in electricity generation will reach about 10% by 2026 and rise close to 18% by 2030.
At the same time, installed capacity has expanded sharply. By June 2025, India’s solar capacity reached 110.9 GW. This is a huge jump from just 2.82 GW in 2014—nearly a 39-fold increase.
In addition, yearly installations are rising fast. In FY 2024–25 alone, India added 23.83 GW of solar capacity. This reflects strong policy support and growing investor interest.
Domestic manufacturing is also improving. Module production capacity increased from 2.3 GW to 88 GW. Meanwhile, solar cell production rose from 1.2 GW to 25 GW. These gains are helping India reduce reliance on imports.
Recent data highlights how strong this growth has become. In 2025, India added a record 37.9 GW of solar capacity, marking a 54.7% increase from 2024.
Government programs have played a key role in this expansion. Initiatives like PM Surya Ghar: Muft Bijli Yojana and PM-KUSUM have encouraged households and farmers to adopt solar energy.
Looking forward, India plans to add nearly 300 GW of renewable capacity between 2026 and 2030, with solar taking the lead.
In short, India combines rising energy demand with aggressive solar expansion, making it the second-largest growth engine after China.
U.S. Solar Growth Hits Pause, Not Stop
Solar power in the United States kept growing fast, but its share in the overall electricity mix rose more slowly. This is because other sources, especially natural gas, also expanded quickly. Solar’s share crossed 7% in 2025 and is expected to reach 10% by 2028 and 11% by 2030.
The U.S. installed 43.2 gigawatts (GW) of new solar capacity in 2025, according to the Solar Energy Industries Association (SEIA) and Wood Mackenzie.
Solar made up 54% of all new electricity-generating capacity, staying the top technology for the fifth year in a row.
Growth slowed in 2025. Total solar installations fell 14% from 2024 levels. The drop came mainly from fewer utility-scale projects. In the fourth quarter, installations fell 40% from the previous quarter. The One Big Beautiful Bill Act (OBBBA) caused delays. Developers pushed many projects to 2026–2028.
How does 2026 look for US solar? Insights from Wood Mackenzie
Wood Mackenzie said in its U.S. Energy Storage Monitor Q1 2026 that the country’s storage market is set to grow strongly over the next few years.
From 2026 to 2031, the U.S. is expected to add nearly 0.5 terawatt-hours (TWh) of energy storage. This marks about a 250% increase compared to the 2020–2025 period.
The utility-scale segment will lead this growth. It is projected to expand at an average rate of 16% per year, supported by federal incentives and rising electricity demand during peak hours.
The commercial and community (CCI) segment is also set to grow fast. Annual installations in this segment could increase by 39% between 2025 and 2030, driven by state-level programs, tax credits, and the need for stronger grid support.
The residential segment may see a slight dip. After a strong 2025, when many homeowners benefited from the Section 25D Investment Tax Credit (ITC), installations are expected to fall by 2% in 2026.
Looking ahead, the report highlights some uncertainty. Different scenarios suggest a 52 GW gap in total installations, depending on factors like electricity demand growth, rules around Foreign Entities of Concern (FEOC), and policy changes.
Even with these risks, the overall outlook remains positive. Annual U.S. energy storage installations are expected to exceed 28 GW by 2031 across all segments.
What EIA Says?
The EIA reported 53 GW of new capacity in 2025. This was the highest since 2002. Wind and utility-scale solar together produced 17% of U.S. electricity. Two decades ago, it was less than 1%.
Growth is expected to rebound. Developers plan to add 86 GW of new capacity in 2026. This could set a new record. Solar will make up 51% of the total. Battery storage will account for 28%, and wind 14%. Utility-scale solar alone could reach 43.4 GW. That is a 60% increase from 2025.
A few states will drive this growth. Texas will lead with about 40% of new solar capacity. California will also play a major role. Together, they will contribute nearly half of all additions. States like Indiana, Arizona, Michigan, Florida, and New York will each add over 1 GW.
Overall, the U.S. solar sector remains strong. Short-term challenges exist. But long-term demand stays high. Solar will play a bigger role in the clean energy transition.
The EU has set clear goals for 2030. These include a 55% cut in greenhouse gas emissions, the rollout of 600 GW of new solar capacity, and an 11.7% reduction in final energy use compared to earlier projections by the European Commission. These targets are not just about climate action. They also aim to improve energy security and reduce reliance on costly fossil fuel imports.
Solar power is driving much of this progress. As per IEA, between 2026 and 2030, the EU is expected to add over 400 GW of new renewable capacity, with around 70% coming from solar alone.
Latest analysis from think tank, Ember showed solar generation hit a record 369 TWh in 2025, marking over 20% growth for the fourth year in a row. Solar now provides 13% of EU electricity, overtaking both coal and hydropower.
Furthermore, growth has been widespread. Every EU country increased solar output, while nations like Hungary, Cyprus, Greece, Spain, and the Netherlands now get over 20% of their electricity from solar.
This rapid rise is largely due to capacity expansion. In 2025 alone, the EU added 65 GW of solar, split almost evenly between large solar farms and rooftop systems. Total solar output has more than doubled since 2020, showing how quickly the technology is scaling.
Fossil Fuels Decline as Clean Energy Expands
As renewables grow, fossil fuels are losing ground. Their share in EU electricity generation fell below 30% in 2024, dropping below the combined contribution of solar and wind for the first time.
However, integrating more renewables brings new challenges. Ember highlights that battery storage, stronger grids, and flexible demand systems will be key. These solutions can help balance supply and demand, improve energy security, and keep electricity prices stable.
Residential Solar Still Growing Strong
The residential segment also plays an important role. Data from Statista shows that home solar systems account for about 24% of total EU solar capacity.
Installations have grown quickly, rising from 4 GW in 2019 to 18 GW in 2023. While utility-scale projects now dominate new additions, residential solar is still expanding. Annual installations are expected to reach 23–28 GW between 2025 and 2028.
Overall, Europe’s clean energy transition is accelerating. Solar is leading the way, supported by policy, investment, and rising demand for energy independence.
According to Precedence Research, the global solar energy market has shown strong growth and is expected to expand even faster in the coming years. It was valued at $137.02 billion in 2025 and is projected to grow to $153.91 billion in 2026. By 2034, it may reach nearly $389.86 billion, rising at a steady 12.32% annual growth rate.
PV Systems and Polycrystalline Panels Lead
Photovoltaic (PV) systems dominated the solar market in 2024, accounting for more than half of the total share. Their strong adoption came from their flexibility and ease of use across different settings.
These systems were widely installed on the rooftops of homes and commercial buildings, and they also powered large-scale solar farms.
In addition, PV technology was integrated into modern building designs such as solar windows and facades. It also played a key role in off-grid areas, providing reliable electricity for essential needs like lighting and communication.
One of the biggest advantages of PV systems is their scalability, as they can be deployed in small residential setups or expanded into large utility-scale projects. This made them suitable for both urban and rural applications.
In terms of solar modules, polycrystalline panels held the largest share of the market in 2024.
Asia-Pacific Stays Ahead
The Asia-Pacific region dominated the global solar market, accounting for more than one-third of the total share in 2024. It was valued at USD 49.33 billion in 2025 and could hit around USD 142.3 billion by 2034.
China plays a key role in this dominance, holding the largest share of global installed solar capacity and producing around 80–90% of solar components worldwide. This strong manufacturing and deployment base has positioned the region as a central hub for the global solar industry.
Note: Market caps are estimated based on March 2026 stock prices and exchange rates. Primary data source: marketcap.com and disfold.com
What’s Driving Solar Growth?
Rising Energy Demand
Global energy needs are increasing due to population growth and rapid urbanization. More people and expanding cities mean higher demand for electricity across homes, businesses, and industries. This is pushing countries to adopt sustainable energy sources like solar and reduce fossil fuel dependence.
Data Center and AI
Rising electricity demand from data centers and AI models is driving the solar boom. Gartner analysts project that global data center electricity use will increase from 448 terawatt-hours (TWh) in 2025 to 980 TWh by 2030.
Solar will need to replace fossil fuels and scale fast, combining with storage, wind, or gas for reliable zero-emission power.
Big tech players like Microsoft, Google, Meta, and Amazon are investing heavily, and solar companies capable of multi-GW projects are likely to thrive, possibly leading to market consolidation.
Strong Climate Goals
Countries are setting ambitious targets to reduce emissions and limit global warming. Clean energy adoption is critical, as energy-related emissions make up a large share of greenhouse gases. Government policies, incentives, and renewable energy targets are boosting solar adoption worldwide.
Battery Energy Storage System (BESS) in Solar
Battery Energy Storage Systems (BESS) allow solar energy to be stored and used when needed, making solar power more reliable. These systems use batteries, including lithium-ion technology, to capture electricity from solar panels, wind, or other sources. The stored energy can then be used during cloudy periods, at night, or when electricity demand is high, ensuring a steady power supply.
Benefits of Solar Battery Storage
Maximizes Solar Usage – Stores excess energy for use when sunlight is unavailable.
Reduces Electricity Costs – Helps avoid high energy prices during peak hours.
Provides Backup Power – Ensures energy availability during power outages.
Fortune Business Insights reported that the global BESS market was worth $32.62 billion in 2025. It is set to grow to $40.45 billion this year and reach $161.12 billion by 2034, with a steady rise at 18.86% per year.
Growing Adoption Drives Market Growth
The Asia-Pacific region led the global BESS market, generating USD 17.31 billion in 2025 and expected to reach USD 21.32 billion in 2026.
Increased electrification in remote areas and major grid upgrades in countries like Japan, Australia, South Korea, India, and China are driving demand. Rising energy needs across residential, commercial, and industrial sectors are also boosting adoption of reliable backup and peak power solutions.
In North America, the market reached USD 11.18 billion in 2025 and is projected to grow to USD 14.23 billion in 2026.
Growth is supported by rising adoption in the U.S., alongside efforts to develop alternatives to lithium-based batteries, as China controls much of the global lithium-ion supply.
Top Players in the BESS Market
The global BESS market in 2026 is led by Contemporary Battery Technology Co. Ltd (CATL) with nearly 40% market share, followed by BYD at 16%.
Other major companies include EVE Energy, LG Energy Solution, Hithium, CALB, Engie, Gotion High-Tech, REPT Battero, Samsung SDI, and Tesla. These companies are expanding production and scaling innovative energy storage solutions to meet growing global demand.
Advantages of Solar Energy: Why Solar Energy is a Smart Choice
Solar power is endless and renewable. It provides practical benefits for homes and businesses, including:
Cuts Energy Bills –Solar panels produce free electricity, cutting monthly costs. Installation requires an initial investment, but long-term savings make it worthwhile. Financing options help reduce upfront expenses.
Reliable and Versatile – Solar works in many climates, even on cloudy days. Battery storage and net metering let homeowners use extra energy later. It suits both urban and rural areas.
Eco-Friendly Power – Solar energy produces no emissions. It reduces pollution and fights climate change. Rooftop panels utilize existing space, avoiding land disruptions.
Increases Property Value – Homes with solar panels sell for more. Many states offer tax exemptions, so solar is a smart financial choice.
Durable and Long-Lasting – Solar panels can last over 25 years with minimal maintenance. Warranties support long-term performance, ensuring reliable energy for decades.
Challenges in Adopting Solar Technology
Solar power has great potential, but several obstacles slow its adoption. Here are five major challenges:
High Initial Costs – Installation remains expensive, even with falling panel prices.
Intermittent Power Supply – Solar needs sunlight, so it can’t work at night or on cloudy days.
Land and Space Issues – Big solar farms require a lot of land. This can clash with farming.
Supply Chain Challenges: Solar panels require key materials, such as silicon and lithium. These materials may face shortages.
Grid Integration Issues – Traditional power grids weren’t built for intermittent, decentralized energy.
However, solving these challenges will boost solar adoption. For example, incentives cut costs, batteries store energy, and smart grids ensure reliability. Rooftop panels and floating farms save space, while recycling secures supply. Grid upgrades and microgrids improve stability, making solar more dependable.
Investment Trends: Top Solar Energy Stocks to Watch in 2026
The solar energy sector remains one of the most attractive investment themes in 2026. Solar leaders and infrastructure giants are benefiting from rising clean power demand, especially from AI-driven data centers.
After a volatile phase, the sector rebounded strongly in 2025 and continues to offer long-term growth opportunities. Analysts and industry pundits have revealed the most actively watched and high-potential solar stocks this month:
First Solar (FSLR) – A dominant solar manufacturer with a massive ~64 GW backlog stretching toward 2030. Strong demand visibility and capacity expansion continue to support long-term growth.
Nextracker (NXT) – A global leader in solar tracking systems. The company is scaling fast with strong revenue visibility, solid backlog, and consistent institutional inflows.
Clearway Energy (CWEN) – Operates over 13 GW of renewable and storage assets. Long-term PPAs, including deals with big tech, provide stable earnings and predictable cash flow.
NextEra Energy (NEE) – One of the largest clean energy producers globally. Its expanding wind, solar, and battery portfolio is benefiting from rising electricity demand driven by AI and cloud growth.
Brookfield Renewable Partners (BEP) – Offers scale and stability with most cash flows locked in long-term contracts. Strong investment pipeline and partnerships with tech firms support steady growth.
Solar and renewable stocks for this year combine growth and stability. Manufacturing leaders like FSLR and NXT offer expansion upside, while CWEN, NEE, and BEP provide steady returns backed by long-term contracts. The AI-energy link is emerging as a major catalyst for the sector.
Solar panel prices have fallen sharply over time. In the 1970s, they cost more than $100 per watt. By 2023–2024, prices dropped to about $0.25 per watt.
The International Renewable Energy Agency (IRENA) reported that solar power costs dropped to about $0.043 per kWh in 2024, making it one of the cheapest energy sources today.
However, the steep decline has now slowed. Prices are no longer falling fast. Instead, they are stabilizing, with slight increases in some regions.
In 2026, they mostly sit between $0.18 and $0.25 per watt.
One major reason is China’s policy shift. The country removed export tax rebates on solar modules in 2026, pushing global prices up by around 10–15%. At the same time, demand remains strong and supply chains are more balanced, which keeps prices steady rather than falling.
Utility Solar Stays Cheap, But Home Systems Cost More
Large solar projects still get the lowest prices because they buy in bulk. In many leading markets like India and parts of Europe, solar electricity costs are now often below $50 per MWh.
Residential systems, however, are more expensive. According to the National Renewable Energy Laboratory, home solar systems cost about $2.5 to $3.5 per watt before incentives. This is because the total cost includes installation, inverters, mounting, and permits. Panels themselves only account for a portion of the total cost.
China remains the cheapest producer, with module prices around $0.10–$0.12 per watt in 2026, due to large-scale manufacturing and oversupply.
United States sees higher prices due to tariffs and trade restrictions, which can add $0.10–$0.15 per watt on imported modules.
India typically falls in the middle, with module prices roughly around ₹70–80 per watt (~$0.20–$0.25 per watt) depending on type and scale.
This gap shows how local policies and supply chains directly impact solar costs.
The Shift: From Cheaper Panels to Better Performance
As per analysts the market is now moving from rapid price drops to steady improvement.
Modern solar panels are more efficient and last longer than before. They also lose performance more slowly over time. So even if upfront prices are not falling much, the overall value of solar energy continues to improve.
At the same time, further cost reductions are getting harder. Manufacturing is already highly efficient, and savings in materials are smaller. Costs also depend on factors like polysilicon prices, energy use in factories, and global trade conditions.
Solar is no longer getting dramatically cheaper each year, but it remains one of the most affordable energy sources worldwide. The trend has shifted from fast price drops to stable pricing, with better technology driving long-term value.
Solar Energy and Carbon Credits
Solar power not only cuts carbon emissions but also creates extra income through Solar Renewable Energy Credits (SRECs). Each SREC equals one megawatt-hour (MWh) of clean electricity. Solar owners can sell these credits to utilities in states with Renewable Portfolio Standards (RPS). New Jersey and California are the largest SREC markets, offering strong demand and steady opportunities for solar investors.
How SRECs Work
Every 1 MWh of solar electricity earns one SREC, tracked through official state systems—PJM-GATS in New Jersey and California’s registry. Utilities buy these credits to meet renewable energy targets. Prices vary depending on supply and demand.
For instance,
New Jersey: SREC prices are relatively stable, favoring long-term contracts.
California: High volumes from large projects drive activity, but prices can be more volatile.
SRECs provide an additional revenue stream beyond electricity sales, making solar investments more profitable.
Federal Tax Incentives in 2026
The Residential Solar Investment Tax Credit (30%) expired after December 31, 2025, so new residential solar installations in 2026 cannot claim this credit. However, commercial and utility-scale projects may still qualify for reduced federal incentives under Section 48E.
These can range from 26–40% if projects meet eligibility rules. Battery storage paired with solar may also qualify for limited incentives, especially when installed with pre-2026 systems.
Selling SRECs
Solar owners register their systems with the state tracking authority. Smart meters verify electricity production, and SRECs are issued monthly or quarterly. Owners can sell credits via:
Long-term contracts: Offer stable pricing, usually between $50–$150 per MWh.
Spot markets: Can offer higher returns but are less predictable.
Careful planning and monitoring of SREC markets help maximize returns. Additionally, combining solar with BESS increases revenue potential.
Residential vs Utility-Scale Solar
Residential systems: Focus on stable SREC contracts, local rebates, and battery storage for self-consumption.
Utility-scale projects: Benefit from federal incentives, bulk SREC sales, and corporate power purchase agreements (PPAs), making them attractive for investors.
Investing in solar isn’t just good for the environment—it’s a smart financial move. With the right strategy, solar owners can lower costs, earn revenue, and contribute to a greener future. In the broader context, major tech companies like Amazon, Google, Meta, and Microsoft are investing heavily in solar energy and credits to reach net-zero emissions.
Smarter Solar: Community, Microgrids, and AI Power the Future
Community Solar Projects
Community solar is transforming access to renewable energy by letting multiple people share a single solar installation. Instead of installing panels on their own rooftops, participants join an off-site solar farm and receive credits on their electricity bills for the energy produced.
According to the US DOE, these projects feed electricity into the utility grid, making solar energy affordable and accessible. Community solar benefits homeowners, renters, and businesses who cannot install rooftop panels, particularly low- and moderate-income households, while supporting national sustainability goals and reducing electricity costs.
Source: NREL
Microgrids and Decentralized Energy
Traditional grids are becoming less reliable and more expensive, driving a shift toward decentralized energy systems. Microgrids are small, independent networks that operate alone or alongside the main grid, using local energy sources such as solar panels, wind, hydrogen, and battery storage.
They offer energy independence, resilience during outages, greater efficiency by reducing transmission losses, and cleaner power through renewable integration. Companies are increasingly adopting on-site solar and storage to cut costs and reduce reliance on the grid.
Precedence Research data revealed that the global microgrid market was valued at USD 51.40 billion in 2025 and is projected to reach USD 236.18 billion by 2034, growing at a CAGR of 18.52%.
AI Integration in Solar Systems
Artificial intelligence is boosting solar energy efficiency, reliability, and cost-effectiveness. AI predicts energy demand, balances supply, reduces waste, and enhances grid stability. It enables predictive maintenance, early fault detection, and better energy forecasting. AI also optimizes solar panel placement, manages battery storage, and improves customer experience with real-time insights.
Additionally, AI accelerates solar research and innovation, helping panels become more efficient and durable. These technologies are shaping the future of renewable energy, making clean, reliable power increasingly accessible worldwide.
From Panels to Powerhouses: 2026’s Solar Efficiency Boom
Solar cell efficiency shows how much sunlight a panel can turn into electricity. Higher efficiency means more power from the same space. In 2026, commercial solar panels are surpassing 25% efficiency, while new materials like perovskites push lab records above 30%, making solar cheaper and more effective, especially in countries like India.
Perovskite Solar Cells
Perovskite cells can capture a wider range of sunlight, especially when stacked with silicon in tandem designs. Tandem panels layer perovskite on silicon to catch more sunlight. Labs now report efficiencies over 30%.
In November 2023, LONGi’s crystalline silicon-perovskite tandem solar cell was certified by NREL at 33.9% efficiency, beating standard silicon panels. Recent improvements make them more durable outdoors and closer to commercial use.
Image sourced from greenfueljournal
Bifacial and n-Type Panels
Bifacial panels collect sunlight from both sides, boosting output by 5–20%, making them great for ground-mounted farms. n-Type panels like TOPCon and HJT offer 22–24% efficiency, resist degradation, and perform well in hot climates.
Conclusion
Solar energy has moved past its early growth phase. It is now entering a mature, high-impact era where innovation, storage, and digital intelligence define its value.
While challenges like intermittency, land use, and supply chains remain, solutions are scaling just as fast. Most importantly, AI and electrification will accelerate demand. Tech giants such as Microsoft, Google, Amazon, and Meta are already fueling solar expansion to power data centers and AI infrastructure.
As electricity demand nearly doubles in some sectors, solar paired with storage will play a critical role in replacing fossil fuels.
In short, the transition is clear: from cheaper panels to smarter power systems—and from rapid growth to global energy transformation.
https://globalcarbonfund.com/wp-content/uploads/2018/10/GCF_header_logo_340x156.png00carbonfundhttps://globalcarbonfund.com/wp-content/uploads/2018/10/GCF_header_logo_340x156.pngcarbonfund2026-07-20 16:14:252026-07-20 16:14:25The Ultimate Guide to Solar Energy: Everything You Need to Know in 2026 and Beyond
As global economies accelerate decarbonization, attention is shifting beyond electricity toward harder-to-abate sectors that still rely on liquid fuels. Transport, aviation, and shipping account for a large share of global energy-related CO₂ emissions, with transport alone contributing around one-quarter, according to the International Energy Agency (IEA).
Electrification is changing passenger vehicles, but it’s slow in heavy-duty transport, aviation, and shipping. This is because of energy density needs and infrastructure limits. This gap has brought biofuels back into focus as a key part of the energy transition.
Biofuels are liquid or gaseous fuels made from organic materials such as crops, agricultural waste, used cooking oil, and algae. They can usually fit into current engines with little change. This makes them crucial for areas where full electrification isn’t practical yet.
Today, biofuels supply about 4–5% of global transport fuel demand. However, their role is expected to grow, particularly in aviation and heavy transport, where demand is projected to increase under net-zero pathways outlined by the IEA.
The industry is moving from first-generation crop-based fuels to advanced biofuels made from waste and non-food materials. This shift is driven by sustainability concerns and changing policies like the EU RED III and U.S. RFS.
This guide explores the biofuels landscape, including production methods, fuel types, market trends, policy drivers, and future outlook.
1. What Are Biofuels? A Renewable Alternative to Fossil Fuels
Biofuels are fuels made from recently living organic materials, also known as biomass. These include plants, algae, agricultural residues, forestry waste, and used cooking oils.
Unlike fossil fuels, which take millions of years to form, biofuels are part of the modern carbon cycle. The carbon they release during combustion was recently absorbed from the atmosphere as the biomass grew.
This is important for climate impact. In theory, biofuels can reduce greenhouse gas emissions compared to fossil fuels. However, results vary widely depending on feedstocks, production methods, and land-use changes.
Biofuels are generally divided into liquid and gaseous fuels, and further grouped by “generation” based on feedstock type and technology maturity.
Main Types of Biofuels
Ethanol (Alcohol-Based Fuel):
Ethanol is the most widely used biofuel globally and is mainly blended with gasoline. It is produced by fermenting sugars and starches from crops such as corn and sugarcane. It is then distilled and used as a fuel additive.
Key points:
Common blends: E10, E85
Major producers: the United States and Brazil
Largest biofuel by global volume (EIA data)
Ethanol helps reduce emissions, but its climate performance depends on farming practices, fertilizer use, and land conversion.
Biodiesel (FAME):
Biodiesel is made from vegetable oils, animal fats, or recycled cooking oil through a process called transesterification. It is used in diesel engines, either pure (B100) or blended (B20).
Common feedstocks include:
Soybean oil (U.S., Brazil)
Rapeseed oil (EU)
Palm oil (Southeast Asia)
Biodiesel generally reduces particulate emissions and lifecycle carbon intensity compared to diesel. However, some feedstocks, especially palm oil, raise concerns over deforestation and land-use change.
Renewable Diesel (HVO):
Renewable diesel is chemically different from biodiesel. It is produced through hydrotreatment and is almost identical to petroleum diesel.
Key advantages include:
Fully compatible with existing engines
Higher energy density than biodiesel
Better cold-weather performance
Lower emissions when made from waste feedstocks
It is increasingly used in California and parts of Europe as a low-carbon diesel substitute.
Sustainable Aviation Fuel (SAF)
SAF is a fast-growing biofuel designed for aircraft and can be blended with jet fuel without engine changes. It can be made from:
Used cooking oil
Agricultural residues
Synthetic pathways (power-to-liquid)
According to the International Civil Aviation Organization (ICAO), SAF could deliver over 60% of the emissions reductions needed for aviation to reach net zero by 2050. However, growth is limited by high costs and limited feedstock supply.
Source: ICAO
Biogas and Biomethane
Biogas is produced from organic waste such as manure, sewage, and food waste through anaerobic digestion. It contains methane and carbon dioxide. When purified, it becomes biomethane, which can be used as:
Transport fuel
Gas grid injection
It plays two key roles: waste management solution and renewable energy source. It is especially important in agricultural regions with large organic waste streams.
Biofuel “Generations”: First, Second, and Third
Biofuels are also classified into generations based on feedstock sustainability and technological maturity. Here is how these generations differ from one another.
First-Generation Biofuels
Derived from food crops (corn, sugarcane, vegetable oils)
Most commercially mature
Controversial due to the food vs fuel debate
Second-Generation Biofuels
Derived from non-food biomass (agricultural residues, wood waste)
Lower competition with food systems
More complex and expensive to produce
Third-Generation Biofuels
Derived from algae
Extremely high theoretical yields per land area
Still largely in pilot and early commercialization stages
Advanced Biofuels (Cross-Cutting Category)
Includes second- and third-generation fuels plus waste-based pathways such as used cooking oil and municipal solid waste conversion. These are increasingly prioritized in climate policy frameworks due to better lifecycle emissions performance.
Energy Density and Performance vs. Fossil Fuels
One of the key technical constraints of biofuels is energy density, which affects efficiency in transport applications.
Gasoline and diesel remain highly energy-dense liquid fuels.
Ethanol has a lower energy content per liter than gasoline.
Biodiesel and renewable diesel are closer to fossil diesel, but still vary depending on feedstock and processing.
This is why biofuels are often used in blended form, rather than as full replacements in most transport systems.
Data source: AFDC (Alternative Fuels Data Center)
2. Lifecycle Emissions of Biofuels: Why LCA Matters
When evaluating biofuels, the key question is not ‘Are biofuels zero emissions?’ but ‘What is the full lifecycle carbon intensity of this pathway versus fossil fuel baselines?’”
Unlike fossil fuels, biofuels cannot be evaluated based solely on tailpipe emissions. Their climate impact depends on a full lifecycle assessment (LCA), which includes:
Feedstock cultivation,
Land-use change,
Processing and refining,
Transportation, and
End-use combustion.
This means that some biofuels can reduce emissions by 50–80% compared to fossil fuels. Meanwhile, others may deliver much smaller benefits—or even net increases—if land-use change is significant.
This variability is a key reason why biofuels are important and debated in global climate policies.
Now that we know what biofuels are and how they’re classified, let’s look at their importance in the global energy shift. Why do governments and industries keep investing in them, even with options like electrification and hydrogen?
3. Why Biofuels Matter in the Energy Transition
Despite rapid growth in renewable electricity and electric vehicles, global emissions remain concentrated in sectors that are difficult to electrify. The IEA states that transport makes up around 24% of global energy-related CO₂ emissions. Aviation and shipping are among the fastest-growing emission sources.
The main challenge is not only emissions, but physical constraints. Aircraft, ships, and long-haul trucks require fuels with high energy density, fast refueling, and long operating range. Current battery technology cannot yet meet these needs at scale.
This is why biofuels remain important as a transitional solution in the energy mix.
Where Biofuels Fit in Transport
Biofuels play different roles depending on the transport segment.
Road transport: This is the most electrified segment, but internal combustion engines still dominate in many regions and in freight. Ethanol and biodiesel are widely used as blending fuels to reduce emissions without changing existing infrastructure.
Aviation: Aviation is one of the most important growth markets for advanced biofuels. It contributes around 2–3% of global CO₂ emissions, but its overall climate impact is higher due to non-CO₂ effects such as contrails.
Maritime shipping: Shipping accounts for nearly 3% of global emissions (IMO data). While hydrogen and ammonia are being explored, bio-based marine fuels remain one of the few near-term, scalable options compatible with existing engines.
The Drop-In Advantage
One of the key strengths of biofuels is their compatibility with existing systems. Unlike electrification, which requires new infrastructure, biofuels can often be used with minimal changes.
They work with:
existing combustion engines,
existing fuel distribution networks, and
existing storage systems.
This reduces transition costs, especially in sectors with long asset lifetimes such as aviation and shipping, where equipment can operate for 20–30 years.
Energy Security and Fuel Diversification
Beyond emissions reduction, biofuels are increasingly linked to energy security. Recent energy shocks caused by the US-Israel and Iran war have highlighted the risks of relying heavily on imported fossil fuels.
Biofuels help countries reduce oil import dependence, diversify energy supply, and strengthen local agricultural and waste value chains.
For example, Brazil uses sugarcane ethanol as a major domestic fuel source, reducing gasoline imports. The United States and the European Union also integrate biofuels into national fuel policies to improve energy resilience.
4. Policy as the Main Growth Driver
Biofuels are highly policy-driven compared to many other energy technologies. Demand is largely created through regulation rather than pure market economics. The key frameworks today include:
U.S. Renewable Fuel Standard (RFS): mandates blending of ethanol and biodiesel
EU Renewable Energy Directive (RED III): sets renewable transport targets and prioritizes advanced biofuels
Low Carbon Fuel Standards (LCFS): reward fuels based on lifecycle carbon intensity
These systems create a guaranteed demand floor even when biofuels are not yet cost-competitive with fossil fuels.
5. Corporate Demand and Net-Zero Commitments
Corporate climate strategies are becoming a major driver of biofuel demand, especially in aviation and logistics.
Airlines and shipping companies are signing long-term contracts for sustainable aviation fuel (SAF) and renewable diesel to meet emissions targets. This is important because aviation is difficult to decarbonize, and SAF is currently one of the only scalable compliance options.
Biofuels are not uniform in their climate impact. Lifecycle emissions vary widely depending on feedstock type, production method, land-use change, and transport distance.
According to IEA and OECD findings:
Waste-based biofuels can reduce emissions by 50–90%.
Some crop-based biofuels deliver much lower reductions when land-use impacts are included.
This is driving a policy shift toward advanced biofuels that avoid food competition and reduce land-use risks.
Why Biofuels Still Matter in a World of EVs
Even with rapid electric vehicle growth and early hydrogen development, biofuels remain important because they fill a specific gap in the energy transition.
EVs dominate light-duty transport.
Hydrogen is still early-stage and infrastructure-heavy.
Biofuels work in existing high-energy systems today.
In other words, biofuels are not competing with electrification. They are filling the last-mile decarbonization gap in liquid fuel-dependent sectors.
With the strategic role of biofuels established, the next step is to understand how they are actually produced.
6. How Biofuels Are Produced
Biofuel production is not a single process. It is a group of industrial methods that convert biological materials into liquid or gaseous fuels. The process depends on the feedstock, technology used, and final fuel type.
According to the IEA, most commercial biofuels today come from a few main pathways: ethanol fermentation, biodiesel production, hydrotreated renewable diesel (HVO), and emerging aviation fuel technologies such as HEFA and alcohol-to-jet.
Together, these make up the majority of the global biofuel supply, which is around 170 billion liters annually.
Feedstocks: The Starting Point
All biofuels begin with biomass feedstocks. These materials strongly influence cost, emissions, and scalability.
Source: Our World in Data
Conventional feedstocks include corn, sugarcane, soybean oil, rapeseed oil, and palm oil. These dominate current production because they are widely available and supported by existing agricultural systems. However, they can raise concerns about land use, food competition, and indirect emissions.
Advanced feedstocks are increasingly preferred in climate policy. These include used cooking oil, animal fats, agricultural residues, forestry waste, municipal solid waste, and non-food energy crops. These materials generally offer lower lifecycle emissions, but supply is limited.
The IEA notes that waste-based feedstocks currently represent a smaller share of production but must grow significantly to align with net-zero scenarios.
Ethanol: Fermentation-Based Fuel
Ethanol is the most widely produced biofuel and is mainly blended into gasoline.
It is made by fermenting sugars and starches from crops such as corn and sugarcane. The process involves breaking down plant material into sugars, fermenting them into alcohol, and then refining the fuel.
Its main limitation is its dependence on agricultural inputs. Fertilizer use, land conditions, and crop yields all affect its overall emissions performance.
Biodiesel: Oil-Based Conversion
Biodiesel is produced from vegetable oils, animal fats, and waste oils through a chemical process called transesterification. This process converts oils into fatty acid methyl esters (FAME), which can be used in diesel engines.
It is commonly blended with diesel in mixtures such as B20.
Production costs are highly sensitive to feedstock prices, which can account for 70–90% of total costs according to industry and IEA-related estimates. This makes biodiesel economically volatile.
Sustainability concerns also exist, particularly around palm oil, which has been linked to deforestation in some regions.
Renewable Diesel (HVO)
Renewable diesel is chemically different from biodiesel. It is produced through hydrotreatment, where feedstocks are processed with hydrogen under high temperature and pressure.
The result is a fuel that closely resembles petroleum diesel.
Key advantages include full engine compatibility, higher energy density, and lower emissions when made from waste-based feedstocks. It also performs better in cold conditions.
The U.S. Energy Information Administration (EIA) reports that renewable diesel capacity is growing fast. Meanwhile, biodiesel has stalled in some markets because of competition for feedstock.
Sustainable Aviation Fuel (SAF)
SAF is one of the fastest-growing biofuel segments. It is designed to match jet fuel properties while reducing lifecycle emissions.
Source: IEA
It is produced through several pathways, including HEFA, alcohol-to-jet (ATJ), and Fischer-Tropsch synthesis using biomass or waste gases.
SAF can reduce lifecycle emissions by up to 80% compared to conventional jet fuel, depending on feedstock and production method. However, scaling remains difficult due to:
limited sustainable feedstocks,
high production costs, and
early-stage infrastructure.
Advanced Biofuels and New Pathways
Next-generation biofuels aim to expand feedstock flexibility and improve efficiency. These include gasification, pyrolysis, cellulosic ethanol, and alcohol-to-jet technologies.
The IEA estimates that advanced biofuels could represent over 40% of total supply in net-zero scenarios by 2030. However, current production costs are often 2–3 times higher than those of fossil fuels, though they will decline with scale.
Key Production Reality: Cost Structure
Across all biofuel types, one factor dominates: feedstock cost.
In many cases, 70–95% of the total production cost comes from feedstock procurement. This creates a structural trade-off:
Waste-based fuels offer better emissions performance but limited supply, while crop-based fuels are scalable but raise sustainability concerns.
This balance between cost, scale, and sustainability defines the entire biofuels industry.
7. Types of Biofuels and Their Industrial Applications
Biofuels are not a single-market solution. Their role depends on how different fuel types fit into specific sectors with different energy needs, infrastructure, and decarbonization limits.
According to the International Energy Agency, more than 90% of liquid biofuels are currently used in road transport. However, this is slowly changing as aviation and shipping emerge as higher-value demand areas due to limited low-carbon alternatives.
Road Transport: The Largest Market
Road transport is the most mature biofuel market, mainly using ethanol and biodiesel.
Ethanol is blended into gasoline to reduce emissions and improve fuel performance. Biodiesel and renewable diesel are blended into diesel to lower particulate emissions and lifecycle carbon intensity.
The United States and Brazil dominate ethanol use, supported by long-term blending mandates and strong agricultural supply chains. Brazil’s system is particularly integrated, where ethanol can represent a significant share of fuel demand depending on sugarcane output.
Europe has historically led biodiesel adoption, but renewable diesel (HVO) is growing faster due to better performance and full compatibility with existing engines.
However, road transport is increasingly electrifying, which is expected to limit long-term biofuel growth in this segment.
Aviation: The Fastest-Growing Demand Segment
Aviation is becoming the most important growth market for advanced biofuels, especially sustainable aviation fuel. Unlike road transport, aviation has no near-term electrification option due to energy density constraints.
Today, SAF production remains small compared to global jet fuel demand but is growing quickly through policy support and airline commitments in Europe, the U.S., and Asia.
However, it remains expensive and limited by feedstock supply, making it a premium decarbonization fuel rather than a mass-market product.
Maritime Shipping: Early but Growing Adoption
Shipping contributes about 3% of global emissions, according to the International Maritime Organization (IMO). While the sector is harder to decarbonize, it is exploring multiple fuel options.
Biofuels such as biodiesel and renewable diesel are being tested as transitional fuels because they can be used in existing engines. However, adoption is uneven due to cost differences and a lack of fuel standardization.
As global emissions regulations tighten, biofuels are expected to play a growing compliance role, even if they are not the long-term solution.
Industrial Heat and Power
Biofuels are also used in industrial heat and power generation, especially in regions with abundant agricultural or forestry waste. Biogas and biomass fuels are used to replace coal and natural gas in thermal processes.
Although this is a smaller market, it is important in local decarbonization strategies. In parts of Europe, biomethane is also injected into natural gas grids, reducing fossil fuel use without changing end-use systems.
Market Shift: From Volume to Value
A key trend in biofuels is a shift from high-volume fuels like ethanol toward high-value fuels like SAF and renewable diesel. This shift is driven by:
Road transport electrification reducing long-term demand.
A higher willingness to pay in aviation and shipping.
Policy focuses on lifecycle emissions rather than volume.
As a result, future growth will rely less on total fuel volume. Instead, it will focus on how we allocate limited sustainable feedstocks for the greatest climate impact.
8. Global Policy and Regulatory Landscape for Biofuels
Biofuels are one of the most policy-driven energy markets. Unlike technologies that scale mainly through cost reductions, biofuels depend heavily on regulation, mandates, and subsidies.
In most regions, demand is not driven purely by market pricing but by government requirements and carbon accounting systems. This makes policy the central force shaping biofuel growth, with very different approaches across regions.
United States: Renewable Fuel Standard (RFS)
The United States has one of the biggest biofuel markets because of the Renewable Fuel Standard (RFS). The RFS requires fuel suppliers to mix renewable fuels into the national fuel supply.
Under this system, companies must meet annual Renewable Volume Obligations (RVOs), creating guaranteed demand for ethanol, biodiesel, and advanced biofuels. This has supported both domestic production and agricultural feedstock markets.
According to the U.S. Energy Information Administration, ethanol dominates U.S. biofuel consumption by volume. However, renewable diesel and biodiesel are growing faster, supported by stricter low-carbon fuel policies at the state level, especially in California.
Source: EIA
This shows a split system. Federal rules set the basic demand while state policies boost growth for higher-value, low-carbon fuels.
Brazil: Integrated Ethanol System
Brazil has one of the most developed biofuel systems globally, built around sugarcane ethanol and flexible-fuel vehicle (FFV) technology.
Since 2003, FFVs have become dominant in the country, representing roughly 98% of new car sales and about 90% of the light-duty fleet. These vehicles can run on gasoline, pure ethanol, or any blend of the two, allowing ethanol to directly compete with gasoline at the pump, depending on fuel prices and supply conditions.
Brazil also maintains one of the world’s highest gasoline ethanol blending mandates at roughly 27%, reinforcing ethanol’s central role in the national transport fuel system.
Key strengths of this system include:
high sugarcane productivity per hectare,
strong lifecycle emissions performance, and
long-term policy stability.
Brazil’s model is widely viewed as one of the most effective large-scale ethanol systems, although its expansion is still tied to land availability and agricultural output.
European Union: Strict Sustainability Rules
The European Union has one of the most advanced regulatory systems for biofuels under the Renewable Energy Directive (RED III). Its policy is shifting away from crop-based fuels toward advanced and waste-based biofuels due to concerns over land use and indirect emissions.
Key features of RED III include:
binding renewable energy targets for transport,
limits on high-risk feedstocks linked to deforestation, and
strict lifecycle emissions accounting.
The EU is also moving from volume-based mandates to carbon-intensity regulation, where fuels are assessed based on total lifecycle emissions rather than renewable content alone.
Asia-Pacific: Energy Security Driven Policies
In Asia, biofuel policy is largely driven by energy security and import reduction goals.
China has introduced ethanol blending pilots in selected regions, mainly to reduce oil imports and manage crop surpluses, though rollout remains gradual.
India has taken a more aggressive approach, setting national ethanol blending targets to reduce crude oil dependence and support rural incomes.
Southeast Asia, particularly Indonesia and Malaysia, focuses heavily on biodiesel blending due to strong palm oil production. However, these programs face international pressure over deforestation concerns, leading to stronger sustainability certification systems.
9. Carbon Markets and Fuel Standards
Beyond mandates, carbon pricing systems are becoming increasingly important for biofuels.
The most influential example is California’s Low Carbon Fuel Standard (LCFS), which assigns carbon intensity scores to fuels. Low-emission fuels generate tradable carbon credits, improving project economics. This links biofuels directly to carbon markets, rewarding emissions reductions rather than fuel volume.
Similar systems are expanding in Canada and Europe, signaling a shift toward performance-based fuel regulation focused on lifecycle carbon intensity.
Across all regions, biofuel policy is shifting from volume-based blending mandates to carbon-based performance systems. Instead of simply requiring renewable fuel use, newer frameworks focus on:
lifecycle emissions,
feedstock sustainability, and
carbon intensity reduction.
This is reshaping the industry toward:
waste-based feedstocks,
advanced conversion technologies, and
high-value fuels like SAF and renewable diesel.
In effect, success in biofuels is no longer measured by production volume alone, but by verified emissions reductions per unit of fuel.
10. Global Biofuel Market Size, Key Players, and Economic Trends
The global biofuels market has grown from a niche renewable segment into a large industrial system embedded in transport fuel supply chains. Global biofuel demand is now about 170 billion liters each year. This growth is mainly from ethanol and biodiesel used in road transport, according to the IEA.
Likewise, global biofuel production increased 7x in the last two decades, as shown below.
The market is valued at over $150 billion. Estimates vary based on policy support, feedstock supply, and how quickly advanced fuels are adopted. Growth is now focused more on higher-value segments. This includes renewable diesel and sustainable aviation fuel (SAF), instead of traditional blending fuels.
Despite this scale, the industry is large, but it stays regional and fragmented. It relies heavily on local feedstocks and policies.
Key Industry Players: A Hybrid Value Chain
The biofuels industry sits at the intersection of agriculture, energy, and chemicals, meaning its players span multiple sectors.
Agribusiness and Feedstock Leaders
Agribusiness companies play a central upstream role, supplying feedstocks such as corn, sugarcane, and vegetable oils. Globally, corn ethanol and sugarcane ethanol still dominate the liquid biofuel supply. Ethanol alone accounts for the majority of biofuel production by volume.
Key players in this segment include:
Archer Daniels Midland Company — one of the world’s largest corn processors and a major ethanol producer in North America.
Cargill — a global agribusiness leader supplying oilseeds and biofuel feedstocks.
POET LLC — one of the largest bioethanol producers in the United States.
Raízen — a major producer of sugarcane ethanol and one of the largest bioenergy firms globally.
In Brazil, integrated sugarcane systems led by companies like Raízen are central to ethanol supply, supported by long-established agricultural infrastructure.
Energy Majors and Refining Conversions
Energy majors are increasingly active in renewable diesel and sustainable aviation fuel (SAF). These firms are repurposing existing refinery infrastructure into hydroprocessing units rather than building entirely new refining systems, a key advantage in scaling drop-in fuels.
Major participants include:
Neste— the world’s largest producer of renewable diesel and SAF.
Chevron — expanding renewable diesel production in North America.
Valero Energy Corporation — a major producer of renewable diesel through its joint ventures.
TotalEnergies — investing heavily in SAF and renewable fuels across Europe.
BP — developing biofuels alongside broader low-carbon energy transition strategies.
These companies are leveraging refinery conversion strategies, particularly in the United States and Europe, where existing infrastructure can be adapted for renewable feedstocks such as used cooking oil and animal fats.
Advanced Biofuel and Clean-Tech Producers
Specialized biofuel producers and clean-tech firms are expanding in advanced segments such as SAF and waste-based fuels. These companies focus on technologies like hydroprocessed esters and fatty acids (HEFA), gasification-to-liquids, and alcohol-to-jet conversion.
Notable players include:
LanzaJet — focused on alcohol-to-jet SAF technology.
Gevo — developing low-carbon fuels and SAF from renewable feedstocks.
Aemetis — producing renewable fuels and developing SAF projects.
World Energy — one of the earliest commercial SAF producers in the United States.
These firms are critical in pushing innovation beyond first-generation biofuels, particularly into aviation and waste-based pathways where scalability remains constrained but strategic importance is high.
Structural Outcome: A Multi-Layer Value Chain
This creates a hybrid industrial structure where agriculture, refining, and technology firms operate across different stages of the same value chain.
Unlike conventional fossil fuel markets, value creation is distributed across:
upstream agribusiness feedstock supply,
midstream refining and conversion infrastructure, and
downstream fuel distribution and policy-driven markets.
The result is a fragmented but increasingly interconnected ecosystem, where partnerships between agribusiness firms, energy majors, and clean-tech developers are becoming essential for scaling next-generation biofuels.
Cost Structure and Economic Drivers
A defining feature of biofuels is their cost structure. Unlike fossil fuels, where production is relatively standardized, biofuel economics are highly sensitive to feedstock pricing and logistics.
Across most commercial pathways, feedstocks represent the largest share of total production cost, commonly estimated at ~50% to 90% of total cost in biodiesel and renewable diesel systems, depending on input type and market conditions.
This creates strong exposure to agricultural commodity cycles. Rising prices for vegetable oils or crops like corn can quickly compress margins, while periods of oversupply improve competitiveness.
Waste-based feedstocks such as used cooking oil and animal fats improve lifecycle emissions performance and policy eligibility, but they are structurally constrained in supply, limiting scalability.
Advanced fuels like SAF remain significantly more expensive than conventional jet fuel. Industry estimates typically place SAF at 2× to 5× the cost of fossil jet fuel, depending on feedstock type and production pathway.
Source: Rhodium Group
The IATA estimates that SAF could contribute a large share of aviation decarbonization—up to ~65% of required emissions reductions for net-zero aviation pathways, but only if costs fall and supply scales significantly.
As a result, the industry depends heavily on policy support, including:
blending mandates,
tax credits and production incentives, and
carbon pricing systems.
Investment Trends and Capital Flows
Investment in biofuels is increasingly focused on renewable diesel and sustainable aviation fuel (SAF). These fuels benefit from stronger policy support and higher value markets than ethanol and biodiesel. According to the IEA, global biofuel demand could grow by about 20% between 2023 and 2028, with most growth coming from advanced fuels.
Renewable diesel has grown quickly in North America and Europe. Much of this growth comes from refinery conversions, which are cheaper than building new plants.
In the United States, renewable diesel capacity has reached over 6 billion gallons per year (about 23–25 billion litres) in the mid-2020s. Growth is supported by policies like the Renewable Fuel Standard and California’s Low Carbon Fuel Standard.
SAF is still very small today. The International Air Transport Association estimates it made up less than 0.2% of global jet fuel use in 2023. But it is becoming the main long-term focus for investment.
There are now more than 100 SAF projects announced around the world. Many airlines and energy firms are signing long-term supply contracts. These contracts often run for 10 to 20 years. This helps reduce investment risk.
Policy support is also growing. The EU ReFuelEU Aviation rule requires SAF blending to start at 2% in 2025, rising to 70% by 2050. In the United States, the Inflation Reduction Act provides SAF tax credits of up to $1.75 per gallon, depending on carbon intensity.
These policies are helping shift investment toward low-carbon fuels instead of traditional biofuels. Overall, capital flows are shifting away from commodity ethanol/biodiesel expansion toward specialized, high-margin, policy-backed fuels.
11. Future Outlook: Where Biofuels Are Headed
The future of biofuels is defined less by whether demand will grow and more by where that demand will concentrate. In most net-zero pathways modeled by the International Energy Agency, biofuels remain a critical but targeted solution, not a universal substitute for fossil fuels.
Across these scenarios, global biofuel demand rises meaningfully toward mid-century, but growth is uneven across sectors.
Road transport currently accounts for the majority of consumption but is expected to grow more slowly over time due to accelerating electrification, particularly in passenger vehicles. In contrast, aviation and maritime shipping become the dominant long-term growth drivers because they are significantly harder to electrify.
Demand Growth Will Be Uneven Across Sectors
While total biofuel production is projected to expand under net-zero scenarios, demand is increasingly concentrated in specific sectors.
Road transport: mature market with slowing growth
Aviation: fastest-growing demand segment
Shipping: emerging structural demand driver
The IEA highlights that sustainable biofuel supply must scale significantly by 2030 to remain aligned with net-zero pathways, particularly for sectors where electrification is limited.
Sustainable Aviation Fuel: The Core Growth Engine
Among all biofuel segments, SAF is expected to dominate long-term growth.
Aviation contributes roughly 2–3% of global CO₂ emissions, but its decarbonization is disproportionately difficult due to energy density requirements. This makes SAF one of the few viable near-term solutions. However, current SAF production remains extremely limited—still well below 1% of global jet fuel supply.
Key constraints include:
limited sustainable feedstock availability,
production costs that remain 2–5× higher than conventional jet fuel, and
early-stage global refining capacity.
As a result, SAF expansion depends heavily on:
policy mandates (blending requirements),
subsidies and tax incentives, and
long-term airline offtake agreements.
Feedstock Constraints Will Define Scaling Limits
A structural constraint across the entire biofuels industry is feedstock availability. Unlike wind or solar energy, biofuels are fundamentally limited by biomass supply chains.
Sustainable feedstocks—such as used cooking oil, agricultural residues, and forestry byproducts—are widely considered the lowest-carbon inputs due to lifecycle emissions advantages. However, their availability is inherently finite.
This creates a long-term structural tension between scaling production to meet decarbonization targets and maintaining strict sustainability and land-use standards.
As demand increases, competition for these feedstocks is expected to intensify, potentially increasing prices and forcing focus toward:
aviation (highest-value use case)
shipping and heavy industry
compliance-driven blending markets
Technology Shift Toward Advanced Biofuels
The technological direction of the industry is clearly moving toward advanced biofuel pathways.
First-generation fuels such as corn ethanol and conventional biodiesel are expected to grow more slowly over time due to sustainability concerns, land constraints, and competition with food systems.
In contrast, advanced fuels could expand their share of supply. Key technologies include:
hydrotreated renewable diesel,
alcohol-to-jet (ATJ) conversion,
biomass gasification and Fischer-Tropsch synthesis, and
cellulosic ethanol from non-food feedstocks.
These pathways improve lifecycle emissions performance and expand feedstock flexibility, but they are also more capital-intensive and complex. As a result, their growth depends heavily on sustained policy support and infrastructure investment.
Policy Will Remain the Key Scaling Driver
Across all scenarios, one conclusion is consistent: biofuels remain policy-dependent.
Unlike fossil fuels, they do not scale purely through market pricing. Instead, growth is driven by a mix of:
A clear shift is also underway from volume-based mandates to carbon-performance frameworks, where fuels are evaluated based on lifecycle emissions rather than renewable content alone.
This transition strongly favors advanced and waste-based fuels while placing increasing pressure on higher-emission first-generation pathways.
12. Conclusion: The Strategic Role of Biofuels in Net Zero Pathways
Biofuels play a targeted but important role in the global energy transition. They are not a full replacement for fossil fuels, but a sector-specific solution for hard-to-electrify areas such as aviation, shipping, and heavy-duty transport.
Their main advantage is compatibility with existing fuel infrastructure, allowing emissions reductions without major system replacement. However, growth is limited by feedstock availability, land-use pressures, and variable lifecycle emissions.
Future expansion is shifting from crop-based fuels toward advanced and waste-based options like sustainable aviation fuel and renewable diesel. Policy is also evolving from volume mandates to carbon-intensity standards. Overall, biofuels will remain a bridging technology within a broader low-carbon energy system.
https://globalcarbonfund.com/wp-content/uploads/2018/10/GCF_header_logo_340x156.png00carbonfundhttps://globalcarbonfund.com/wp-content/uploads/2018/10/GCF_header_logo_340x156.pngcarbonfund2026-07-20 15:14:322026-07-20 15:14:32The Ultimate Guide to Biofuels: A Complete Overview of Sustainable Fuel Alternatives