Canada Invests C$97M to Supercharge EV Charging and Cut Transport Emissions

Canada Invests C$97M to Supercharge EV Charging and Cut Transport Emissions

Canada’s federal government has announced C$97.3 million (almost US$72 million) in new funding for clean transportation projects across the country. It was announced by Natural Resources Canada and other federal departments. The money will support 155 projects in provinces and territories nationwide.

The investment aims to expand electric vehicle (EV) charging, help freight fleets reduce emissions, and increase public awareness of clean transportation.

The Honourable Julie Dabrusin, Minister of Environment and Climate Change and Nature, stated,

“We are making it easier, cleaner, and more affordable for Canadians to get where they need to go by investing in new EV charging infrastructure… Making the switch to an electric vehicle reduces greenhouse gas emissions, and with the EV Affordability Program, drivers can save up to $5000, making EVs more accessible for Canadians to go electric.”

Transportation is Canada’s largest source of greenhouse gas emissions. According to Environment and Climate Change Canada, transport accounted for about 22–25% of national emissions in 2023, totaling almost 157 million tonnes of CO₂ equivalent. Passenger vehicles and freight trucks make up most of these emissions.
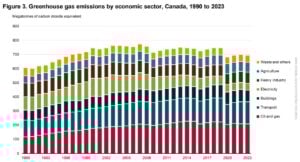
canada GHG emisssions by sector
Source: Government of Canada, ECCC

Reducing transport emissions is key to Canada’s goal of reaching net-zero emissions by 2050.

Charging Ahead: Billions Flow Into EV Infrastructure

The biggest part of the C$97.3 million package, C$84.4 million, will support EV charging infrastructure. This funding comes from Canada’s Zero Emission Vehicle Infrastructure Program (ZEVIP). It will support 122 projects that will install more than 8,000 new EV chargers across the country.

Canada already has more than 30,000 public charging ports installed, according to Natural Resources Canada. The new chargers will expand coverage in cities, rural areas, highways, workplaces, and multi-unit residential buildings.

Some major recipients include:

  • Pollution Probe Foundation: C$7.3 million for 495 chargers.
  • Manitoba Motor Dealers Association: C$6.5 million for up to 520 chargers.
  • DP World Canada: C$4.375 million for 111 chargers.
  • Purolator Inc.: C$2.575 million for 393 chargers.

Municipalities such as Calgary, Vancouver, Regina, Kelowna, Mississauga, and St. John’s are also receiving funding.

The federal government has set a target for 100% of new light-duty vehicle sales to be zero-emission by 2035. Expanding charging infrastructure supports this goal and helps reduce range concerns for drivers.

Greening the Freight Network

The announcement also includes C$5.7 million for three projects under the Green Freight Program. Medium- and heavy-duty trucks play a major role in freight transport. These vehicles consume large amounts of diesel fuel and produce significant emissions.

The Green Freight funding will help fleets with the following:

  • Upgrade engines and vehicles,
  • Improve fuel efficiency,
  • Adopt low-carbon technologies, and
  • Improve logistics planning.

Freight trucks represent about 37% of Canada’s transportation emissions, according to federal data. Cutting fuel use in this segment can reduce both operating costs and carbon output.

These projects aim to improve fleet performance while supporting Canada’s broader climate targets.

Education and Indigenous-led Initiatives in the EV Shift

The remaining C$7.2 million will support 30 education and awareness projects across Canada. These initiatives will provide information about EV adoption, charging technology, and clean fuels. They will also help train workers in EV infrastructure installation and maintenance.

Of the 30 projects, 11 are Indigenous-led. These projects focus on increasing awareness and access to clean transportation in Indigenous communities and northern regions.

Activities in this program include:

  • Community test-drive events
  • Skills training workshops
  • Public outreach on clean fuel options

The advocates believe that education helps build confidence in electric mobility and supports long-term adoption.

Part of a Bigger National Electrification Push

The C$97.3 million funding is part of Canada’s broader Automotive Strategy and National Charging Infrastructure Strategy, announced in early 2026.

In addition to this funding, the Canada Infrastructure Bank (CIB) increased its charging and hydrogen refueling program by C$1 billion. This brings the total funding in that initiative to C$1.5 billion. The CIB program aims to support up to 5,400 new public fast-charging stations across the country.

The government also continues to provide purchase incentives for zero-emission vehicles. Federal rebates of up to C$5,000 are available for eligible EV buyers under existing programs.

Together, these measures aim to reduce emissions while strengthening Canada’s auto sector and supply chains. More so, the sector’s GHG emissions keep rising again post-COVID 19 pandemic.

Supporting Canada’s Net-Zero and 2035 ZEV Targets

This funding supports Canada’s national climate targets. The federal government plans to cut emissions by 40–45% from 2005 levels by 2030. It also aims for net-zero emissions by 2050.

Canada net zero goals 2030 target
Source: Canadian Government

This commitment is part of the Canadian Net-Zero Emissions Accountability Act. Transportation is the biggest source of emissions in the country, and so cutting vehicle emissions is key to reaching these goals.

Canada has set rules for new light-duty vehicles. By 2035, all sales must be zero-emission. There are interim goals of 20% by 2026 and 60% by 2030. Expanding EV charging helps meet those sales targets by making electric vehicles more practical for drivers across urban and rural areas.

Also, the federal government has set national infrastructure targets of deploying 84,500 EV chargers and 45 hydrogen refueling stations by 2029. These targets aim to ensure that charging and refueling networks grow in step with rising zero-emission vehicle adoption across the country.

Cleaner freight projects also support Canada’s broader plan to cut emissions from medium- and heavy-duty vehicles. The C$97.3 million funding supports Canada’s long-term move to a lower-carbon transportation system. It combines infrastructure investment, fleet upgrades, and education programs.

Closing the Emissions Gap in Transport

Transportation emissions remain high in Canada. Power plant emissions have fallen in recent years, but transport emissions have been slower to drop.
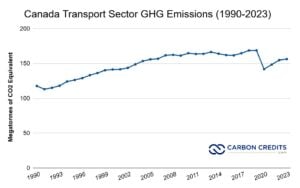
Canada Transport Sector GHG Emissions (1990-2023)
Data Source: Environment and Climate Change Canada (ECCC)

Electric vehicles produce zero tailpipe emissions. Canada’s electricity grid is about 83% non-emitting. So, when powered by it, EVs can greatly reduce carbon output. Heavy-duty vehicle upgrades and freight efficiency improvements also provide measurable reductions.

The new C$97.3 million funding helps close infrastructure gaps and prepares communities for increased EV adoption. It also sends a signal to private investors. Public funding often helps unlock additional private capital in clean energy and infrastructure projects.

Moreover, the installation of 8,000 new chargers will increase national charging coverage. Freight modernization projects will reduce diesel use, while education programs will improve awareness and workforce skills.

These steps support Canada’s commitment to reducing emissions by 40–45% below 2005 levels by 2030, while moving toward net-zero by 2050.

The C$97.3 million investment is one part of a broader national effort. As charging networks grow and fleets modernize, Canada’s transportation sector may gradually lower its carbon footprint. Further policy support, infrastructure development, and private investment will determine the pace of that transition.

The post Canada Invests C$97M to Supercharge EV Charging and Cut Transport Emissions appeared first on Carbon Credits.

Uranium Prices 2026: Supply Crunch and Rising Demand Fuel a Nuclear Bull Market

uranium

Uranium is back in the spotlight. In 2026, uranium prices are climbing to levels not seen in years, fueled by supply constraints, policy support, and rising demand from nuclear power and AI-driven data centers. What was once a quiet energy commodity is now a strategic asset at the heart of the global energy transition.

Sprott Drives Uranium Price Rally with Strategic Accumulation

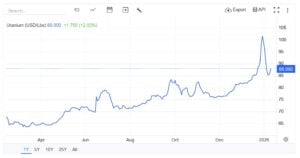
As per media reports, the global uranium market entered 2026 with strong momentum, as spot uranium prices surged by roughly 25% in January, surpassing $100 per pound for the first time in two years. This sharp rise reflects growing confidence in nuclear energy and mounting concerns about long-term supply constraints.

According to Sprott Asset Management, the rally toward 2024 peak levels indicates a stronger supportive backdrop than last year. In 2025, prices were volatile—falling in the early months before rebounding from the low $60s to the high $80s in the second half. Today, fundamentals appear more favorable.

uranium prices
Source: Trading Economics

Jacob White, Sprott’s ETF products director, noted that the January surge signals a shift in investor focus. Capital is moving away from downstream nuclear themes and returning to the upstream uranium supply chain, largely due to clearer policy signals and improving fundamentals.

Moreover, Sprott has been one of the largest buyers of physical uranium, adding around 4 million pounds to its uranium fund this year and bringing total holdings to nearly 79 million pounds. This accumulation highlights how investors increasingly view uranium as a strategic, long-term asset rather than a cyclical commodity.

Financial Buyers Are Redefining the Market

Institutional investors are transforming uranium into a financial asset class. Funds that accumulate physical uranium create additional demand beyond traditional utilities, removing supply from the spot market and amplifying price volatility.

Unlike utilities, financial buyers are less sensitive to short-term price swings. Their participation reduces downside risk and strengthens the long-term bull market thesis.

Strong Policy Support Is Driving Uranium Prices

Government policy is playing an increasingly influential role in shaping uranium prices in 2026. The U.S. government’s Section 232 framework on critical minerals explicitly designates uranium as vital for energy security and national defense, placing it alongside rare earths and lithium as a strategic resource.

At the same time, the U.S. Department of Energy (DOE) committed $2.7 billion over the next decade to expand domestic uranium enrichment. The investment aims to reduce reliance on foreign suppliers while supporting the next phase of nuclear power growth.

AI and Data Centers Boost Uranium Demand

This policy shift reflects a broader change in perception. Nuclear is now viewed as essential for meeting rising electricity demand, powering AI infrastructure, ensuring industrial resilience, and achieving long-term climate goals.

As tech companies increasingly recognize nuclear as a strategic power source, they create a new, enduring layer of uranium demand. Analysts project that the uranium market could expand to $60.5 billion by 2030, with AI-driven demand accelerating this growth.

Enrichment Bottlenecks Highlight Structural Weaknesses

Despite policy support, uranium enrichment remains a major bottleneck. Most reactors operate on low-enriched uranium (LEU), while advanced reactors—including small modular reactors (SMRs)—require high-assay low-enriched uranium (HALEU).

Currently, the U.S. produces less than 1% of global enrichment capacity and relies heavily on foreign suppliers. New restrictions on Russian uranium imports starting in 2028 further emphasize energy security risks.

Although the DOE’s investment aims to rebuild domestic enrichment capacity, new facilities will take years to become operational. Consequently, near-term enrichment constraints will continue to support higher uranium prices.

Mining Remains the Weakest Link

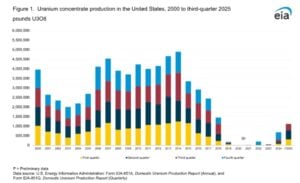
While enrichment is a challenge, upstream mining remains the weakest link in the nuclear fuel cycle. The U.S. Energy Information Administration reported that domestic uranium concentrate production fell 44% in Q3 2025, to about 329,623 pounds of U₃O₈, from only six operating facilities, mainly in Wyoming and Texas.

uranium demand us

This decline highlights a systemic problem. The nuclear fuel cycle requires coordinated growth across mining, processing, enrichment, and fuel fabrication. Advancements in one segment without corresponding growth in the others create structural bottlenecks.

In the short term, declining production adds bullish pressure. Over the long term, decades of underinvestment in mining point to a persistent supply deficit, which could keep prices elevated.

Uranium Supply and Demand Outlook

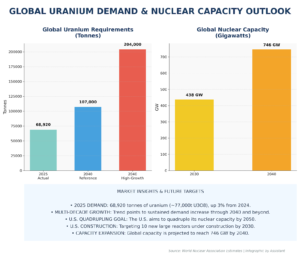
Global demand for reactor fuel continued to grow in 2025. The World Nuclear Association estimates uranium requirements at about 68,920 tonnes, or roughly 77,000 tonnes of uranium oxide, up 3% from 2024.

Looking ahead, demand is expected to rise sharply. Under the reference scenario, global uranium needs could reach 107,000 tonnes by 2040, and under a higher-growth scenario, up to 204,000 tonnes.

This growth aligns with increasing nuclear capacity, which is projected to climb to 438 gigawatts by 2030, and nearly 746 gigawatts by 2040. The trend points to a long-term, multi-decade increase in uranium demand.

Uranium demand and supply
Data Source: WNA

The U.S. also plans to quadruple nuclear capacity by 2050 and have 10 new large reactors under construction by 2030. If achieved, this expansion would dramatically increase uranium demand.

The timing mismatch between rising demand and the slow pace of mine development creates a structural imbalance between supply and demand. Analysts also speculate that the U.S. government could take equity stakes in uranium miners in exchange for long-term offtake agreements with price floors. This move would further tighten supply and support higher prices.

Kazatomprom’s 2026 Outlook Signals Tight Margins

Recent reports tell that Kazatomprom plans to raise uranium output by about 9% in 2026, targeting 71.5–75.4 million pounds of U₃O₈, slightly below state caps but above analyst forecasts.

However, new ISR projects and brownfield expansions take time, so near-term supply remains constrained, keeping upward pressure on prices.

2026: Why the Uranium Bull Market Could Continue

Given these dynamics, uranium prices could continue trending higher throughout 2026. Government investment, supply bottlenecks, and AI-driven demand are reshaping uranium’s role in the global energy mix. Prices could approach $92 per pound or more, particularly if contracting accelerates or financial buyers continue stockpiling physical uranium.

Uranium is evolving from a traditional commodity into a strategic pillar of the global energy transition. Policy support, structural supply constraints, institutional demand, and AI-driven electricity requirements are creating a compelling long-term bull case.

For investors and utilities alike, the uranium market is signaling that big moves—and big opportunities—are on the horizon.

The post Uranium Prices 2026: Supply Crunch and Rising Demand Fuel a Nuclear Bull Market appeared first on Carbon Credits.

China Expands Carbon Reporting to Airlines and Heavy Industry in Major Climate Disclosure Shift

China Expands Carbon Reporting to Airlines and Heavy Industry in Major Climate Disclosure Shift

China has updated and expanded its carbon reporting rules to cover new sectors. The changes are part of the country’s effort to improve transparency on climate risks and emissions.

Officials have extended carbon reporting requirements to include the airline industry and major industrial sectors such as petrochemicals and copper producers. This is a major shift in how companies disclose climate data and manage emissions.

China also introduced a new national climate reporting standard in late 2025. This standard aims to align with global best practices and to make climate data clearer and more useful to investors and regulators.

The changes reflect China’s strategy to meet its climate targets and to build stronger systems for environmental data. They also show how the Chinese reporting regime is becoming more structured and consistent.

Inside China’s New Climate Disclosure Rulebook

In December 2025, China’s Ministry of Finance and eight other ministries issued the Corporate Sustainable Disclosure Standard No. 1 – Climate (Trial). This is a national framework for climate disclosures.

The standard is based on the International Sustainability Standards Board (ISSB) IFRS S2 Climate-related Disclosures. It focuses on reporting climate risks, opportunities, and impacts.

Under the new framework, companies are expected to report on their governance, strategy, risk and opportunity management, and metrics and targets.

The Chinese framework also requires more extensive emissions data, including value chain emissions in many cases. This goes beyond basic climate risk reporting.

Currently, the Chinese authorities present the standard as a trial (voluntary phase). However, they plan to expand its use and make parts mandatory over time. They will start with large companies and key sectors.

High-Emission Sectors Now Under the Spotlight

The newly announced carbon reporting expansion will affect energy-intensive and high-impact sectors, not only traditional industries:

  • Airlines: This includes carriers operating domestic and international flights.
  • Petrochemical firms: Companies that refine oil and produce chemical products.
  • Copper producers: Firms involved in mining and processing copper.

These sectors consume large amounts of energy and generate significant greenhouse gas emissions.

The aviation sector accounts for about 2% of global energy-related CO₂ emissions, according to the International Energy Agency (IEA). In 2023, aviation emissions reached roughly 950 million tonnes of CO₂, returning close to pre-pandemic levels. China is one of the world’s largest aviation markets, and fuel combustion remains the dominant source of airline emissions.

The petrochemical industry is also highly carbon-intensive. The IEA reports that petrochemicals account for about 14% of global oil demand and 8% of global gas demand. China is the world’s largest producer and consumer of many petrochemical products, making emissions monitoring in this sector especially important.

Copper production is another energy-heavy industry. The International Copper Association states that producing refined copper needs 2 to 4 tonnes of CO₂ for each tonne of copper. This varies by ore grade and energy source.

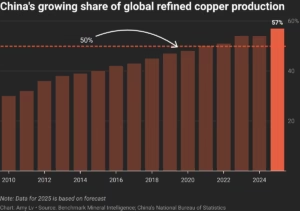
China produces over 40% of the world’s refined copper, says the International Energy Agency and global metals stats. Smelting and refining processes consume large amounts of electricity, often generated from fossil fuels.

china copper 2025 production
Chart from Reuters

From Patchwork Rules to a National Framework

The new reporting requirements and standards are part of a wider shift in China’s climate disclosure regime. The country has been building a national corporate climate reporting framework since 2024. This includes guidance from stock exchanges, government agencies, and new national standards.

In January 2026, the national climate reporting standard was formally released. It follows the IFRS S2 climate disclosure framework, but it adds China-specific details. One key requirement is to report the actual business impact on the climate.

Authorities say they’re working on guidelines for industries with high emissions. These include power, steel, coal, petroleum, fertilizer, aluminum, hydrogen, cement, and automobiles, among others.

The current trial phase mainly targets listed companies. But it plans to expand to non-listed firms and small and medium-sized enterprises (SMEs) later on.

China aims to make its climate disclosure regime more comprehensive and quantitative. Companies are expected to shift from narrative statements to detailed data reporting as they develop their climate information systems.

Driving Data to Deliver on Dual-Carbon Goals

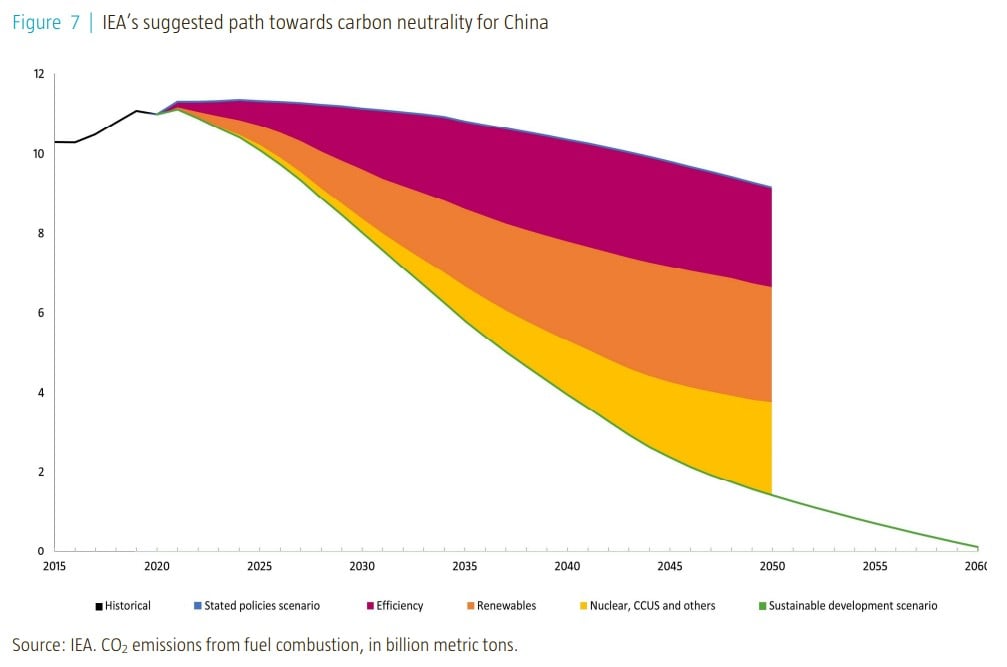
As the world’s largest greenhouse gas emitter, China aims to have its National Emissions Trading System (ETS? cover all major emitting industries by 2027 to help achieve its “dual-carbon” goals:

IEA’s suggested path towards carbon neutrality for China

Achieving these goals requires accurate, timely, and comparable emissions data from companies. Improved reporting helps regulators, investors, and the public understand corporate climate risks and progress.

Standardized disclosure can help cut down on greenwashing. This happens when companies overstate or misrepresent their climate performance. Clear rules make it harder to present incomplete or misleading data.

Those who fail to comply will face consequences. For instance, a power plant in Ningxia was recently fined 424 million yuan ($58.5 million) for missing compliance deadlines.

Better climate data also supports green finance. Investors use emissions and climate information to assess risks and make decisions about capital allocation. Reliable data can help direct funding toward low-carbon technologies and projects.

The expanded rules also fit within China’s broader strategy to build a national carbon market and improve its emissions trading system. This market already covers a growing share of the economy and underpins carbon pricing across industries.

The move also responds to global pressures. For example, the European Union’s carbon taxes on imports impact Chinese exporters in these sectors.

China’s ETS and the Use of Carbon Offsets

This data collection phase is a precursor to integrating the industries into China’s ETS. The system initially covers only the power sector, but it has added steel, aluminum, and cement.

The covered companies can use a limited number of carbon offsets to meet compliance requirements. Under the ETS design, entities can use China Certified Emissions Reductions (CCERs). These must come from projects not included in the national ETS. But companies can surrender CCERs for up to 5% of their verified emissions.

Also, only CCER credits from projects in the new national CCER program can be used after January 2025. This offset flexibility gives companies an option to meet part of their compliance obligations while broader reporting and reduction measures take effect.

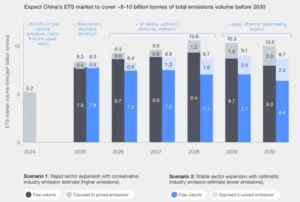
China ETS market 2030
Source: WEF Asia’s Carbon Markets Strategic Imperatives for Corporations, 2025.

The system currently regulates more than 5 billion tonnes of CO₂ annually from the power industry alone. Analysts estimate that once the additional sectors are fully included, the ETS could cover between 8.7 and 10.6 billion tonnes of CO₂ by the late 2020s — representing a significant share of China’s total emissions.

A Transparency Push With Global Implications

China’s expanded reporting rules represent a clear shift toward greater transparency in corporate climate data. Better reporting helps policymakers track progress toward national climate goals. It also helps businesses understand their own climate risks and opportunities.

For investors, richer data support more informed decisions about sustainable investments. This can help channel capital to cleaner technologies and low-carbon business models.

For the global climate community, China’s moves may influence reporting norms in other markets. As the world’s largest emitter, China’s reporting regime could shape climate disclosure expectations elsewhere.

The post China Expands Carbon Reporting to Airlines and Heavy Industry in Major Climate Disclosure Shift appeared first on Carbon Credits.

How Power Demand, Emissions, and China Will Shape the Global Energy System to 2030

Global electricity demand is entering a decisive growth phase. IEA’s 2026 electricity report forecasts that over the next five years, power consumption is set to rise faster than at any time in recent decades, marking a structural shift in how the world uses energy. This trend reflects the rapid electrification of industries, transport, buildings, and digital infrastructure, alongside climate-driven demand for cooling and heating.

Unlike previous cycles, electricity demand is no longer simply following economic growth. Instead, power consumption is becoming a leading driver of economic activity. This shift signals the arrival of what analysts increasingly call the “Age of Electricity,” where power is the backbone of modern economies and decarbonization strategies.

Let’s deep dive into IEA’s report here to understand the present and the future of electricity demand.

Electricity Demand Breaks Away from Economic Growth

Global electricity demand is projected to grow at an average annual rate of around 3.6% between 2026 and 2030, significantly faster than the growth seen over the past decade. In contrast, total energy demand will rise much more slowly, meaning electricity will expand at least 2.5 times faster than overall energy consumption.

This divergence marks a fundamental change. Historically, electricity consumption closely tracked GDP growth. That relationship is now reversing. In 2024, electricity demand outpaced economic growth globally for the first time in three decades outside of crisis periods, and this trend is expected to continue.

Several structural drivers are accelerating this shift:

  • Electrification of transport, especially electric vehicles
  • Expansion of data centres and artificial intelligence workloads
  • Rising demand for air conditioning due to climate change
  • Industrial electrification and reshoring
  • Growth in heat pumps and electric heating

Together, these trends are pushing electricity to become the dominant form of final energy consumption.

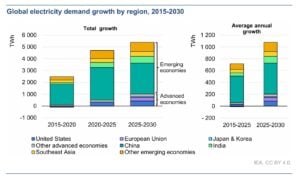
Emerging economies will remain the main engine of demand growth, accounting for roughly 80% of new electricity consumption through 2030. However, advanced economies are also seeing a resurgence after more than a decade of stagnation, driven by digitalization and electrification.

GLOBAL electricity demand

Global Power Mix: Renewables and Nuclear Take Half the Market

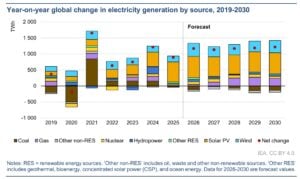
Globally, renewables and nuclear are on track to supply around 50% of electricity generation by 2030. Solar is the fastest-growing source, contributing more than half of annual generation additions.

Renewable generation is expected to grow by about 1,000 TWh per year through 2030, with solar alone adding more than 600 TWh annually. Nuclear power is also gaining momentum, supported by reactor restarts, lifetime extensions, and new builds in emerging economies.

However, coal will likely remain the single largest source of electricity in 2030, even as its share declines. Natural gas generation is also expected to rise, driven by US demand and fuel switching in the Middle East.

Overall, renewables, nuclear, and gas are projected to meet all net new electricity demand globally, displacing coal in aggregate but not eliminating it.

global electricity generation

Advanced Economies Re-Enter the Demand Growth Cycle

Electricity demand in advanced economies is rising again after a prolonged period of stagnation. In the United States, demand is projected to grow by around 2% annually through 2030, with data centres accounting for roughly half of the increase.

In the European Union, electricity demand is expected to grow at around 2% per year, though consumption may not return to pre-2021 levels until the late 2020s. Other advanced economies, including Japan, Canada, Korea, and Australia, are also seeing accelerating growth.

This resurgence reflects:

  • AI and cloud computing expansion
  • Electrification of heating and transport
  • Industrial reshoring and new manufacturing facilities
  • Climate-driven cooling demand

Electricity is becoming a core input for economic competitiveness in digital and industrial sectors.

Power Sector Emissions: Plateau but Not Yet Declining Fast Enough

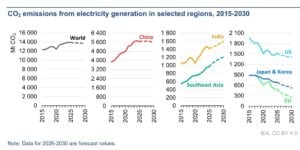
Electricity generation remains the largest source of energy-related carbon dioxide emissions, producing roughly 13.9 billion tonnes of CO₂ per year. After rising between 2022 and 2024, power sector emissions stabilised in 2025.

Looking ahead, emissions are expected to plateau through 2030, rather than decline sharply. This reflects the rapid growth in electricity demand, offsetting gains from clean power deployment.

power sector emissions

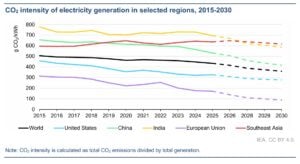
The carbon intensity of electricity has already fallen by around 14% over the past decade, and it is expected to decline faster as low-emission generation expands. This decline is mainly due to more renewable energy and strong nuclear power output.

  • The trend is expected to accelerate. CO₂ intensity is forecast to fall by around 3.7% per year, dropping from 435 g CO₂ per kWh in 2025 to about 360 g CO₂ per kWh by 2030.

However, absolute emissions reductions will be harder to achieve due to rising demand. China’s trajectory is particularly critical. As the world’s largest power market and emitter,  its pace of renewable deployment, coal retirement, and grid reform will heavily influence global climate outcomes.

power sector emissions
Source: IEA

China: The Single Largest Driver of Global Electricity Growth

China will remain the central force shaping global electricity demand over the next decade. Despite slower economic growth and structural shifts toward services, China’s sheer scale means it will contribute close to half of global electricity demand growth through 2030.

Electricity demand in China rose by just over 5% in 2025, down from roughly 7% in 2024. Looking ahead, demand is expected to grow at an average of around 4.9% annually between 2026 and 2030, slower than the past decade but still massive in absolute terms.

The drivers are multifaceted:

  • Continued electrification across industry and households
  • Expansion of manufacturing, including clean energy supply chains
  • Growing services sector electricity use
  • Rising cooling demand due to extreme heat events
  • Digital infrastructure and smart technologies
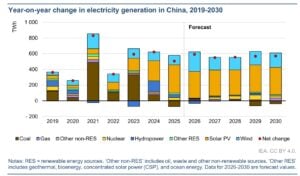
china renewables
Source: IEA

China’s power demand growth over the next five years alone is expected to match the current total electricity consumption of the European Union. This highlights the scale of China’s influence on global power markets, fuel demand, and emissions trajectories.

At the same time, efficiency improvements are tempering demand growth. Government policies targeting lower energy intensity and more efficient appliances are helping reduce electricity use per unit of GDP. However, these gains are not enough to offset the scale of electrification and economic activity.

MUST READ: 

Renewables Surge, But Grid Constraints Loom Large

China’s renewable energy buildout continues at an unprecedented pace. Solar generation jumped by more than 40% in 2025, while wind grew by double digits. The share of variable renewable energy (VRE) in China’s power mix reached around 22%, up sharply from the previous year.

Record capacity additions are transforming the power system. More than 300 GW of solar and over 100 GW of wind were added in a single year, driven partly by developers rushing to complete projects before the end of fixed-price tariffs.

However, this rapid expansion is creating new challenges. Curtailment rates for solar and wind increased, reflecting grid congestion and integration constraints. This highlights a global issue: generation is growing faster than grid infrastructure.

Coal’s Role Is Changing, Not Disappearing

Despite the renewable boom, coal remains a dominant force in China’s power sector. Coal-fired generation declined slightly in 2025, but coal still accounts for the largest share of electricity generation.

China’s coal share is expected to fall from around 55% in 2025 to about 43% by 2030, reflecting the rapid expansion of renewables and nuclear. However, coal capacity continues to grow, driven by projects approved during the 2022–2023 permitting boom.

Rather than serving as baseload power, coal plants are increasingly being used as flexibility and backup resources to support variable renewables. Capacity utilisation is expected to decline, even as installed capacity rises.

This shift illustrates a broader global trend: coal is becoming a reliability asset rather than a growth engine, but its persistence complicates decarbonization efforts.

Grids and Flexibility: The Hidden Bottleneck

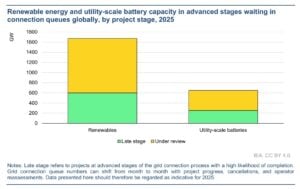
The transition to an electricity-centric energy system depends on grid expansion and flexibility. Investment in grids currently lags far behind generation capacity additions. Worldwide, more than 2,500 GW of projects are stuck in grid connection queues, including renewables, storage, and large industrial loads such as data centres. Without faster grid expansion and smarter system management, power shortages and curtailment risks will rise.

Meeting projected demand will require around 50% higher annual grid investment by 2030, rising from roughly USD 400 billion today. Without this, congestion, curtailment, and reliability risks will increase.

Flexibility solutions are also scaling rapidly. Utility-scale battery deployment is accelerating, especially in regions with high solar and wind penetration. However, conventional power plants still provide most flexibility today.

Policy reforms, grid-enhancing technologies, and non-firm connection agreements could unlock 1,200–1,600 GW of stalled projects, significantly accelerating the transition.

grid management

The Global Outlook: A Power-Centric Energy System

The global energy system is undergoing a structural transformation. Electricity is becoming the dominant vector for economic growth, digitalization, and decarbonization. Demand growth is accelerating across emerging and advanced economies, with China playing the most decisive role.

Renewables and nuclear are rapidly expanding, but coal and gas will remain part of the mix for reliability. Emissions are stabilising but not falling fast enough to meet climate targets, highlighting the scale of the challenge ahead.

The next five years will be critical. Grid expansion, flexibility solutions, and policy reforms will determine whether the Age of Electricity delivers a clean, affordable, and resilient energy future—or locks in new infrastructure bottlenecks and emissions risks.

The post How Power Demand, Emissions, and China Will Shape the Global Energy System to 2030 appeared first on Carbon Credits.

Climate Reality Check: Only 12% of Global Companies Align With 1.5°C Goal, MSCI Reports

Climate Reality Check: Only 12% of Global Companies Align With 1.5°C Goal, MSCI Reports

A new report from MSCI shows that many listed companies are still not aligned with the world’s most ambitious climate goal. The findings suggest that progress is uneven. Some companies are moving in the right direction. Many are not yet cutting emissions fast enough.

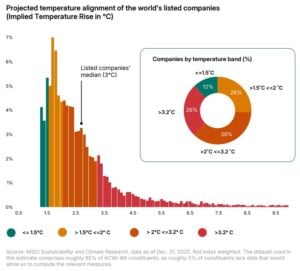
According to MSCI’s latest Transition Finance Tracker, about 38% of companies in the MSCI All Country World Investable Market Index (ACWI IMI) have emissions trajectories that are aligned with limiting global warming to 2°C or below. This includes 12% aligned with 1.5°C or less and 26% aligned between 1.5°C and 2°C.

However, only about 12% of companies are aligned with the stricter 1.5°C goal set under the Paris Agreement. The remaining companies are on pathways that imply warming above 2°C.

In fact, 36% of companies fall in the range above 2°C but below 3.2°C, while 26% exceed 3.2°C. Overall, the median listed company trajectory implies 3°C (5.4°F) of warming above preindustrial levels this century.

Projected temperature alignment of the world’s listed companies
Source: MSCI

MSCI uses a tool called the Implied Temperature Rise (ITR) metric. This tool estimates how much global temperatures would rise if the whole economy followed the same emissions pathway as a given company. It looks at aggregate emissions, sector-specific carbon budgets, and corporate climate targets.

Inside the ITR: Measuring Corporate Warming Impact

MSCI’s ITR metric helps investors understand climate risk. It compares a company’s projected emissions with global carbon budgets that align with temperature goals. The dataset used in this estimate covers roughly 95% of ACWI IMI constituents, as about 5% lack sufficient data for the calculation.

If a company’s emissions plan fits within a 1.5°C carbon budget, it is considered aligned with the most ambitious Paris goal. If it fits within a 2°C budget, it is considered moderately aligned. If not, it implies higher warming.

  • The Paris Agreement aims to limit global warming to well below 2°C, and preferably to 1.5°C, compared with pre-industrial levels.

The Intergovernmental Panel on Climate Change (IPCC) has warned that global emissions must fall by about 43% by 2030, compared with 2019 levels, to keep 1.5°C within reach.

MSCI’s data shows that most companies are not reducing emissions at that pace. The report also notes that its latest warming estimate is three-tenths of a degree higher than the previous quarter due to a methodological update that removed a cap on how much companies could exceed their carbon budgets.

This gap matters because corporate emissions play a major role in global totals. The MSCI ACWI IMI includes 8,225 companies and captures about 99% of the global equity investment opportunity set as of Dec. 31, 2025.

Winners and Laggards: How Sectors Stack Up on Climate

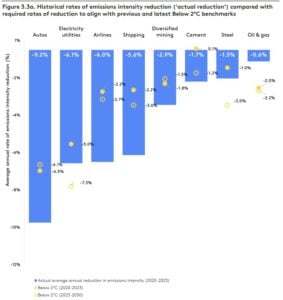
The Transition Pathway Initiative (TPI) gives a clear look at how corporate climate performance differs by industry.

The TPI report looked at more than 2,000 major companies. These companies have a total market value of about US$87 trillion. The focus was on their climate governance and progress on emissions. It found that 98% of companies lack credible plans to shift capital away from carbon-intensive assets.

corporate climate by sector TPI
Source: TPI

The report warns that 554 companies in 12 high-emitting sectors are on a dangerous path. Their current emissions are on track to overshoot the 1.5°C carbon budget by 61% between 2020 and 2050. These same pathways will also likely exceed the 2°C budget by 13% during that same period.

The analysis suggests that many firms consider climate issues in daily decisions. However, few have solid long-term transition plans.

TPI also shows clear differences in sector progress. For example, automotive and electricity companies reduced emissions intensity nearly five times faster between 2020 and 2023 than cement and steel firms. Conversely, sectors such as oil & gas, aluminum, and coal mining remain among the most misaligned with Paris goals.

This highlights that while some industries are beginning to cut emissions and improve governance, most still need stronger transition plans and clearer capital alignment to meet global climate targets.

Climate Alignment Is Now a Financial Risk Indicator

Findings reveal that climate alignment is not only an environmental issue. It is also a financial one.

Governments are tightening climate policies. Carbon pricing systems now cover about 23% of global greenhouse gas emissions, according to the World Bank’s State and Trends of Carbon Pricing report.

More countries are setting net-zero targets. Regulations are increasing disclosure requirements. Investors face growing pressure to measure climate risk in portfolios.

The MSCI report also shows that 19% of listed companies had a climate target validated by the Science Based Targets initiative (SBTi) as of Dec. 31, 2025, up from 14% a year earlier. Meanwhile, 32% of companies have set a companywide net-zero target, and 60% have published some form of climate commitment.

Companies that are not aligned with global climate goals may face higher regulatory costs, stranded assets, or weaker demand in the future. On the other hand, companies aligned with 1.5°C or 2°C pathways may benefit from new markets and lower transition risk.

MSCI’s data helps investors compare companies on this basis. The 38% alignment figure gives a broad snapshot of progress across global markets.

Progress, But Not Fast Enough

The fact that 38% of companies align with 2°C or below shows improvement compared with past years. Corporate climate reporting has expanded. More companies now set net-zero targets, and many publish science-based targets.

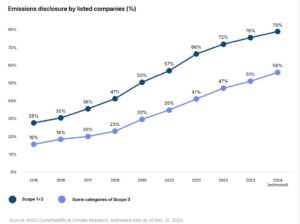
Disclosure rates have also improved. As of Dec. 31, 2024, 79% of listed companies disclosed Scope 1 and/or Scope 2 emissions, up from 76% a year earlier. A majority, 56%, reported at least some Scope 3 emissions, up from 51%.

Emissions disclosure by listed companies
Source: MSCI

Still, MSCI’s findings show that ambition and action are not always the same. Some companies set long-term targets but delay near-term reductions. Others rely heavily on carbon offsets instead of direct emissions cuts. In some cases, emissions intensity improves while absolute emissions remain high.

The IPCC has made clear that global emissions must fall sharply this decade. Delayed action increases future costs and transition risks.

A Fossil-Fuel-Heavy World Complicates the Shift

Global energy-related CO₂ emissions reached a record 37.8 billion tonnes in 2023, according to the International Energy Agency. While renewable energy growth has accelerated, fossil fuels still account for around 80% of global primary energy supply.

These global figures explain why corporate alignment remains challenging. Many companies operate in economies that still depend on fossil energy.

MSCI’s report reflects this broader reality. Corporate alignment depends on system-wide change, not just company-level pledges. Moreover, the report’s findings come as corporate climate pledges continue to rise sharply.

According to the SBTi, the number of companies setting both near-term and net-zero science-based targets surged 227% between late 2023 and mid-2025. Companies setting near-term targets alone grew by nearly 97% over the same period.

Companies with SBTi commitments or targets
Source: SBTi

By the end of 2023, only 17% of companies with validated targets had both near-term and net-zero commitments. That share rose to 33% in 2024 and reached 38% by mid-2025.

The figures show that more companies are formalizing climate commitments. However, MSCI’s data indicates that only 12% of listed firms align with 1.5°C, while 38% align with 2°C or below — highlighting a gap between target-setting and full emissions alignment.

The Road Ahead: Bridging the 1.5°C Gap

The headline figure shows that more than one-third of listed firms are moving in a direction consistent with global climate goals. That gap is significant.

To meet the Paris Agreement’s goals, alignment will need to increase quickly across all sectors. This means faster emissions cuts, clearer short-term targets, and stronger capital allocation toward low-carbon technologies. Today’s alignment rate suggests progress is underway, but it also shows that most companies still have to work harder to be on track to a 1.5°C path.

The post Climate Reality Check: Only 12% of Global Companies Align With 1.5°C Goal, MSCI Reports appeared first on Carbon Credits.

Nuclear’s Next Chapter: newcleo Raises $88M to Scale SMR Powered by Nuclear Waste

Nuclear’s Next Chapter: newcleo Raises $88M to Scale SMR Powered by Nuclear Waste

newcleo, a European nuclear technology company, announced that it has raised €75 million (about USD $88 million) in a new funding round. The cash will help the company build and develop advanced small nuclear reactors powered by recycled nuclear waste. The financing is a sign of growing investor interest in clean and low-carbon energy solutions.

Newcleo also said that it has now raised more than $124 million in total for 2025. The company was founded in September 2021 and is based in Paris, France. The nuclear energy developer also operates in Italy, the UK, Belgium, and Slovakia, with roughly 1,000 employees.

What newcleo’s Technology Does: Turning Nuclear Waste into Usable Fuel

newcleo develops a type of advanced nuclear technology known as lead-cooled fast reactors (LFRs). These reactors are a form of small modular reactor (SMR).

Unlike traditional nuclear reactors that use fresh uranium fuel, newcleo’s design aims to use reprocessed nuclear waste as fuel. This means existing waste from older reactors could become a power source.

Using nuclear waste as fuel is intended to have two benefits:

  • It could reduce long-term waste storage needs.
  • It may help lower the carbon footprint of nuclear power.

Lead-cooled fast reactors also use liquid lead to transfer heat out of the core. The liquid lead acts as a coolant and enables the reactor to operate at high temperatures without high pressure.

This reactor type is still under development and not yet in wide commercial operation. But companies like newcleo believe it could play a role in future clean energy systems.

Heavy Industry and Investors Double Down

The €75 million funding round brought in both new and existing investors. New industrial backers included heavy industry groups such as:

  • Danieli & C, a steel mill manufacturer
  • Cementir Holding, a cement and concrete producer
  • Orion Valves, an industrial valve maker
  • NextChem, an energy engineering firm

Existing financial backers also participated. These included Kairos, Indaco Ventures, Azimut Investments, the CERN pension fund, and Walter Tosto (industrial engineering).

The mix of industrial and financial investors shows that newcleo’s technology draws interest from companies looking for reliable, low-carbon power and firms focused on clean energy investments.

Scaling from Design to Deployment

newcleo said the fresh funding will support several key parts of its business. The company highlighted progress in:

  • Licensing and regulatory approval processes
  • Research and development (R&D) of reactors and fuel systems
  • Vertical integration of technology and manufacturing
  • Geographic expansion in key markets like Europe and the United States

This means newcleo is working not just on reactor design, but on building the skills and facilities needed to support production, testing, and commercial deployment. The company also has partnerships and projects in multiple countries, including France, Italy, Slovakia, and the U.S. These collaborations relate to licensing and siting work, research facilities, and future commercial reactor projects.

Closing the Nuclear Fuel Loop

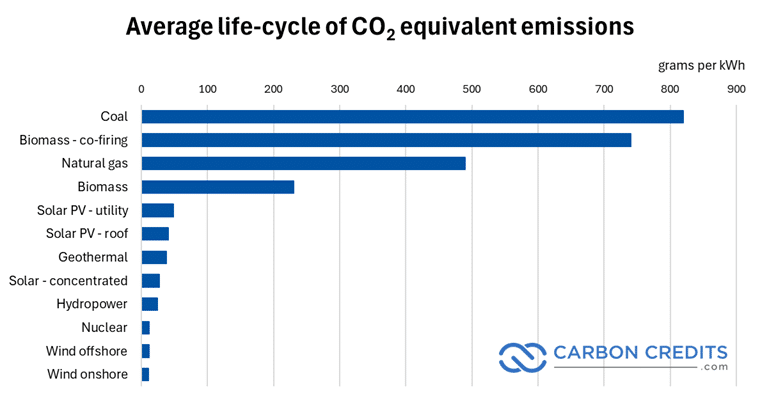
Nuclear power is often seen as a low-carbon energy source because it produces virtually no direct CO₂ emissions during operation. However, it leaves behind radioactive waste that can remain hazardous for thousands of years.

nuclear carbon emission
Carbon Footprint of Various Energy Sources

Traditional reactors use uranium fuel once and store the resulting waste. newcleo’s approach aims to reuse existing waste as reactor fuel. This could potentially reduce the volume and hazard of waste that needs long-term storage.

Lead-cooled fast reactors are one class of Generation IV nuclear technology. These designs are intended to be safer and more efficient than older reactors. They can run on fuels that traditional reactors cannot and may help make nuclear energy more sustainable in the long term.

Using recycled radioactive fuel helps close the nuclear fuel cycle. This means sourcing more energy from mined uranium, which leaves less waste behind.

Building a Cross-Border Nuclear Footprint

newcleo has stated that it plans to roll out its technology in several countries with active regulatory frameworks for advanced nuclear projects. The company has started licensing and planning partnerships in Europe and the U.S. These moves aim to make it a major supplier of advanced nuclear power systems.

In France, newcleo is preparing regulatory filings for both fuel and reactor projects. In Italy, it is building R&D infrastructure and test systems, while in Slovakia, it has formed a joint venture to deploy multiple reactors at a nuclear site. And in the U.S., it is engaging in collaborations to build fuel manufacturing and fabrication capabilities.

The company’s CEO, Stefano Buono, said investors view newcleo’s progress in licensing, R&D, and global expansion as a key advantage. He further added,

“Our ability to deliver impactful low-carbon energy solutions for energy-intensive firms is proving an attractive investment rationale for both industrial and financial investors. Our tangible progress in licensing, R&D, vertical integration, and geographic expansion is seen by investors as a key differentiator in the race to deliver clean, safe, and affordable nuclear energy.”

Small Modular Reactors Gain Global Traction

Interest in small modular reactors is rising as countries look for reliable, low-carbon power. Governments and industry groups also track SMRs more closely than before.

One sign is the growing number of designs in development. The OECD Nuclear Energy Agency (NEA) reported that its latest SMR Dashboard found 98 SMR technologies globally. It detailed 56 of these SMRs in its dashboard set.

A separate NEA summary shows a larger count of designs tracked over editions. This highlights how quickly the pipeline is expanding.

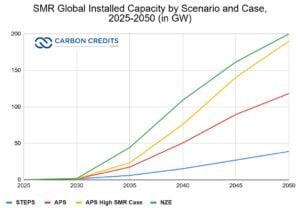
  • Forecasts also show wider deployment in the coming decades. The International Energy Agency (IEA) publishes scenario data on global SMR capacity from 2025 to 2050.

In its analysis, SMR capacity rises from near-zero today to tens of gigawatts by 2050 in its main scenarios (39 GW), and it grows even higher in its “high SMR” case (190 GW). This suggests that SMRs could move from pilot projects to meaningful scale if costs fall and licensing speeds up.

SMR Global Installed Capacity by Scenario and Case, 2025-2050 IEA data
Data from the IEA; STEPS = Stated Policies Scenario; APS = Announced Pledges Scenario; NZE = Net Zero Emissions by 2050 Scenario.

International institutions also expect nuclear growth overall, with SMRs playing a bigger role. In September 2025, the International Atomic Energy Agency (IAEA) said it raised its long-term nuclear outlook again.

In its best-case scenario, the IAEA predicts that global nuclear capacity could grow to 2.6 times the 2024 level by 2050. It also noted that SMRs will be key to this growth.

Policy signals further support this direction. The NEA reports that over 20 countries at COP28 pledged to triple global nuclear energy capacity by 2050.

These forecasts do not guarantee fast deployment. SMRs still face key hurdles such as licensing timelines, supply chains, fuel availability, and first-of-a-kind costs. 

SMRs are increasingly central to global nuclear talks. The NEA tracks more designs, and the IEA outlines new deployment pathways. And interest from investors and policymakers has grown as countries look for reliable low-carbon baseload power.

The €75 million funding round adds to newcleo’s growing capital base. It boosts the company’s ability to advance its technology and work toward deployment. As of early 2026, newcleo has raised more than $124 million over the past year, with total funding since 2021 likely exceeding €645 million.

Private Capital Signals a Nuclear Comeback

The investment in newcleo highlights a broader trend: private capital is moving into advanced nuclear technologies.

Investors in heavy industry and finance are now seeing nuclear power as key to global decarbonization efforts. Some countries have recently updated their policies. This supports nuclear research and licensing. It shows a focus on energy security and climate goals.

Lead-cooled fast reactors and similar designs remain in early stages of testing and regulatory review. Newcleo and similar companies think their technologies can provide clean, reliable power. They also believe these systems create less waste over their life cycles compared to older reactors.

If successful, this approach could expand the role of nuclear power in the energy transition. But much work remains in testing, licensing, manufacturing, and cost reduction before commercial deployment at scale.

The post Nuclear’s Next Chapter: newcleo Raises $88M to Scale SMR Powered by Nuclear Waste appeared first on Carbon Credits.
TotalEnergies and Google’s 1 GW Solar Deal Signals a New Phase in the Data Center Energy Race

TotalEnergies has signed two long-term power purchase agreements (PPAs) with Google to deliver 1 gigawatt (GW) of solar capacity in Texas. Over 15 years, the projects are expected to generate around 28 terawatt-hours (TWh) of renewable electricity.

The deal reflects a deeper shift in how the tech sector secures power for artificial intelligence, cloud services, and digital infrastructure. As AI workloads surge, electricity has become a strategic resource, and companies like Google are moving early to lock in supply.

The projects will be developed at two TotalEnergies-owned sites—Wichita and Mustang Creek—with construction scheduled to begin in the second quarter of 2026. Once operational, they will directly support Google’s growing data center footprint in Texas.

Texas: A Crucial Hub for Big Tech Power Demand

Texas has emerged as one of the world’s most important regions for data center expansion. Its abundant land, strong solar resources, and deregulated power market make it attractive for hyperscale data centers. However, demand is rising rapidly, and the grid is under pressure from AI-driven electricity loads, industrial expansion, and extreme weather events.

texas data centres
Source: AXIOS

The Wichita solar farm, with a capacity of 805 megawatts (MW), and the Mustang Creek project, with 195 MW, together form one of TotalEnergies’ largest U.S. renewable commitments to a single corporate buyer. These projects will add new generation capacity rather than simply reallocating existing renewable energy credits, which is critical for grid stability.

By building new supply, TotalEnergies and Google are addressing a major challenge facing the power sector: ensuring that clean electricity growth keeps pace with surging demand.

Corporate PPAs Are Now Shaping America’s Power Grid

Power purchase agreements were once seen as a financial tool for companies to claim renewable energy use. Today, they are becoming a core driver of grid expansion. Large corporate buyers are effectively acting as anchor investors for new energy infrastructure.

In this case, the 1 GW of solar PPAs complement another 1.2 GW of agreements recently secured by Clearway, a renewables developer half-owned by TotalEnergies. These deals span multiple U.S. grid regions, including ERCOT in Texas, PJM in the Northeast, and SPP in the Central U.S.

Together, these agreements illustrate how tech firms are diversifying their energy supply across regions to manage risk, hedge against price volatility, and ensure reliability.

Local Economic Impact and Community Benefits

Beyond climate goals, large-scale solar projects bring tangible economic benefits to local communities. The Wichita and Mustang Creek developments are expected to create several hundred construction jobs and generate significant tax revenues over their operating lifetimes.

For rural counties, utility-scale solar projects often become a long-term source of public funding for schools, infrastructure, and emergency services. As data centers expand into smaller communities, energy projects linked to them can transform local economies.

TotalEnergies’ Strategy: Tailored Power for High-Load Customers

TotalEnergies is positioning itself as a key energy partner for industries with massive and growing electricity needs. Its customer portfolio already includes major industrial and technology players such as Amazon, Microsoft, Airbus, Air Liquide, STMicroelectronics, Saint-Gobain, and Sasol.

The company’s approach goes beyond simple renewable supply. It combines solar, wind, battery storage, and flexible gas generation to deliver what it calls “clean firm power.” This hybrid model is increasingly important for data centers, which require 24/7 electricity with minimal interruptions.

Marc-Antoine Pignon, TotalEnergies’ Vice President for Renewables in the U.S., highlighted that the Google deal is the company’s largest renewable PPA volume ever signed in the country. He also pointed to the challenges of land availability and power supply for data centers, noting that large-scale colocation opportunities are becoming essential as AI infrastructure expands.

A Growing U.S. and Global Renewable Portfolio

TotalEnergies has been steadily expanding its renewable footprint. In the United States, it holds around 10 GW of onshore solar, wind, and storage capacity, with roughly 5 GW located in Texas. Globally, the company had more than 32 GW of installed renewable capacity by late 2025 and aims to produce over 100 TWh of net electricity by 2030.

total energies renewable portfolio
Source: TotalEnergies

This growth reflects a broader strategy to transition from a traditional oil and gas company into a diversified energy producer. By investing heavily in renewables and flexible assets, TotalEnergies is positioning itself for a future where electricity plays a central role in the global energy mix.

EARLIER: 

Google’s Aggressive Clean Energy Procurement Drive

Google is one of the world’s largest corporate buyers of renewable energy, and its procurement strategy has accelerated dramatically in recent years. Since 2010, the company has signed more than 170 clean energy agreements totaling over 22 GW of capacity. These deals span North America, Europe, Asia Pacific, and Latin America.

google data centre electricity consumption
Source: Google

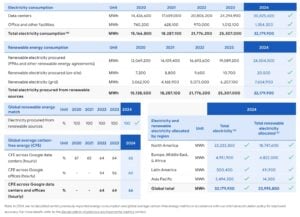
In 2024 alone, Google contracted more than 8 GW of additional clean energy—twice the volume of the previous year and the largest annual total in its history. These agreements are designed to stay ahead of the company’s rapid load growth, particularly from AI and cloud services.

google data center emissions
Source: Google

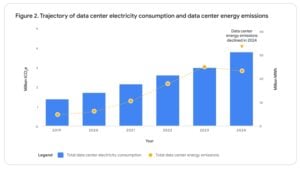
Despite a 27% year-on-year increase in data center electricity consumption in 2024, Google reported a 12% reduction in data center energy emissions.

  • It estimates that its clean energy purchases avoided more than 8.2 million tonnes of CO₂ equivalent in 2024 and over 44 million tonnes cumulatively since 2011.

This shows that large-scale procurement can decouple emissions growth from electricity demand, at least in the near term.

Data Centers Are Reshaping Electricity Demand

The International Energy Agency (IEA )’s latest electricity report has highlighted data centers as a major driver of electricity demand growth in the United States. Electricity consumption rose by 2.8% in 2024 and 2.1% in 2025, with data centers expected to account for nearly half of future growth.

Industrial sectors such as semiconductor manufacturing and battery production will also contribute significantly, but digital infrastructure is among the fastest-growing loads.

AI workloads are particularly energy-intensive. Training large models requires massive, continuously running computing clusters, while inference workloads scale with user demand. This creates a constant, high-load electricity profile that challenges traditional grid planning.

2026 US Renewable Outlook and Policy Headwinds

The IEA also forecasts that nearly 250 GW of renewable energy capacity will be deployed in the U.S. between 2026 and 2030, with utility-scale solar accounting for around 70% of additions. Wind and distributed solar will make up the remainder.

However, recent policy changes and the phase-out of certain tax incentives have led to a downward revision of deployment forecasts. This underscores the growing importance of corporate buyers in sustaining renewable development.

When government support weakens, long-term PPAs from companies like Google provide the financial certainty developers need to build projects. In this sense, tech firms are becoming critical enablers of the energy transition.

iea 2026 us electricty demand

A New Power Paradigm for the Digital Age

The TotalEnergies and Google solar agreement states that electricity is no longer just an operating expense. It is a strategic asset that determines the scalability and sustainability of digital infrastructure.

For TotalEnergies, the deal reinforces its role as a key supplier of tailored renewable power to high-load customers. For Google, it ensures reliable, affordable, and low-carbon electricity for its expanding AI and cloud operations.

More broadly, the partnership reflects a new phase in the global energy transition, where private companies play a central role in financing and building clean power infrastructure. As AI, cloud computing, and digital services continue to expand, similar mega-scale PPAs are likely to become standard practice.

Lastly, but not least, Texas is becoming a global test case for high-growth, low-carbon grids. Its rapid demand growth, combined with large renewable deployment, will offer lessons for other regions facing similar challenges.

The post TotalEnergies and Google’s 1 GW Solar Deal Signals a New Phase in the Data Center Energy Race appeared first on Carbon Credits.
Nigeria Aims for 80 Million Clean Cookstoves and a $5 Billion Carbon Credit Revenue

Nigeria Aims for 80 Million Clean Cookstoves and a $5 Billion Carbon Credit Revenue

Nigeria is planning a large clean cooking program that aims to distribute 80 million efficient cookstoves to households. Project backers say the rollout could help reduce smoke from cooking, cut pressure on forests, and create a new stream of carbon credits.

Recent reporting in Nigeria says the project is also tied to a revenue target. A senior finance executive at project developer GreenPlinth Africa said the Federal Government could earn up to $5 billion each year from “verified carbon credit revenues” when the program reaches full scale.

Lagos State has also described itself as an early “anchor” for the program. Lagos State Government announced it will lead the way in providing 6 million free cookstoves. Distribution in the state has started in June 2025, beginning in Makoko.

Mr. Tunde Lemo, former Deputy Governor of the Central Bank of Nigeria, commented:

“This is not a pilot. It is not a promise. It is a nationally endorsed, structured, and scalable intervention…This is one of the most ambitious clean cooking and household energy transition programmes ever undertaken globally.”

An 80 Million Stove Rollout With National Ambitions

Lagos State’s climate office describes the initiative as a nationwide effort to deploy 80 million efficient cookstoves free of charge. It says the goal is to sharply reduce traditional firewood use for women and low-income households.

Large stove programs usually try to replace or improve traditional cooking methods that produce heavy smoke indoors. In many households, cooking uses wood, charcoal, or other solid fuels. These fuels can release fine particles and other pollutants, especially in kitchens with poor airflow.

The Clean Cooking Alliance’s Nigeria dashboard uses official sources like the World Bank. It estimates that over 167 million people, or 73.8%, in Nigeria did not have access to clean cooking in 2023.

That gap is wider outside cities. The same dashboard reports that 26.2% of Nigeria’s population had access to clean fuels and technologies for cooking in 2023. It also reports 48.7% access in urban areas versus 9.7% in rural areas in 2023.

Cooking Smoke as a Public Health Crisis

Global health agencies link household smoke from cooking to major health harms. The World Health Organization (WHO) estimates that household air pollution led to around 2.9 million deaths in 2021. This includes more than 309,000 children under age 5.

WHO also estimates that household air pollution caused about 95 million DALYs in 2021. This measure combines years lost to early death and disability. The organization notes that the health burden is tied to diseases such as heart disease, stroke, and lung disease.

Moreover, a WHO technical page shows how household air pollution causes deaths. Here’s the breakdown:

  • Ischaemic heart disease: 32%
  • Stroke: 23%
  • Lower respiratory infections: 21%
  • COPD: 19%
  • Lung cancer: 6%

Global energy data also shows the scale of the challenge. The International Energy Agency (IEA) estimates 2.3 billion people worldwide still cook using open fires or basic stoves that create harmful smoke.

In Nigeria, a large stove program could affect health most in communities that rely heavily on fuelwood or charcoal. It could also change how much time families spend collecting fuel. It could lower daily smoke exposure for cooks and nearby children when stoves are used correctly and consistently.

From Kitchen Emissions to Carbon Markets

The project narrative links emissions cuts from cleaner cooking to carbon markets. Carbon crediting usually relies on measuring and verifying how much a project cuts greenhouse gas emissions compared to a baseline.

International rules also matter if the project aims to generate credits for compliance uses under the Paris Agreement. Under Article 6, countries can cooperate to meet climate targets, including through carbon credits created from verified emission reductions.

Within Article 6, the Article 6.4 mechanism (also called the Paris Agreement Crediting Mechanism) has a UN-backed governance structure. UNFCCC explains that an Article 6.4 Supervisory Body develops and supervises requirements to run the mechanism. This includes approving methodologies, registering activities, accrediting verification bodies, and managing a registry.

This matters because cookstove projects often face scrutiny over real-world use. Carbon credit quality can depend on factors like whether households actually use the new stove, how long they keep using it, and whether old stoves stay in use at the same time. Credible monitoring and verification are central to project integrity under any crediting pathway.

IEA clean cooking projection 2030
Source: IEA

The IEA predicts that clean cooking access will hit around 85% by 2030. This means over 350 million people, mainly in sub-Saharan Africa, will still lack safe cooking options. They will continue to rely on polluting open fires and basic stoves.

To achieve universal access by 2030, there’s a need to connect 160 million people each year. However, funding shortages and infrastructure issues make this unlikely. That requires about $2 billion a year just for Africa to make it happen.

The IEA believes full access by 2040 is more realistic. This will come from increased use of LPG, which will cover about 60% of new connections. It will also involve electric cooking, advanced biomass stoves, and various financing options such as carbon credits. And Nigeria is heading in that direction.

What a $5 Billion Carbon Claim Would Require

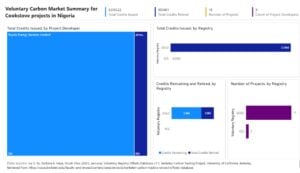
Nigeria already has experience with cookstove carbon projects on a smaller scale. The Clean Cooking Alliance’s Nigeria dashboard says the country has 18 registered cookstove projects that have generated 3.4 million carbon credits to date.

The credits from 9 developers are verified by Verra’s VCS and Gold Standard, as seen:

Nigeria cookstove project carbon credit summary
Source: Clean Cooking Alliance

The proposed 80 million-stove rollout is far larger than typical programs. Supporters argue that scale could also mean large volumes of credited emission reductions, especially if adoption remains high over many years.

The $5 billion per year figure has drawn attention because it implies both a large credit volume and a strong credit price. The figure cited in Nigerian reporting was presented as a projection tied to “verified” carbon credit revenues once the project is fully deployed.

Still, projected revenue is not the same as guaranteed income. Real outcomes depend on several conditions, including:

  • The number of stoves actually delivered and used,
  • The verified emissions reductions per household,
  • Approval under the chosen crediting pathway,
  • Market demand, and
  • The price and transaction costs for credits.

Lagos State’s official post highlights a key milestone: 6 million stoves in Lagos. However, it does not confirm future credit volumes or prices.

Delivery, Use, and Verification Will Decide the Outcome

Several signals will help observers judge the program’s progress and credibility.

First is delivery at scale. A plan for 80 million stoves requires large manufacturing or import capacity, distribution logistics, and after-sales support. Maintenance matters because stoves can fail or be abandoned if they do not meet cooking needs.

Second is sustained use. Clean cooking benefits and emissions cuts depend on households consistently using the new stove. Programs often track usage through surveys, sensors, or fuel consumption checks. Strong monitoring also supports more credible carbon claims.

Third is alignment with recognized rules. If the project aims to issue credits under Paris Agreement pathways, it must follow the requirements of Article 6.4 Supervisory Body. This includes using accepted methodologies and verification practices.

Finally, there is the public data baseline. Nigeria’s clean cooking access is still low overall. The Clean Cooking Alliance dashboard, using World Bank data, reported 26.2% access in 2023, with much lower access in rural areas. A well-run program could shift those numbers over time, but it will require steady funding and coordination across states.

For now, the story combines a large public health goal with a climate finance goal, and the scale is ambitious. The key question is whether implementation, monitoring, and market demand can match the size of the revenue promise.

The post Nigeria Aims for 80 Million Clean Cookstoves and a $5 Billion Carbon Credit Revenue appeared first on Carbon Credits.
ICVCM Adds New CCP-Approved Carbon Credit Methods for Isometric, Gold Standard and ACR

ICVCM Adds New CCP-Approved Carbon Credit Methods for Isometric, Gold Standard and ACR

The Integrity Council for the Voluntary Carbon Market (ICVCM) published new decisions under its Core Carbon Principles (CCP) program. The update covers three carbon credit methodologies, also called “categories” in ICVCM’s system. One methodology received full approval, and two received conditional approval.

ICVCM’s CCP label is meant to help buyers spot carbon credits that meet a clear, minimum integrity bar. ICVCM uses an Assessment Framework to apply its label. This framework checks how programs and methods handle key issues, including quantification, additionality, monitoring, and verification.

According to Annette L. Nazareth, Chair of the Governing Board, ICVCM

“Demand for CCP-labelled credits has grown steadily, commanding price premiums that reflect buyers’ renewed trust. Policymakers, multilateral institutions, and standard-setters have incorporated the CCPs into their own frameworks, recognising the Integrity Council’s role in building coherence across voluntary and compliance markets.”

The three decisions were:

  • Isometric: ISM Reforestation Protocol v1.1 — CCP Approved
  • Gold Standard: Methane emission reduction by adjusted water management practice in rice cultivation v1.0 — CCP Approved (Conditional)
  • American Carbon Registry (ACR): Improved Forest Management (IFM) on Non-Federal US Forestlands v2.0 — CCP Approved (Conditional)

How the CCP Label Works and When Conditions Apply

A CCP-approved method can earn credits for the CCP label. Projects need to follow the method and the program’s usual rules. In this ICVCM update, the Isometric reforestation method was approved without conditions. This means credits issued under it can get CCP labeling immediately.

A CCP-approved but conditional methodology can still earn the label, but only if specific conditions are met. These conditions can apply to how projects prove additionality. They can also apply to how projects account for risks. Finally, they may apply to how projects set baselines and leakage deductions.

ICVCM also published a market-level snapshot with its February 2026 decisions. It approved eight carbon-crediting programs as CCP-Eligible. It also approved 38 methodologies.

However, 22 methodologies did not meet the requirements. About 105 million credits were approved for the CCP label. Of these, 52 million are available, while 53 million have been retired or canceled. Globally, here’s ICVCM’s carbon credit achievement:

ICVCM carbon credit facts global
Source: ICVCM

Isometric Sets a First for Nature-Based CCP Credits

ICVCM granted full CCP approval to Isometric’s ISM Reforestation Protocol v1.1, which Isometric published in October 2025. The protocol outlines rules for measuring carbon removals from reforestation. This refers to restoring forest cover on land that was once forested. ICVCM placed it under the broader Afforestation, Reforestation, and Revegetation (ARR) category.

ICVCM said the assessment found the protocol met all relevant criteria in the CCP Assessment Framework. Because the body approved it with no conditions, it stated that all credits issued under the methodology will be eligible for CCP labels.

The Integrity Council also shared early activity indicators for this protocol. It said no credits had been issued yet, but 20 project developers were already registered under the methodology. The organization added that Isometric expects to issue over 4 million credits annually by 2030 under this protocol.

Isometric announced this week that the approval makes its Reforestation Protocol the first nature-based protocol with the CCP label.

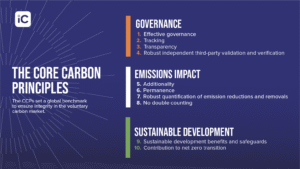
ICVCM core carbon principles
Source: ICVCM

Rice Methane Credits Get a Conditional Green Light

ICVCM gave conditional CCP approval to Gold Standard’s method for cutting methane emissions. This method focuses on adjusting water management in rice cultivation (version 1.0). The Integrity Council announced that it published the methodology in July 2023. It is the first approved method for avoiding methane in rice cultivation.

The basic idea behind adjusted water management is simple. Flooded rice fields can produce methane because organic matter breaks down without oxygen. Changing water levels during the growing season can reduce methane formation.

Gold Standard’s documentation states that methane forms in flooded fields with low oxygen. It also notes that the methodology helps water regime changes that reduce methane emissions.

ICVCM also pointed to recent research on the scale of rice methane. A Nature Research Highlight from May 2025 said that a new inventory found rice paddy methane emissions were over 39 million metric tonnes in 2022.

Why Some Credits Qualify, and Others Don’t

The Integrity Council said the rice methodology qualifies for CCP approval only when specific conditions are met. The conditions show how a project proves additionality in some cases. They also explain a rule update about soil organic carbon loss risk in the methodology.

ICVCM also gave credit volume and pipeline estimates. It said about 50,000 credits had been issued under this methodology so far. However, the body understood that none of those credits complied with the first condition. As a result, the organization said those already-issued credits will not be eligible for the CCP label.

ICVCM noted that Gold Standard plans to issue up to 3.2 million credits in the next five years. This is based on its current project pipeline projections. It also listed the main project locations as India, plus activities in Pakistan, Vietnam, Bangladesh, Cambodia, Ghana, Indonesia, Lao PDR, Nepal, and Thailand.

ACR’s Forest Credits Face Tighter Baseline Tests

Same with Gold Standard, ICVCM also granted conditional CCP approval to ACR’s Improved Forest Management (IFM) on Non-Federal US Forestlands v2.0. IFM projects aim to change forest management practices to increase stored carbon or avoid emissions compared with a baseline scenario.

ICVCM explained that v2.0 is an earlier version of an IFM methodology that its Governing Board had already approved in August 2025 (v2.1). For v2.1, ICVCM had set a condition tied to leakage.

  • A leakage deduction is needed for projects that cut wood product output by less than 5%. This keeps treatment consistent with projects that exceed that threshold.

For v2.0, ICVCM set two additional conditions. The methodology can earn CCP labeling if:

  • A dynamic evaluation of the baseline is verified in line with ACR’s tool for dynamic baseline evaluation (developed with v2.1), and/or
  • Removal credits are generated using a specified equation in the methodology (ICVCM references Equation 30).

ICVCM also quantified the immediate impact. It said 2.7 million credits were expected to be immediately eligible for the CCP label out of 13.3 million issued credits under this methodology.

The Integrity Council also stated that past and future removal credits from this method can get CCP labels. Future emission reduction credits can qualify, too, if they use the dynamic baseline evaluation tool.

ACR said the CCP label will soon activate for 2.7 million eligible IFM 2.0 credits in the ACR registry. They linked eligibility to the same baseline evaluation tool.

What CCP Expansion Means for Buyers and Developers

These ICVCM decisions matter because they expand the set of methodologies that can produce credits with the CCP label. For buyers, the label can act as a quick screen when building procurement rules. CCP decisions can influence method evolution for project developers and standards bodies. Conditional approvals often need updates to methods or stricter project tests.

At the same time, the details show that CCP labeling is not automatic. For example, ICVCM’s conditions for the rice methodology mean that some already-issued credits will not qualify. In the IFM case, ICVCM tied eligibility to specific approaches for baselines and the type of credit (removals versus emission reductions).

The approvals expand high-integrity CCP-labeled credits. They also signal growing supply for buyers while enforcing strict standards on baselines, additionality, and verification—shaping voluntary carbon markets toward greater quality and scale.

The post ICVCM Adds New CCP-Approved Carbon Credit Methods for Isometric, Gold Standard and ACR appeared first on Carbon Credits.