The European Union (EU) is considering a new policy that could allow the use of international carbon credits to help meet its ambitious 2040 climate target. If implemented carefully, the plan could unlock significant climate finance for projects in developing countries, particularly initiatives that expand access to clean cooking technologies.
At a recent clean cooking summit hosted by the International Energy Agency (IEA), France’s climate ambassador Benoît Faraco suggested that the EU could become a major investor in carbon credit projects. These investments could help accelerate efforts to replace polluting wood and biomass stoves with cleaner alternatives across Africa and other regions.
However, the proposal has also revived a long-standing debate in climate policy. Supporters argue that carbon credits can finance climate solutions globally, while critics warn that poorly designed projects can exaggerate emissions reductions and undermine climate integrity.
As global demand for carbon credits grows, the EU’s upcoming rules could shape the future of the voluntary carbon market.
EU’s 2040 Climate Target and the Role of Carbon Credits
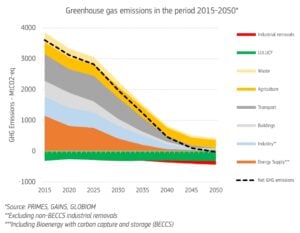
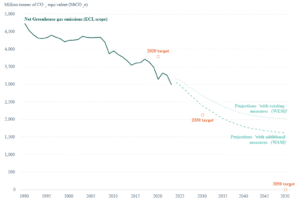
The European Union plans to cut greenhouse gas emissions by 90% from 1990 levels by 2040, making it one of the most ambitious climate targets globally. To support this goal, policymakers are exploring allowing a limited share of emissions reductions to come from high-quality international carbon credits.
Under the emerging framework, these credits could account for up to about 5% of the emissions reductions needed to meet the 2040 goal. The mechanism would likely begin in 2036 and would include strict safeguards designed to ensure environmental integrity.
EU officials believe this approach could ease pressure on domestic industries while still maintaining the bloc’s overall climate ambition. At the same time, it could channel new climate finance into developing countries where emissions reductions can often be achieved at lower costs.
However, the European Commission has not yet finalized the rules governing which projects would qualify or how these credits would be sourced and verified.
Clean Cooking Projects Could Benefit
One area that could receive significant investment is clean cooking technology. During the IEA summit, Benoît Faraco suggested that EU participation in carbon markets could help scale up efforts to replace traditional cooking methods with cleaner alternatives such as liquefied petroleum gas (LPG).
Across many developing countries, households still rely heavily on wood, charcoal, or biomass for cooking. These fuels create severe indoor air pollution and contribute to deforestation and greenhouse gas emissions.
Globally, the challenge remains enormous:
More than two billion people still lack access to clean cooking
Indoor air pollution linked to traditional cooking contributes to millions of deaths every year
Most of those without access live in rural areas where energy infrastructure remains limited.
Expanding access to modern cooking technologies requires large investments in equipment, fuel distribution systems, and consumer financing. Carbon credit funding could help close these financial gaps.
Private companies are already experimenting with this approach. TotalEnergies, for example, has invested in LPG infrastructure aimed at expanding clean cooking access across Africa and India.
One notable initiative involves a cookstove project in Rwanda developed with the organization DelAgua. The program aims to distribute 200,000 high-performance cookstoves to rural households.
Within a year, the project is expected to benefit more than 800,000 people living in rural communities. Compared with traditional open fires, the improved cookstoves significantly reduce pollution and fuel consumption.
The new stoves cut harmful smoke emissions by about 81% and reduce wood use by roughly 71%. Over ten years, the initiative could prevent more than 2.5 million tonnes of carbon dioxide equivalent emissions.
These avoided emissions generate carbon credits that companies can purchase as part of their climate strategies. The program also supports Rwanda’s national goal of providing universal access to clean cooking by 2030.
Global Carbon Markets Are Expanding
Recent developments in international climate policy suggest that clean cooking projects may play a growing role in carbon markets.
In February 2026, a United Nations body approved the first carbon credits to be issued under the global carbon market established by the Paris Agreement. The approved activity focuses on distributing efficient cookstoves in Myanmar.
The project aims to reduce household air pollution and limit pressure on forests by lowering fuelwood consumption. Some of the credits will be used within South Korea’s emissions trading system, while the remaining credits will support Myanmar’s own climate commitments.
UN climate officials highlighted the broader benefits of clean cooking initiatives. These projects not only cut emissions but also improve health, protect forests, and reduce the burden on women and girls who often spend hours collecting firewood.
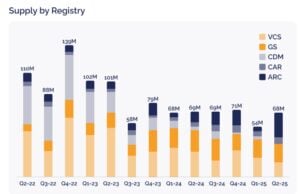
Meanwhile, data from the voluntary carbon market shows growing activity. A report from SCB Group found that carbon credit issuances increased by 28% quarter-on-quarter in the second quarter of 2025.
During that period, about 68 million credits were issued globally. Cookstove projects accounted for the largest share of these credits, representing roughly 29% of total issuances. Wind projects followed with about 20%, while forest conservation initiatives made up around 13%.
Most cookstove credits were certified under the Verra and Gold Standard programs.
Source: Green.Earth
Concerns About Credit Integrity
Despite their potential benefits, cookstove carbon credits have long been controversial. Some climate experts argue that many projects exaggerate their emissions reductions.
Monitoring real-world stove usage can be difficult. Households may receive improved stoves but continue using traditional cooking methods alongside them. In such cases, the actual emissions reductions may be smaller than estimated.
Environmental organizations have also raised concerns about weak monitoring systems and inconsistent verification standards across carbon markets.
An expert from the Brussels-based NGO Carbon Market Watch warned that relying on credits that have repeatedly failed to meet expectations could pose significant risks for climate policy.
These concerns reflect lessons from earlier offset systems, including the Clean Development Mechanism under the Kyoto Protocol. Several projects approved under that framework later faced criticism for overstating emissions reductions.
Because of this history, regulators are now under pressure to ensure that any new carbon credit systems deliver real and measurable climate benefits.
Strong Standards Will Be Critical
EU policymakers say the success of their carbon credit strategy will depend on strict oversight and transparency.
Future rules are expected to focus on three key principles:
strong monitoring and independent verification
clear safeguards to prevent double-counting of emissions reductions
proof that projects deliver additional climate benefits beyond the host countries’ own targets
If implemented effectively, these standards could strengthen confidence in international carbon markets.
At the same time, critics argue that carbon credits should only play a limited role in meeting climate targets. They warn that over-reliance on external offsets could delay necessary emissions reductions within Europe itself.
A Major Global Challenge Remains
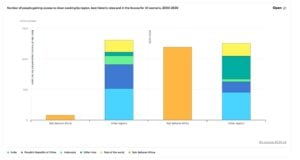
The clean cooking challenge illustrates why new financing mechanisms are urgently needed. IEA estimates that around 300 million people must gain access to clean cooking solutions every year to achieve universal access by 2030.
Sub-Saharan Africa accounts for roughly half of the population still relying on traditional cooking fuels. Many rural communities lack access to modern energy infrastructure and affordable alternatives.
Replicating the progress achieved in countries such as China, India, and Indonesia will require large investments and coordinated policy efforts. Carbon finance could become an important tool to accelerate this transition.
Source: IEA
Overall, the European Union’s potential use of international carbon credits could reshape the global carbon market and unlock new funding for climate solutions in developing countries.
Clean cooking projects represent one of the most visible opportunities. They deliver clear health and environmental benefits while reducing greenhouse gas emissions.
However, the debate over carbon credits highlights a deeper challenge. Policymakers must ensure that these credits represent real, measurable emissions reductions rather than accounting shortcuts.
If the EU succeeds in designing a robust framework with strict quality standards, international carbon markets could channel billions of dollars into projects that improve lives and reduce emissions worldwide.
A war in the Middle East may increase demand for carbon credits if it continues for a long time. Analysts say energy supply disruptions from the conflict could push some industries back to higher‑emission fuels like coal. This, in turn, could raise emissions and force companies in regulated markets to buy more carbon credits.
The Middle East conflict has already disrupted liquefied natural gas (LNG) supplies. Qatar, a top LNG producer, has halted output at its largest LNG plant. This is due to disruptions in transport routes through the Strait of Hormuz. Qatar supplies about 20% of global LNG output.
LNG provides cleaner fuel for power generation than coal. When gas costs rise sharply or supply is limited, utilities sometimes increase coal use to meet electricity demand. Higher coal use increases carbon emissions. This can lead to higher demand for carbon credits in compliance markets.
Carbon Credits 101: How the Market Responds
A carbon credit represents one tonne of greenhouse gas emissions reduced, avoided, or removed from the atmosphere. Companies must hold carbon credits to meet emissions limits in regulated markets. These markets are part of government climate policy.
Compliance carbon markets, like emissions trading systems (ETS), require companies to lower their emissions. If they can’t, they must buy credits to stay within a limit.
Over 113 carbon pricing systems are in use worldwide. This includes ETS and carbon taxes, which cover about 28% of global greenhouse gas emissions.
In compliance markets, rising emissions usually increase demand for allowances or carbon credits. If companies cannot reduce emissions fast enough, they buy credits to stay compliant. Strong or rising demand can also influence credit prices.
Voluntary carbon markets exist separately from compliance markets. In voluntary markets, companies buy credits to meet internal climate goals, not legal limits.
The voluntary market is smaller but growing. The global voluntary carbon credit market is expected to rise from $1.88 billion in 2025 to $2.29 billion in 2026. It could reach $4.92 billion by 2030.
From Gas to Coal: When Utilities Flip the Switch
The Middle East conflict has pushed energy prices higher. Global natural gas and oil prices climbed because of risks to supply routes such as the Strait of Hormuz, a key passage for crude oil and LNG.
Source: TradingView
When gas prices rise, utilities may switch from gas‑fired generation to coal, which is cheaper but emits more CO₂. Analysts observed that fuel switching happened in 2022 after Russia invaded Ukraine. European gas supply was disrupted, so utilities turned to burning more coal.
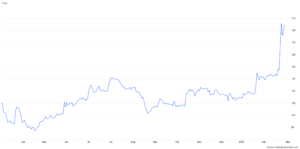
Coal prices have also risen in response to supply pressures. Some markets saw thermal coal prices climb about 26%, reaching highs not seen in more than two years.
Source: Trading Economics
Such shifts can put pressure on emissions limits in regulated markets. Higher emissions would require companies to buy more compliance credits to avoid penalties. This dynamic is central to why analysts say carbon credit demand could rise if disruptions persist.
Compliance Markets Under Pressure, So Who Pays the Price?
Compliance carbon markets form the largest portion of carbon credit demand. These include emissions trading systems in Europe, China, and the U.S., and expanding carbon pricing schemes globally. The Middle East conflict could affect these markets, which shows how energy security and climate policy are connected.
Demand for carbon credits depends on how countries and companies aim to meet climate goals, like those in the Paris Agreement. This agreement aims to limit global warming to below 2°C. Compliance markets set legal limits, and voluntary markets support corporate climate goals.
If more companies switch to coal and emissions go up, compliance markets might see a higher demand for allowances or credits. This happens as companies try to stay within legal limits. This could result in higher carbon prices and tighter markets, depending on how regulators respond.
In the European Union Emissions Trading System (EU ETS), companies must hold allowances equal to their emissions, or face fines. The EU is considering reforms to improve market stability and balance supply and demand for allowances. This scheme has been a key tool for reducing emissions in Europe since 2005.
In addition, more sectors are entering compliance markets. For example, China’s national ETS covers key industrial sources. It accounts for a big part of emissions from the world’s largest emitter.
Any rise in emissions from fuel switching could increase demand in these established markets. However, the exact impact will depend on how long energy disruptions continue and whether regulators adjust compliance caps or other rules.
Voluntary Market Volatility: Green Goals on Hold?
Global carbon pricing revenues topped over $100 billion in 2023 and in 2024. The World Bank reports that around $69 billion came from emissions trading systems and $33 billion from carbon taxes. This amount covers nearly 24% of global greenhouse gas emissions, which reflects the growing scale of these markets.
While compliance demand may rise if emissions increase, the outlook for the voluntary market could differ.
According to analysts, an energy crisis may temporarily constrain corporate spending on voluntary credits. High energy prices raise operating costs. This may lead companies to delay voluntary purchases as they will focus more on their core operations instead.
High-integrity voluntary markets have grown recently. This growth is driven by corporate net-zero commitments and new standards. Companies increasingly seek credits that meet quality criteria such as compliance eligibility, durability, and third‑party verification.
Sudden economic strains or changes in energy costs could quickly change how companies buy.
The Ripple Effect: Energy Security Meets Climate Action
A prolonged Middle East conflict could have ripple effects beyond energy prices. Disruptions to LNG supply may push some utilities toward higher‑emission fuels, raising emissions levels. That could drive demand for carbon credits in regulated markets where companies must meet emissions limits.
At the same time, short‑term pressures from high energy costs could slow voluntary demand as companies focus on operational priorities. The overall direction of carbon credit demand will depend on the duration of energy supply disruptions, policy responses by regulators, and the pace of the global energy transition.
Carbon markets are an evolving part of climate policy, linking energy markets and climate goals. As energy security concerns grow, the role of carbon credits in balancing compliance and emissions reductions may attract more attention from policymakers, investors, and companies in the coming years.
https://globalcarbonfund.com/wp-content/uploads/2018/10/GCF_header_logo_340x156.png00carbonfundhttps://globalcarbonfund.com/wp-content/uploads/2018/10/GCF_header_logo_340x156.pngcarbonfund2026-03-10 07:15:032026-03-10 07:15:03War Could Boost Carbon Credit Demand: How Middle East Energy Crisis May Reshape Climate Markets
The carbon removal industry is expanding fast, with new projects moving from the pilot stage to the commercial scale. Companies are racing to build infrastructure that can permanently remove carbon dioxide from the atmosphere. One of them is a Canadian carbon management company, Svante Technologies, which announced that it acquired Carbon Alpha Corporation. This move brings together carbon capture technology with carbon dioxide removal (CDR) project development.
The acquisition strengthens Svante’s role in the carbon capture and storage (CCS) value chain. It also adds Carbon Alpha’s development portfolio to Svante’s operations.
Claude Letourneau, President & CEO of Svante, remarked:
“This project is a game-changer for Svante and a pivotal moment for scaling verifiable, durable engineered carbon removal solutions working in tandem with nature. By integrating Carbon Alpha’s team, we’re accelerating the delivery of high‑integrity CDR credits at commercial scale in partnership with the MLTC leadership, who is closely coordinating with us on the North Star Project.”
The North Star Project: A New Source of Carbon Removal Credits
The key asset in the deal is the North Star Bioenergy Carbon Capture and Storage (BECCS) project in Saskatchewan. The facility will capture carbon dioxide from the Meadow Lake Tribal Council Bioenergy Centre. This is how it works:
This plant produces renewable electricity and heat using forestry waste biomass from nearby sawmills.
Phase one of the project is designed to capture up to 140,000 tonnes of CO₂ per year from biomass combustion emissions.
The captured carbon dioxide will move through a dedicated pipeline to a deep saline aquifer. There, it will be stored permanently underground.
This process removes carbon from the natural cycle because biomass absorbs CO₂ while growing. Capturing and storing that carbon after combustion results in net negative emissions.
The project will generate durable carbon dioxide removal credits. Each credit represents one ton of CO₂ removed. These credits can be sold to companies seeking verified carbon removal to meet climate targets.
Carbon Alpha had already developed the project structure and storage system before the acquisition. Svante now takes over development and integration. The next step will be a front-end engineering design (FEED) study and test-well drilling program. A final investment decision is expected in early 2027.
Industry analysts say deals like this show how the carbon removal sector is shifting from research to deployment. Companies are now building full systems that include capture, transport, and long-term storage.
The acquisition expands Svante’s strategy to build an integrated carbon management company. It develops modular carbon capture systems that use nanoengineered solid sorbent filters to capture CO₂ from industrial emissions.
The technology is designed for industries that are difficult to decarbonize. These include cement, steel, hydrogen production, and power generation.
Before the acquisition, Svante already had expertise in capture technology. Carbon Alpha adds expertise in project development, geological storage, and carbon credit generation. This combination creates a full value chain for CCS in Canada:
Capture CO₂ from industrial sources or biomass energy
Transport the CO₂ through pipelines
Store the carbon permanently underground
Generate verified carbon removal credits
Industry experts say this type of integration is important. Carbon removal projects often fail because separate companies handle capture, storage, and financing.
The strategic acquisition includes Carbon Alpha’s development expertise, North Star Carbon Solutions LP’s ownership structure, and eligibility for Canada’s 50% CCUS investment tax credit, positioning Svante to scale multiple BECCS projects rapidly.
By combining these elements, Svante aims to scale projects faster.
First Nations Partnership Anchors the Project in Saskatchewan
The North Star project is being developed in partnership with the Meadow Lake Tribal Council (MLTC). The organization represents nine First Nations communities in northwest Saskatchewan.
Under the project structure, MLTC will be a co-owner of the BECCS facility alongside Svante. The partnership focuses on three main goals: local economic development, job creation, and long-term environmental leadership.
The bioenergy facility already produces renewable electricity and heat using forestry residues. The carbon capture system adds another layer of value. It turns the facility into a carbon removal hub that can produce verified CDR credits.
The project also includes the development of a regional CO₂ pipeline and storage hub. This infrastructure could support other emitters in the region.
Biogenic carbon sources from forestry, agriculture, or bioenergy plants could connect to the same storage network. This approach could turn the region into a carbon removal cluster.
Global Demand for Carbon Removal Is Rising Fast
The acquisition comes at a time when demand for carbon removal is increasing worldwide. Most countries now include carbon removal in long-term climate plans. Industry groups expect global carbon removal markets to reach hundreds of millions of tonnes of capacity by the 2030s.
Source: McKinsey & Company
Boston Consulting Group (BCG) outlines three demand scenarios for 2030–2040: low (40–80 MtCO₂/year), medium (70–230 MtCO₂/year), and high (200–870 MtCO₂/year). McKinsey also estimates durable CDR demand could hit 100 MtCO₂ by 2030, with announced supply at ~50 MtCO₂, creating a supply-demand gap.
The Intergovernmental Panel on Climate Change says that limiting global warming to 1.5°C will require removing billions of tonnes of CO₂ annually by mid-century. Many climate models further show that 5 to 10 billion tonnes of carbon removal per year may be needed by 2050. That translates to between $6 – $16 trillion of investment by mid-century.
Today, global carbon removal capacity is still very small. Most engineered projects remove only thousands or tens of thousands of tonnes annually.
However, investment is rising quickly. Major corporations such as Microsoft, Stripe, and Alphabet have signed large contracts for high-quality carbon removal credits.
Governments are also supporting the sector. In Canada, carbon capture projects can receive financial support through the CCUS investment tax credit. This covers up to 50% of eligible capture equipment costs, depending on project type. These incentives aim to help scale early infrastructure.
Source: Natural Resources Canada.
At 140,000 tCO₂/year, North Star Phase 1 represents about 35x the capacity of Climeworks‘ Orca plant. It also aligns with Microsoft‘s annual CDR purchasing scale, demonstrating commercial viability for durable removal credits.
Why BECCS Is a Key Carbon Removal Technology
Bioenergy with carbon capture and storage is one of the most widely studied carbon removal technologies. BECCS combines three steps:
Biomass absorbs CO₂ while growing.
The biomass is used to produce energy.
Carbon emissions are captured and stored underground.
This creates net negative emissions. The technology also produces electricity or heat, which can improve project economics. However, large-scale BECCS projects require several conditions, including:
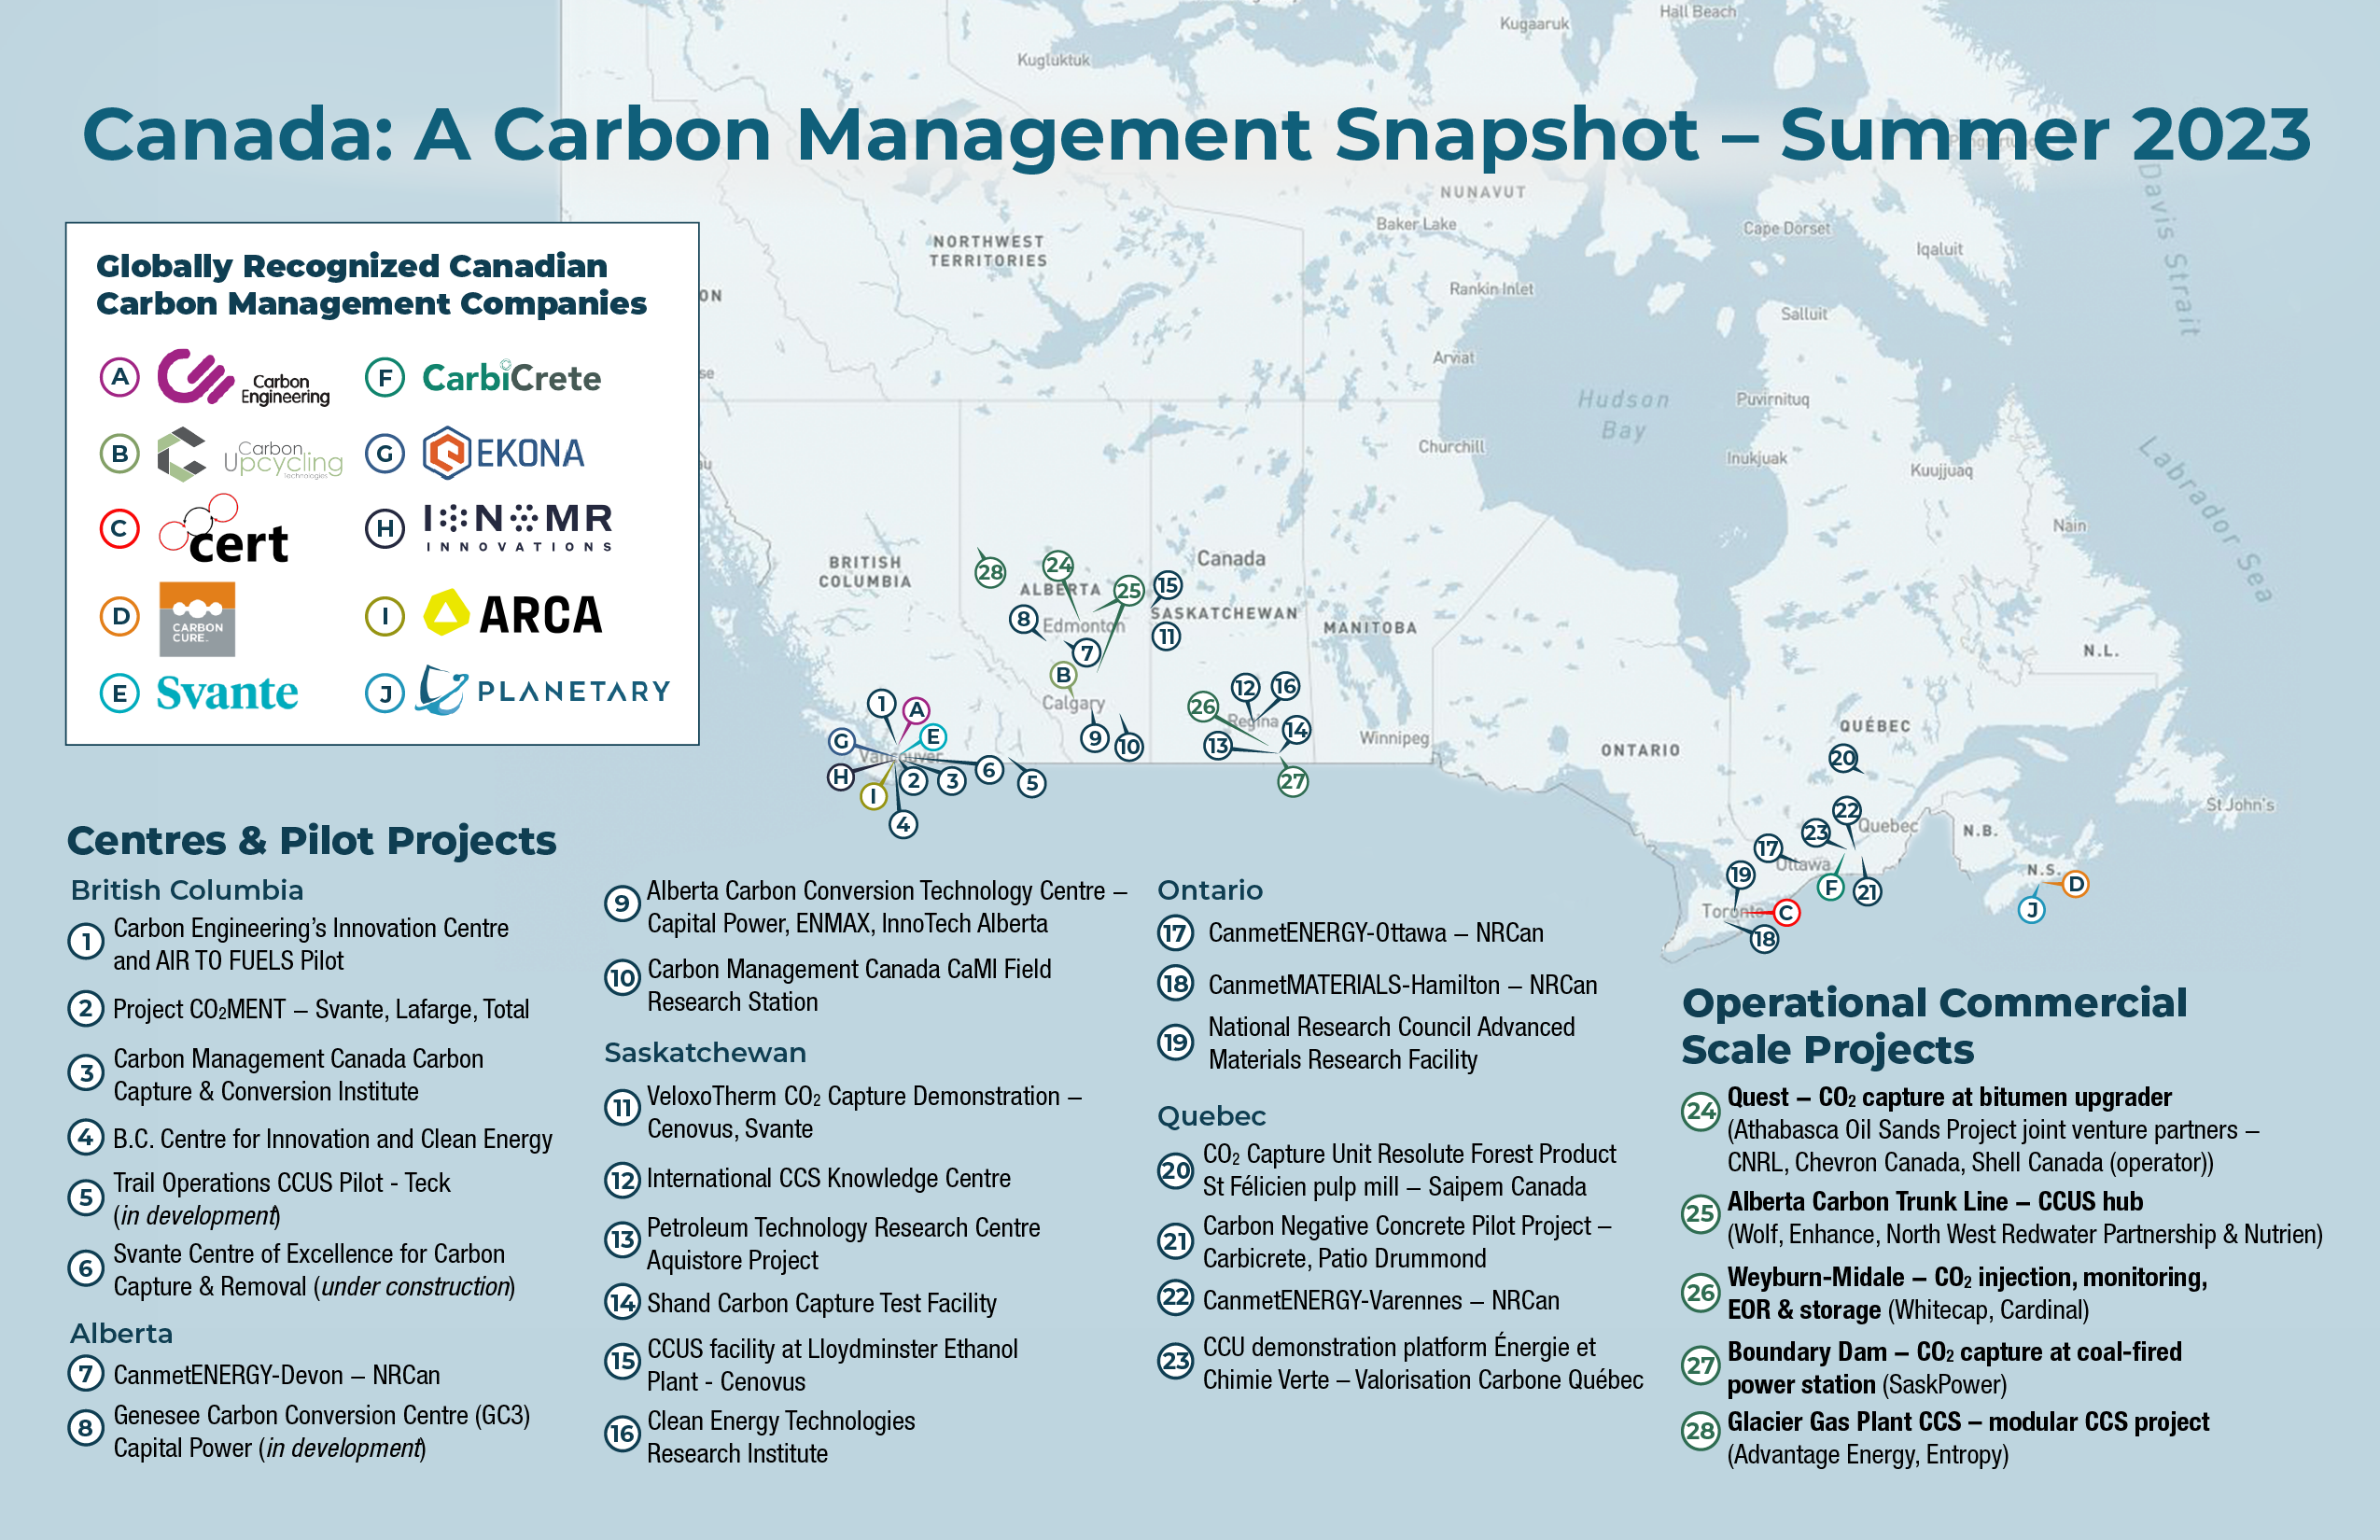
Canada has strong potential for BECCS development because of its forestry resources and suitable geological formations. Western Canada already hosts major CCS infrastructure. For example, large carbon storage reservoirs exist in Alberta and Saskatchewan.
Map of Canada showing saline formations and sedimentary basins
Data source: North American Carbon Storage Atlas. Image from Natural Resources Canada.
This geological capacity could store billions of tonnes of CO₂ over time. Developers say regional storage hubs will be essential for scaling carbon removal.
The Next Phase for Carbon Removal Infrastructure
The acquisition of Carbon Alpha marks an important step in the industrialization of carbon removal. Instead of isolated pilot projects, companies are now building complete carbon management systems.
For Svante, the deal strengthens its ability to build and operate large carbon removal projects. For the broader market, it shows how carbon removal is moving from concept to infrastructure.
As governments and companies push toward net-zero targets, the demand for durable carbon removal credits is expected to keep rising. Projects like North Star may become an important part of the global climate strategy.
Disseminated on behalf of Alaska Energy Metals Corporation.
nickel Price Analysis Today
Nickel prices slipped 0.26% today, settling at $17,391.65/Ton globally and ¥120,116/Ton in China. This pullback was primarily driven by a strengthening US dollar and escalating Middle East geopolitical tensions, fueling broader risk-off sentiment. Surging LME inventories also capped upside momentum. However, a surprisingly weak US nonfarm payrolls report revived Fed rate cut expectations, helping offset losses. Furthermore, strict Indonesian ore quotas and firm demand from Chinese stainless steel mills provided a robust structural floor.
As the global energy transition accelerates, access to critical minerals is becoming just as important as innovation itself. Among these materials, nickel plays a central role. It powers electric vehicle batteries, supports energy storage systems, and remains essential for industrial applications such as stainless steel. Yet, while demand continues to climb, supply risks are growing—largely due to Indonesia’s tightening control over global nickel production.
In this shifting landscape, Alaska Energy Metals Corporation (AEMC) is advancing its Nikolai Nickel Project in interior Alaska. The project is emerging as a potential domestic anchor for U.S. nickel supply at a time when geopolitical, environmental, and market pressures are reshaping the global nickel industry.
Indonesia’s Nickel Dominance—and Its Strategic Pullback
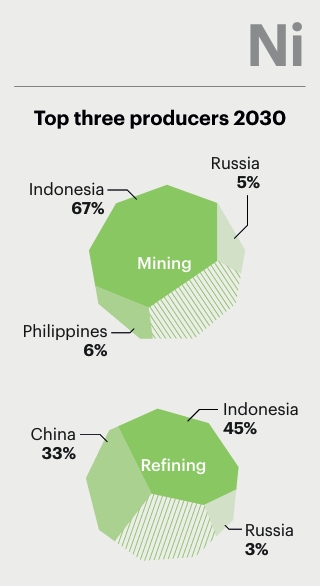
Indonesia currently dominates global nickel supply, accounting for nearly half of the world’s mined output. Over the past decade, the country expanded production rapidly, flooding the market and pushing prices lower. However, that era appears to be ending.
In January, Indonesia’s Ministry of Energy and Mineral Resources announced a sharp reduction in nickel ore production quotas. For 2026, the government set quotas at 250–260 million tonnes, down significantly from the 379 million tonnes approved for 2025. This shift represents one of the most aggressive supply controls the nickel market has seen in years.
At the same time, Indonesia changed the validity of its mining work plans (RKABs) from three years to one. As a result, the government now holds direct annual control over production levels, allowing it to adjust supply more tightly in response to prices, environmental pressures, and domestic processing capacity.
The policy pivot aims to preserve long-term reserves, stabilize prices, and push miners toward value-added processing such as nickel matte production for EV batteries. However, it also introduces uncertainty for global buyers that rely heavily on Indonesian supply.
Short-Term Surplus, Long-Term Risk
On the surface, the nickel market still appears well supplied. Analysts forecast a 261,000-tonne surplus in 2026, with global supply estimated at 3.78 million tonnes compared to demand of 3.52 million tonnes. Inventories remain elevated due to previous years of overproduction.
Yet this balance may prove fragile. Actual production in 2025 already fell short of approved quotas due to underutilized capacity and rising costs. If prices weaken further, high-cost operations could shut down, tightening supply faster than expected.
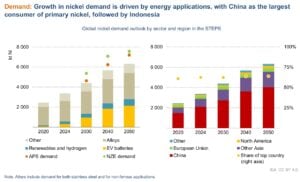
Meanwhile, demand continues to grow. The IEA projects that the use of nickel in EV batteries, renewables, and stainless steel will push nickel demand above 5.5 Mt by 2035. As Indonesia tightens output and China dominates downstream processing, Western economies face rising exposure to supply disruptions and geopolitical leverage.
Against this backdrop, the Nikolai Nickel Project represents a rare opportunity for the United States.
Located in interior Alaska, Nikolai hosts the Eureka deposit, now recognized as the largest nickel resource in the U.S. Beyond nickel, the deposit also contains copper, cobalt, chromium, platinum, and palladium—metals that play key roles in clean energy, defense systems, and advanced manufacturing.
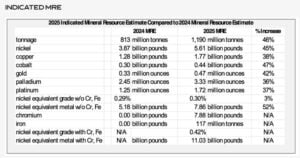
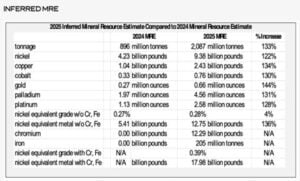
In March, AEMC released an updated 2025 Mineral Resource Estimate, which significantly upgraded the project’s scale and quality. The update increased both tonnage and metal content compared to the 2024 estimate.
Measured and Indicated Resources now include 61 billion pounds of nickel and 1.77 billion pounds of copper, representing a 46% increase. Inferred resources rose even more sharply, climbing over 120% to 9.38 billion pounds of nickel and 2.43 billion pounds of copper.
Importantly, the deposit remains open in three directions, suggesting additional expansion potential as exploration continues.
Here are the tables that show Nikolai’s 2025 mineral resource estimates:
Source: AEMCSource: AEMC
Geology That Supports Long-Term Development
Nikolai’s geological characteristics further strengthen its strategic appeal.
The Eureka deposit features highly consistent and continuous mineralization, reducing geological risk. A higher-grade core sits near the surface, which may lower mining costs during early production phases. In addition, a low strip ratio supports efficient material movement and long-term mine planning.
Equally important, Nikolai is dominated by sulfide mineralization, rather than lateritic ore. This distinction matters. Lateritic nickel, common in Indonesia, requires energy-intensive processing and often carries a higher carbon footprint. Sulfide deposits typically allow for more straightforward processing routes with lower emissions.
Source: AEMC
Cleaner Processing and On-Site Refining Potential
To build on this advantage, AEMC is actively exploring cleaner processing pathways.
Metallurgical testing is underway at SGS Laboratories in Lakefield, Ontario, where the company has conducted extensive work using magnetic separation and flotation techniques. A processing flow sheet has already been established, and a locked-cycle test is scheduled in the near term.
The current plan aims to produce:
A bulk nickel–copper–cobalt concentrate
A separate iron–chromium concentrate
Further testing will determine whether copper can be separated into its own concentrate to improve overall economics. The miner planned to publish metallurgical results in November 2025.
In parallel, the company signed a memorandum of understanding with RecycLiCo U.S. Mineral Recovery. This partnership will test hydrometallurgical refining methods that could be applied directly to Nikolai concentrates. If successful, this approach may allow semi-refined or refined nickel, copper, and cobalt to be produced on site in Alaska. Such a development would reduce reliance on foreign smelters, cut transportation emissions, and strengthen domestic battery supply chains.
Alongside, AEMC has also signed an MOU with Lucid Group, Inc (NASDAQ: LCID), maker of the world’s most advanced electric vehicles.
AEMC President & CEO Gregory Beischer commented on this development,
“By developing resilient automotive supply chains, we establish commercially viable mining operations that also help strengthen the American Defense Industrial Base. Sourcing minerals domestically enables better regulatory oversight, higher environmental standards, metal source traceability, and responsible sourcing. This approach mitigates harmful environmental and human rights risks often associated with foreign mining operations and provides an opportunity to improve the livelihoods of American communities.”
Strategic Importance for U.S. Supply Chains
The United States currently relies entirely on imported nickel, making it vulnerable to supply shocks, trade restrictions, and price volatility. In this context, Nikolai represents more than an economic opportunity—it carries strategic value.
A domestic nickel source could support:
EV battery manufacturing
Grid-scale energy storage
Defense and aerospace applications
Long-term clean energy deployment
As electrification expands and renewable energy integration accelerates, reliable access to nickel will become increasingly critical. Domestic production could help ensure that clean energy growth does not come at the cost of supply insecurity.
Permitting, Planning, and Federal Support
Nikolai’s inclusion on the U.S. FAST-41 Transparency Dashboard highlights its national significance. The program aims to improve coordination and transparency for major infrastructure and resource projects, potentially streamlining future permitting processes.
Meanwhile, AEMC continues to pursue U.S. government funding, noting recent federal support awarded to other critical minerals projects in Alaska. Public funding or strategic investment could help de-risk early development stages and accelerate timelines.
The company is also conducting an internal Options Study to assess potential mine development pathways and high-level economics. While results will not be published, the work will inform a formal Preliminary Economic Assessment planned for 2026.
Investment Takeaway
As Indonesia tightens supply and demand continues to grow, the nickel market is entering a new phase—one defined less by oversupply and more by security, jurisdiction, and processing control.
In this environment, Alaska Energy Metals’ Nikolai Project stands out as a long-duration strategic asset. Its scale, location, resource growth, and alignment with U.S. supply chain priorities position it well for long-term relevance.
For investors seeking exposure to nickel beyond Indonesia and China, Nikolai offers a differentiated opportunity—one that combines commodity upside with geopolitical and strategic optionality.
Europe’s carbon market is facing new political pressure. Europe’s largest business lobby group has called for reforms. At the same time, Italy has asked for a temporary suspension of the system. These calls focus on the European Union Emissions Trading System (EU ETS).
The EU ETS is the world’s largest carbon market. It covers around 40% of the EU’s total greenhouse gas emissions. It sets a cap on emissions from power plants, heavy industry, and aviation within Europe.
Under this scheme, companies must hold allowances for each ton of carbon dioxide (CO₂) they emit. They can buy and sell these allowances on the market. Recent carbon price swings and concerns about industrial competitiveness have triggered a new debate.
Inside the System: How Europe’s Carbon Market Operates
The EU ETS started in 2005. It now operates in its fourth phase, which runs from 2021 to 2030. The cap on emissions declines each year. This ensures that total emissions fall over time.
Under the reforms agreed in 2023, the annual cap will decline faster. The linear reduction factor increased to 4.3% per year from 2024 to 2027 and to 4.4% per year from 2028 to 2030.
The EU also decided to cut the total cap by 90 million allowances in 2024 and 27 million allowances in 2026.
In 2023, emissions from sectors covered by the EU ETS fell by about 15.5% compared to 2022, according to the European Commission. Power sector emissions dropped sharply due to higher renewable energy use and lower gas demand. Since 2005, emissions from ETS sectors have fallen by around 47%.
The EU aims to cut net greenhouse gas emissions by at least 55% by 2030 compared to 1990 levels. This target is part of the European Climate Law. The EU ETS is a key tool to meet that goal.
Source: European Commission
From €10 to €100: The Price Swings Shaping the Debate
Carbon prices in the EU ETS have risen strongly in recent years. In 2018, prices were below €10 per ton. By early 2023, prices reached record highs of around €100 per ton.
However, prices fell in 2024. By early 2025, EU carbon prices were trading closer to €60–€70 per ton. Slower industrial activity, lower energy demand, and market expectations about future supply influenced this drop.
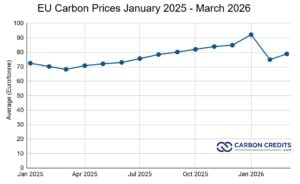
Most recently, EU prices have fluctuated, trading around €70–€75 per tonne of CO₂ in early March 2026, after rising from their lows in late 2025. On March 3, 2026, EU carbon allowances were around €74.20 per tonne. This is a slight rise from recent lows, but still below the peaks above €90 from earlier in the year.
Data source: TradingEconomics
The Market Stability Reserve (MSR) adjusts the supply of allowances. It removes surplus allowances from the market when supply is high. In 2023, the MSR continued to absorb allowances to support market balance.
Despite these controls, industry groups say price volatility creates uncertainty. Energy-intensive sectors such as steel, cement, chemicals, and aluminum face higher costs when carbon prices rise.
BusinessEurope represents national business federations across the EU. In early 2026, it called for reforms to the EU carbon market.
The group warned that high energy and carbon costs are hurting European industry. It said the EU risks “deindustrialization” if companies move production outside Europe. This could lead to carbon leakage, where emissions shift to countries with weaker climate rules.
BusinessEurope asked EU policymakers to review the Market Stability Reserve. It also called for measures to reduce excessive price swings. The group stressed the need to align climate policy with industrial competitiveness and reduce energy prices in the short term.
Source: BusinessEurope
The lobby group noted in its paper:
“The enabling conditions and incentives to create a viable business case for decarbonisation are still largely missing. The EU has yet to put in place effective short-term measures to lower energy costs and close the related cost competitiveness gap faced by European companies compared to their global competitors… Moreover, EU climate and energy policies continue to lack a genuinely technology-neutral approach. For example, state aid thresholds still differentiate between technologies, making it harder for industries to invest in the technologies needed to achieve Europe’s climate neutrality targets.”
At the same time, the EU has introduced the Carbon Border Adjustment Mechanism (CBAM). CBAM will apply a carbon price on imports of cement, steel, aluminum, fertilizers, electricity, and hydrogen.
The goal is to level the playing field between EU and non-EU producers. The system is in its transitional phase from 2023 to 2025. Full financial obligations begin in 2026.
Italy’s Bold Proposal: Hit Pause on Carbon Pricing?
Italy has taken a stronger position. Italian officials have called for a temporary suspension of the EU ETS. They argue that high carbon prices increase electricity costs and hurt households and businesses.
“The ETS, as currently conceived, represents an additional tax on European companies, affecting costs and limiting their competitiveness.”
Italy relies on gas for a large share of its power generation. When gas prices rise, electricity prices also increase. Adding a carbon price can raise costs further. Italian leaders say this creates pressure on industry and families.
However, suspending the EU ETS would require agreement at EU level. The carbon market is governed by EU law. A single member state cannot stop it alone.
The European Commission has defended the system. It argues that the EU ETS reduces emissions in a cost-effective way. It also generates revenue for member states. In 2023, EU ETS auction revenues reached tens of billions of euros across the bloc. These funds support climate action, energy transition, and social measures.
Billions at Stake: Where Carbon Market Revenues Go
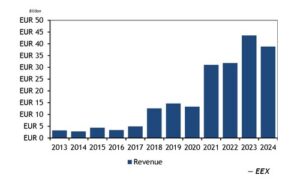
EU member states receive most revenue from auctioning carbon allowances. From 2013 to late 2025, total auction revenues have exceeded €245 billion, per official EU sources.
In 2024 alone, revenues totaled around €39 billion (down from €44 billion in 2023), with €24.4-25 billion going directly to member states despite lower average prices of €64.76/tCO2.
Source: Argus Media
At least 50% of auction revenues must be used for climate and energy-related purposes. Many countries report using much more than this minimum share.
The EU ETS also funds innovation. The Innovation Fund supports low-carbon technologies in industry and energy. It is financed by the sale of 450 million allowances from 2020 to 2030. The Modernisation Fund supports lower-income EU countries in upgrading their energy systems.
These funds aim to help the industry reduce emissions rather than relocate.
What Could Reform Look Like?
The European Commission has signaled a review of the ETS later in 2026. This review comes as part of the broader European Green Deal, the EU’s plan to reach net-zero emissions by 2050.
Reform proposals could include:
Adjusting the pace at which free allowances are phased out.
Modifying how carbon prices are calculated or allocated.
Changing how new sectors like transport and buildings are integrated into the system.
Some industry representatives also want changes to the CBAM. CBAM is a carbon tariff on certain imported goods, such as steel, cement, and fertilisers, starting in 2026. It aims to prevent carbon leakage by making non-EU products pay a carbon cost similar to EU goods.
However, the European Commission recently rejected calls to suspend carbon levies on fertilisers, saying the CBAM must remain stable to protect EU producers.
Reform could seek a balance between climate goals and business competitiveness. How to achieve this balance remains a key question for EU policymakers.
The Road Ahead: Reform, Resistance, or Reinforcement?
The debate reflects a broader tension. The EU wants to cut emissions quickly. At the same time, it wants to protect industrial jobs and economic growth.
The European Commission will continue monitoring the carbon market. It publishes regular reports on supply, demand, and price trends. Any major reform would require agreement from the European Parliament and EU member states.
For now, the EU ETS remains central to Europe’s climate policy. It has helped drive a nearly 50% cut in emissions from covered sectors since 2005. But political pressure is rising. The outcome will shape Europe’s path toward its 2030 target and its longer-term aim of climate neutrality by 2050.
https://globalcarbonfund.com/wp-content/uploads/2018/10/GCF_header_logo_340x156.png00carbonfundhttps://globalcarbonfund.com/wp-content/uploads/2018/10/GCF_header_logo_340x156.pngcarbonfund2026-03-09 13:15:382026-03-09 13:15:38EU Carbon Market under Pressure: Business Lobby for Reform, Italy Calls for Suspension
Nickel prices slipped 0.28% today to $17,388.31/Ton globally and ¥120,132/Ton in China. This minor pullback is primarily driven by a strengthening US dollar and escalating Middle East tensions, which have fueled broader risk-off sentiment across industrial metals. Additionally, surging LME inventories—driven by an influx of Chinese material amid weak domestic demand—continue to cap upside momentum. However, ongoing concerns regarding Indonesian ore quota supply constraints provide a solid floor, preventing a steeper decline.
Nickel has moved from being a niche industrial metal to a critical pillar of the global energy transition, along with copper, lithium, and uranium.
Once primarily used in stainless steel, nickel is now critical for high-energy-density batteries, electric vehicles (EVs), grid storage, aerospace alloys, and emerging hydrogen infrastructure.
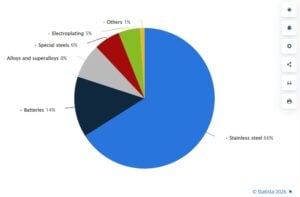
Essentially, it’s now another mineral on that list, albeit one that seems to have largely flown under most investors’ radars thus far. However, it’s understandable why that’s been the case – after all, the primary use for mined nickel has long been industrial, with over three-quarters of global nickel demand being for things like alloy production or electroplating.
Distribution of primary nickel consumption worldwide in 2024, by industry
Nickel Basics: Types, Grades, and Industrial Uses
Nickel is a silvery-white transition metal with high corrosion resistance, ductility, and thermal stability. Its unique properties make it indispensable in alloys and electrochemical applications.
Nickel is generally classified into two main categories:
Class 1 nickel: High-purity nickel metal, powders, briquettes, and salts such as nickel sulfate. These are essential for battery cathodes, advanced alloys, and aerospace applications.
Class 2 nickel: Ferronickel and nickel pig iron (NPI), primarily used in stainless steel production.
Historically, stainless steel accounted for roughly two-thirds of nickel consumption, providing a stable demand base. However, batteries have emerged as the fastest-growing segment, particularly for nickel-rich cathode chemistries such as NMC (nickel-manganese-cobalt) and NCA (nickel-cobalt-aluminum).
Aerospace, defense, and superalloys also rely heavily on nickel for high-temperature and corrosion-resistant applications.
This dual-market nature—spanning bulk industrial use and high-tech energy transition applications—makes nickel one of the most structurally complex metals in the critical minerals ecosystem.
Nickel Processing Technologies: The Backbone of the EV and Steel Boom
Not all nickel is equal, and processing technology determines where it ends up. Nickel processing is the set of industrial methods used to extract nickel from its ores and turn it into usable forms for various industries, including stainless steel, batteries, and alloys. Essentially, it’s how raw nickel in rocks becomes the high-purity metal or chemical compounds needed for manufacturing.
Nickel is mined mainly from two types of ores:
Sulfide ores – Found deep underground, easier to process, high purity.
Laterite ores – Found near the surface, lower nickel content, more challenging to process.
The Case Of Battery Grade Nickel
In order to be used in an electric vehicle, nickel must first be refined to extremely high purities, creating what’s known as “battery grade” nickel. Following this, it then needs to be dissolved in sulphuric acid to create nickel sulphate, which can then be used to produce battery cathodes.
Nickel’s high energy density, which allows it to hold more charge for less weight, makes high-nickel battery chemistries more desirable in EV batteries. While the first iterations of the lithium-ion battery used equal proportions of nickel, manganese, and cobalt, modern ones use as much nickel as manganese and cobalt combined.
And as technology continues to progress, it’s expected that the ratio will rise to as much as 80% nickel, or even more.
Now here’s a simple breakdown of the processing technologies:
Pyrometallurgy Still Dominates Stainless Steel
High-temperature smelting remains the most common route for nickel extraction. Rotary kiln–electric furnace (RKEF) and flash smelting convert sulfide and laterite ores into ferronickel or nickel pig iron (NPI). These products suit stainless steel, but they consume large amounts of energy and emit significant CO₂.
Notably, NPI and ferronickel continue to anchor global supply.
Hydrometallurgy Powers Battery-Grade Nickel
Hydrometallurgical routes, especially high-pressure acid leaching (HPAL), are becoming critical for EV batteries. HPAL converts laterite ores into mixed hydroxide precipitate (MHP) and then into nickel sulfate for cathodes.
Refining and Recycling Gain Momentum
Electrorefining and solvent extraction deliver high-purity Class 1 nickel. Refined products made up around 60% of the nickel market in 2024. Recycling is also rising as a low-carbon supply source.
In short, nickel processing is splitting into two markets: low-cost NPI for steel and high-purity nickel for batteries. This divide is reshaping supply chains, investment flows, and decarbonization strategies across the metals industry.
The Volatile Nickel Price Cycle
Unlike lithium, the nickel market is much more complex. The metal sits at the crossroads of geopolitics, industrial demand, and changing battery technology. Over the past five years, nickel prices have been highly volatile.
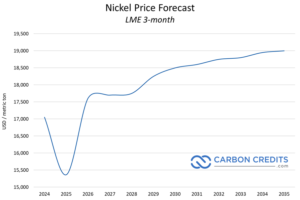
For example, during the 2022 LME squeeze, prices spiked above $100,000 per tonne. Then they dropped sharply to around $13,900 per tonne in early 2025.
Since then, they have started to recover, reaching about $17,200 per tonne by February 2026.
This volatility shows how sensitive nickel is to supply, demand, and global events. As EV demand grows, the nickel market will continue to face swings.
This volatility reflects a structural mismatch between supply expansion and shifting demand patterns. Massive Indonesian production growth has flooded the market, while battery chemistry trends toward lithium iron phosphate (LFP) have reduced nickel intensity in mass-market EVs. At the same time, premium EVs and aerospace applications continue to rely heavily on Class 1 nickel, creating a bifurcated market structure.
For investors, policymakers, and corporates, nickel represents a critical test case for the energy transition economy. Understanding its supply chain, macro drivers, and long-term price scenarios is essential for navigating the next decade of critical minerals markets.
Global Nickel Supply: Indonesia’s Dominance and Market Impact
Source: IEA
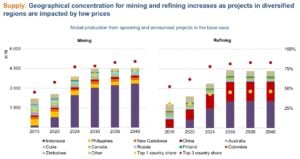
Indonesia has reshaped the global nickel market more than any other country. In 2024, its nickel in mine production was 2.2 million tonnes (mt), an increase of 158% over the previous five years. Its rise was fueled by a combination of raw-ore export bans, massive Chinese-backed investments in downstream processing, and the rapid deployment of high-pressure acid leach (HPAL) facilities for battery-grade nickel.
By consolidating both mining and smelting, Indonesia has established a vertically integrated nickel ecosystem capable of supplying both stainless steel and battery markets at low cost.
Policy Controls and Quota Management
Despite its dominance, Indonesia’s nickel supply faces tightening government controls in 2026. The government sharply reduced the nickel ore production quota (RKAB) to 250–260 million wet metric tonnes (wmt), down from 379 million wmt in 2025 and 298 million wmt initially approved for 2025—a cut of roughly 34%.
The move aims to align ore output with domestic smelter capacity, curb oversupply, and support prices. Following the announcement, LME nickel prices surged past $18,000/t before stabilizing near $17,200/t in February 2026.
Delays in RKAB approvals have already halted operations at mines such as PT Vale Indonesia, signaling enforcement risks for the policy. Meanwhile, demand growth is tempered by slower stainless steel uptake and the structural shift toward LFP batteries, which has helped sustain a global surplus forecast of 261–288 kt in 2026 despite production cuts.
Indonesia’s strategic approach—resource nationalism, controlled expansion, and downstream integration—has fundamentally altered global nickel pricing. Low production costs and government-backed industrial policy allow Indonesian producers to remain profitable even during periods of weak prices.
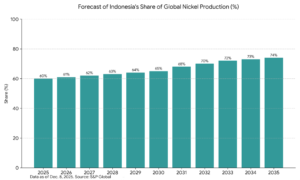
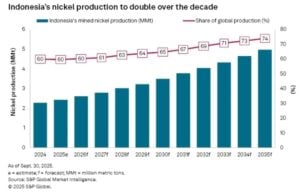
However, S&P Global noted that, “Indonesia is still projected to more than double its production over the next decade to an estimated 4.97 MMt by 2035.”
Source: S&P Global
China’s Role in the Nickel Supply Chain
China continues to dominate the processing of nickel intermediates and battery materials. Chinese firms have financed and built much of Indonesia’s upstream infrastructure, including HPAL plants and mixed hydroxide precipitate (MHP) facilities.
It is also the single largest consumer of nickel, driven by domestic stainless steel production and battery manufacturing. Policy shifts, stimulus measures, and industrial planning decisions in China have an outsized impact on global nickel markets, influencing both price and supply chain dynamics.
Other Global Producers
Beyond Indonesia and China, major nickel-producing countries include Russia, the Philippines, Canada, Australia, and New Caledonia. However, many high-cost producers have struggled to compete with Indonesia’s integrated, low-cost production model. For example, BHP suspended operations at its Nickel West facility in Western Australia amid persistent low prices, highlighting the competitive pressures faced by high-cost producers.
This dynamic has accelerated consolidation in the global nickel industry, with strategic repositioning focused on securing downstream processing and high-grade nickel for energy transition applications.
Nickel Demand Dynamics: Stainless Steel vs. Batteries
Stainless Steel: The Legacy Anchor
Stainless steel remains the primary driver of nickel demand, accounting for roughly two-thirds of consumption. Demand is closely tied to construction, infrastructure, and manufacturing activity. China, the world’s largest stainless steel producer, remains a key macro driver for nickel demand globally.
Class 1 Nickel: Powering the EV Boom
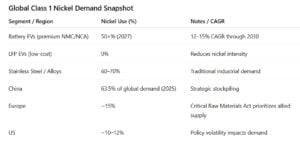
Nickel demand for batteries has grown fast over the past decade. Class 1 nickel, with purity above 99.8%, is key for high-energy NMC and NCA batteries. These batteries power premium EVs, giving longer driving ranges and lighter, more efficient vehicles. Advanced cathodes now contain 60–80% nickel, with some designs targeting 90%+ nickel content.
By 2030, nickel-heavy batteries could reach 1,320 MWh globally, covering about 80% of all EV lithium-ion batteries. Battery demand is expected to use over 50% of Class 1 nickel by 2027, growing at 12–15% per year. The average EV battery now contains 28–30 kg of nickel.
But there are risks:
LFP batteries, which contain no nickel, are growing in lower-cost EVs, especially in China. Nickel intensity per vehicle has fallen nearly one-third since 2020.
Policy differences affect supply: China held 63.5% of global nickel demand in 2025, Europe prioritizes allied supply, and US policies are less stable.
Source: Crux Investor
The Lights Are Green for Nickel
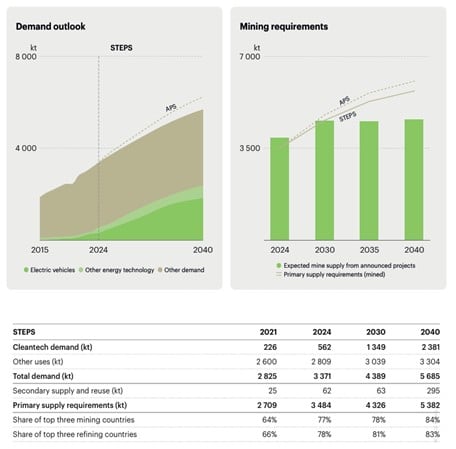
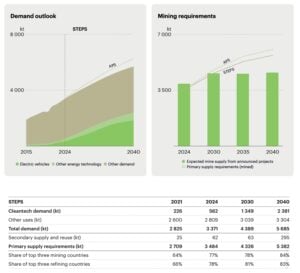
Forecasts from the International Energy Agency (IEA) project nickel demand more than doubling by 2035 under current pledges, potentially tripling in net-zero scenarios driven by EVs and storage.
Source: IEA
IEA also projects that nickel use in EV batteries, renewables, and stainless steel is projected to push nickel demand above 5.5 Mt by 2035. As Indonesia tightens output and China dominates downstream processing, Western economies face rising exposure to supply disruptions and geopolitical leverage. Even conservative outlooks show 8-9x EV battery demand growth by 2050, despite late-decade plateaus from chemistry shifts.
Long-Term Supply Outlook: From Oversupply to Potential Deficit
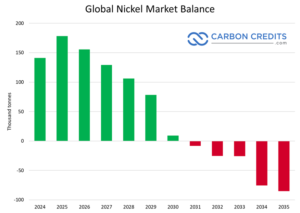
As per INSG last year, supply vastly outpaced demand, hitting 209-212 kt global surplus. Recently, S&P Global projected a 156,000-tonne surplus in 2026. However, the same analysis also says that today’s surplus will not last forever.
The report projects that global nickel stocks will peak around 2028. After that, inventories will begin to fall as demand improves and supply growth slows. By the early 2030s, the market balance will flip.
By 2031, S&P Global expects the primary nickel balance to turn negative. EV battery demand will grow as electrification expands. Stainless steel consumption will recover alongside global manufacturing. Significantly, Indonesian supply growth will slow as easy expansions may run out, and regulatory risks can increase.
Once inventories drop below comfortable weeks-of-consumption levels, prices respond quickly. S&P Global points to nickel prices rising toward $25,000 per tonne or higher, especially for Class 1 material.
Data source: S&P Global
Policy and Geopolitics: Resource Nationalism and Market Fragmentation
Indonesia exemplifies modern resource nationalism. The government’s export bans, production quotas, and mine suspensions aim to capture downstream value and stabilize prices.
Western governments are responding with critical minerals strategies, including subsidies, domestic mining support, and restrictions on Chinese supply chains. This could fragment the global nickel market into competing blocs, heightening geopolitical risk for downstream industries.
Most importantly, the Trump administration sees developing U.S. nickel supply chains as key to reducing dependence on foreign sources and boosting the domestic industry. Efforts include promoting new mining projects, speeding up permits for critical mineral operations, and exploring tariffs or other trade measures to support local production. One major example is a copper-nickel project in Minnesota, led by a joint venture between Glencore and Teck Resources.
Macro Drivers: Energy Transition, Industrial Demand, and Monetary Policy
Nickel is highly sensitive to macroeconomic and policy conditions. Industrial demand tracks global manufacturing cycles, while battery demand depends on EV adoption rates, subsidies, and consumer behavior.
Interest rates, inflation, and currency fluctuations affect nickel through speculative flows and production financing costs. Meanwhile, energy transition policies, carbon pricing, and ESG mandates are reshaping supply chains, pushing automakers and battery manufacturers to secure long-term nickel supply agreements.
Nickel’s Role in Carbon Markets and Net-Zero Strategies
Nickel’s importance extends beyond industrial use. Battery supply chains are central to decarbonization, embedding nickel demand in national net-zero strategies. Companies increasingly link nickel sourcing to ESG frameworks, carbon disclosure requirements, and sustainability-linked financing.
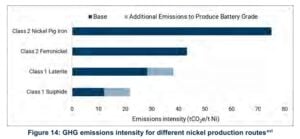
At the same time, nickel production drives greenhouse gas (GHG) emissions. According to a disclosure from the International Finance Corporation (World Bank Group), under a scenario accounting for declining ore grades and cleaner grids, emissions could rise 90% from 2020 to 2050. Additionally, a lack of decarbonization could push emissions to 164%.
Source: IFC
Most emissions come from processing rather than mining. Pyrometallurgical routes for Class 2 nickel (used in stainless steel) are coal-intensive, while Class 1 battery-grade nickel has lower emissions. Shifting to EV-focused, Class 1 production can help limit emissions growth.
Thus, cleaner processing, low-carbon production, and recycling could give automakers and battery makers a competitive edge, while decarbonized electricity is key to controlling nickel emissions as production rises.
Top 3 Nickel Producers Signal Tight Supply Heading into 2026
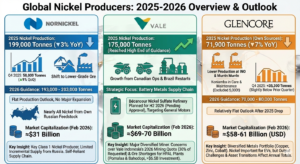
The global nickel market entered 2026 with cautious signals from its largest producers. Industry analysts revealed that mining output stayed broadly flat, disruptions persisted, and companies focused more on battery-grade processing than expanding supply. This reinforced expectations of a structurally tight nickel market.
Nornickel
Norilsk Nickel, or Nornickel, reported stable but slightly lower production in 2025. The company produced 199,000 tonnes of nickel, down 3% year-on-year, mainly due to a shift toward lower-grade disseminated ore. Production recovered in the fourth quarter, rising 9% quarter-on-quarter to 58,000 tonnes after scheduled maintenance in Q3. Nearly all nickel came from the company’s own Russian feedstock, highlighting its self-reliant supply chain.
For 2026, Nornickel guided nickel output between 193,000 and 203,000 tonnes, signaling flat production with no major expansion plans. Nornickel’s market capitalization stood at about $31 billion as of February 2026, underscoring its role as a major global supplier despite geopolitical constraints.
The lack of growth from one of the world’s key Class 1 nickel producers suggests limited incremental supply from Russia.
Vale
Brazil’s Vale continued to position itself as a strategic player in the battery metals supply chain. The company plans a nickel sulfate refinery in Bécancour, Québec, with deliveries to General Motors targeted for the second half of 2026, pending regulatory approvals. This move highlighted Vale’s push toward high-purity battery materials rather than bulk nickel mining.
Vale’s market capitalization was around $69–70 billion in early 2026, making it one of the largest diversified miners with significant nickel exposure. It produced 175,000 tonnes of nickel in 2025, reaching the high end of its guidance. Growth came from Canadian operations in Sudbury and Long Harbour and restarts in Brazil.
Looking ahead, Vale Indonesia warned its 2026 mining quota won’t meet demand for new nickel smelters. The approved quota is only about 30% of what the company requested, raising concerns that upcoming processing plants could face ore shortages.
Vale and partners are building three HPAL plants for EV battery nickel. The Pomalaa plant, starting in August 2026, will need 21 million tonnes of limonite ore per year, while Bahodopi will require 10.4 million tonnes annually. These projects represent over $6.5 billion in investment and highlight the growing pressure on Indonesia’s nickel supply.
Glencore
Glencore’s 2025 Full‑Year Production Report showed nickel output from its own sources at 71,900 tonnes, down about 7% from 82,300 tonnes in 2024. This decline was driven by lower production at both Integrated Nickel Operations (INO) and the Murrin Murrin operations. The reported figure excludes 5,000 tonnes from the Koniambo project, which is in care and maintenance.
In the fourth quarter of 2025, nickel production (including third‑party feed) was around 35,300 tonnes, slightly below the prior quarter. Glencore also gave 2026 nickel guidance of 70,000–80,000 tonnes, reflecting a relatively flat outlook after the 2025 drop.
Its nickel business is part of a broader diversified metals portfolio, with the company also producing copper, zinc, cobalt, coal, and other commodities. Nickel remains important to its strategy, especially given rising EV battery demand, but output challenges and asset transitions affected annual totals.
As of February 2026, Glencore’s market capitalization is widely reported to be around $58–61 billion (USD) based on its London Stock Exchange listing and share price.
This positions Glencore as a major diversified mining and commodity trading company, though smaller in market value than some of its peers like Rio Tinto or BHP. The company’s valuation reflects its breadth across metals, energy, and marketing operations, and its prospects are often shaped by commodity price swings and operational performance.
Source: Company reports
Risks and Opportunities for Investors and Policymakers
The top nickel producers showed limited growth in mining output while accelerating investments in battery-grade processing. Ore quality challenges, regulatory delays, and operational disruptions continued to constrain supply. At the same time, electric vehicle demand and energy transition needs kept rising.
The lack of aggressive supply expansion from major producers suggests the nickel market could remain structurally tight through the late 2020s, especially for high-purity Class 1 nickel required in batteries.
This is why nickel stocks present a unique combination of risks and opportunities. Supply concentration, policy interventions, and technological disruption create price volatility. Conversely, long-term demand from electrification, aviation, and hydrogen infrastructure provides structural upside.
Investors must navigate cyclical price swings, while policymakers balance industrial policy with market stability. Strategic supply agreements, diversification, and technology adoption will be crucial for managing risk.
Conclusion: Nickel’s Strategic Decade Ahead
Nickel is entering a decisive decade. The metal is so vital for the global energy transition, but faces structural uncertainty from supply expansion and evolving battery technology.
The next ten years will determine whether nickel becomes a stable metal of clean energy supply chains or a cautionary case study in commodity oversupply and industrial policy missteps. For institutions, understanding nickel’s macro dynamics, supply chains, and policy risks is essential. The metal’s trajectory will shape not only battery markets but also the geopolitics of the global energy transition.
https://globalcarbonfund.com/wp-content/uploads/2018/10/GCF_header_logo_340x156.png00carbonfundhttps://globalcarbonfund.com/wp-content/uploads/2018/10/GCF_header_logo_340x156.pngcarbonfund2026-03-09 13:15:372026-03-09 13:15:37The Ultimate Guide to Nickel: Supply, Demand, and Nickel Prices for 2026 and Beyond
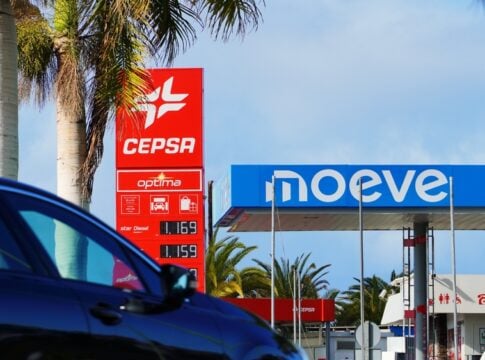
Spanish energy company Moeve approved more than €1 billion ($1.2 billion) for the first phase of its Andalusian Green Hydrogen Valley. The final investment decision cleared the way for construction to begin in the coming weeks. Significantly, Moeve will hold a 51% majority stake. The remaining share will be owned by Masdar and Enalter.
Enalter is majority controlled by Enagás Renovable, a pioneer in renewable gas development. Meanwhile, Masdar brings global clean energy expertise from Abu Dhabi.
This first phase, called Onuba, will install 300 megawatts (MW) of electrolyser capacity in southern Spain. Moreover, the company kept the option to expand the project by another 100 MW, subject to grid access and board approval.
Onuba: A Strategic Project With European Backing
The Onuba project will be the largest green hydrogen facility in southern Europe once operational. It carries a total investment of over €1 billion. That includes related infrastructure and a dedicated solar power plant for self-consumption.
Importantly, the project secured strong public support. The European Commission classified it as a Project of Common European Interest (PCI). In addition, the Spanish government awarded €304 million in funding under its Recovery, Transformation and Resilience Plan. This support came through the EU’s NextGenerationEU program under the Hydrogen Valleys scheme.
Such backing places the project at the center of Europe’s industrial decarbonization strategy. Brussels aims to reduce dependence on imported fossil fuels while scaling domestic clean energy production.
Ownership Mix Boosts Financing
This ownership mix reflects a wider shift in global capital. Gulf and European investors are increasingly channeling funds into hydrogen infrastructure. Notably, Moeve itself is owned by Mubadala, Abu Dhabi’s sovereign fund, and U.S. private equity firm Carlyle. As a result, the project benefits from deep financial backing and international reach.
Production Capacity and Climate Impact
At 300 MW, Onuba will produce about 45,000 tonnes of green hydrogen per year. This output will help avoid around 250,000 tonnes of CO₂ annually.
Simply put, the emissions reduction equals more than the total emissions generated by passenger vehicles with internal combustion engines in the Spanish cities of Huelva, Cádiz, and Jaén.
The hydrogen produced will serve multiple sectors. It will support aviation fuels, road transport, and marine fuels. In addition, it will help decarbonize chemical and fertilizer industries. Therefore, the project directly targets hard-to-abate sectors.
Solving the Grid Bottleneck
Grid access has slowed many hydrogen projects across Europe. However, Moeve recently secured a connection to the Spanish electricity grid. This approval came at a crucial time.
Besides grid power, the project will use a dedicated solar plant. This hybrid model will stabilize the electricity supply and improve the plant’s carbon intensity profile.
Access to renewable electricity remains essential. Green hydrogen only delivers climate benefits when powered by clean energy. Therefore, Andalusia’s strong solar resources give the region a clear advantage.
Furthermore, the region’s port infrastructure could support exports of hydrogen derivatives such as ammonia to northern European markets. This strengthens Spain’s ambition to become a renewable energy exporter.
Moeve’s Broader €8 Billion Transition Plan
The hydrogen valley forms part of Moeve’s broader €8 billion transition strategy. Formerly known as Cepsa, the company rebranded in 2024 to signal its shift toward low-carbon businesses.
Since 2022, Moeve sold most of its oil production assets, including operations in Abu Dhabi and South America. It redirected that capital into renewables, biofuels, and hydrogen.
This capital reallocation marks a clear pivot. Instead of expanding oil production, the company invested in long-term clean infrastructure.
Financially, the company strengthened its position before making this move. Net profit rose to €341 million last year, compared to €92 million in 2024. This improved profitability provided internal funding capacity for large-scale energy transition projects.
At the same time, Moeve entered non-binding talks with Portuguese energy firm Galp. The companies are exploring a combination of refining, chemicals, and fuel retail businesses. They aim to complete due diligence and possibly reach an agreement by mid-2026.
If successful, consolidation could free up more capital. It could also stabilize legacy businesses during the transition period.
Low-carbon hydrogen plays a critical role in cutting emissions from industry and transport. The European Union set ambitious goals under its hydrogen strategy and REPowerEU plan. The bloc aims to produce 10 million tonnes of renewable hydrogen and import another 10 million tonnes by 2030.
However, the path remains complex.
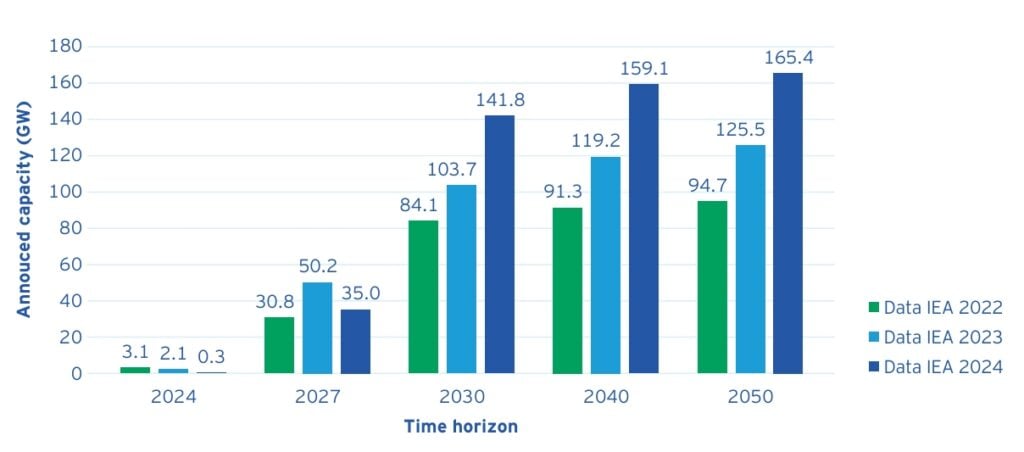
Analysts say that by 2030, Europe would need at least 100 gigawatts (GW) of installed electrolyser capacity to meet REPowerEU targets. That implies annual capacity growth of roughly 150% between 2025 and 2030. By comparison, growth between 2020 and 2024 averaged around 45%.
European renewable hydrogen production capacity announced
Source: EY
In addition, regulatory rules for renewable hydrogen, such as strict temporal and geographical correlation requirements, increase development costs. Projects often require extra storage and grid adjustments.
Funding remains another bottleneck. Although the EU structured many subsidies and incentives, approval processes can take 12 to 24 months. These delays risk slowing deployment.
As of December 2024, about 60% of Europe’s renewable hydrogen production ambition was covered by national targets. Member states must better align policies and accelerate ramp-up if the EU hopes to meet 2030 goals.
A Fast-Growing Market
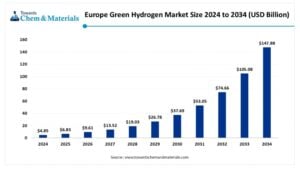
Despite challenges, market growth remains strong. The European green hydrogen market was valued at around $4.85 billion in 2024. Analysts expect it to reach nearly $147.88 billion by 2034. This implies a compound annual growth rate (CAGR) of about 40.7% between 2025 and 2034.
Several factors drive this expansion:
Rising demand for net-zero solutions
Decarbonization pressure on heavy industry
Expanding renewable energy capacity
Policy incentives and carbon pricing
By technology, alkaline electrolysers dominated the market in 2024, holding about 45% share. These systems remain cost-competitive and proven at scale.
Why This Project Matters
Moeve’s Andalusian Green Hydrogen Valley signals more than a single investment. It highlights three broader trends. First, capital is shifting from oil to clean infrastructure. Second, Europe is backing hydrogen with serious public funding. Third, Spain is emerging as a strategic clean energy exporter.
If executed successfully, Onuba could become a cornerstone of Europe’s hydrogen economy. More importantly, it shows that large-scale projects are moving from ambition to action. Thus, in a decade defined by energy transition, this €1 billion decision may mark a turning point for southern Europe’s clean industrial future.
https://globalcarbonfund.com/wp-content/uploads/2018/10/GCF_header_logo_340x156.png00carbonfundhttps://globalcarbonfund.com/wp-content/uploads/2018/10/GCF_header_logo_340x156.pngcarbonfund2026-03-09 10:14:422026-03-09 10:14:42Moeve, Masdar, and Enalter Partner on Southern Europe’s Largest Green Hydrogen Project
Vistra Corp. (NYSE: VST) closed 2025 with strong operational and financial momentum. Headquartered in Irving, Texas, the Fortune 500 power producer operates one of the largest competitive electricity portfolios in the United States.
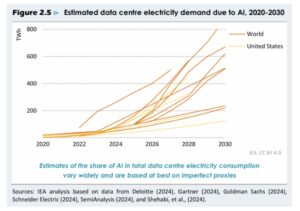
Last year, the company expanded its fleet, strengthened long-term partnerships, and delivered record operational performance. At the same time, it positioned itself to benefit from rising electricity demand driven by data centers, electrification, and AI growth.
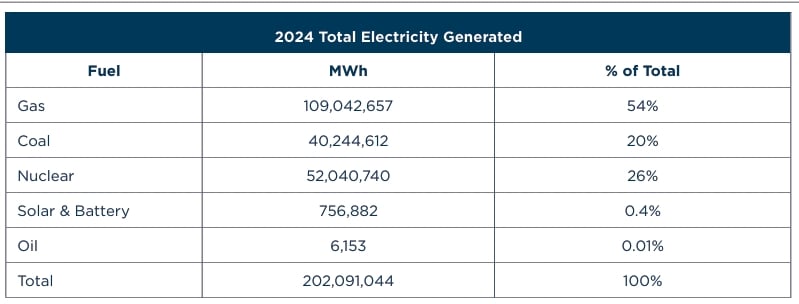
It now owns and operates roughly 44,000 megawatts (MW) of generation capacity across natural gas, nuclear, coal, solar, and battery storage assets. That capacity can power about 22 million homes.
Financial Performance Shows Underlying Strength
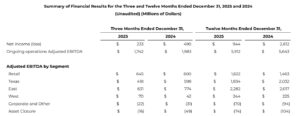
For the year ended December 31, 2025, Vistra reported GAAP net income of $944 million. This figure included an $808 million unrealized pre-tax loss from commodity hedges expected to settle in future years.
Source: Vistra
Although net income declined compared to 2024, the drop mainly reflected accounting impacts from rising forward power prices. Higher forward prices typically increase the long-term value of Vistra’s generation portfolio. As a result, the underlying business remains strong.
Ongoing Operations Adjusted EBITDA reached $5.9 billion, up $269 million year over year. Stronger retail margins and contributions from newly acquired assets supported the increase. Cash flow from operations totaled $4.07 billion, reinforcing liquidity and balance sheet strength.
2026 Expectations
For 2026, Vistra expects its adjusted EBITDA to range between $6.8 billion and $7.6 billion, while its adjusted free cash flow before growth is projected between $3.93 billion and $4.73 billion.
Importantly, these projections exclude potential impacts from the pending Cogentrix acquisition and recently signed nuclear agreements.
Meta and Amazon Anchor Vistra’s Nuclear Growth Strategy
The company operates the second-largest competitive nuclear fleet in the United States, providing steady, carbon-free baseload electricity that supports both grid reliability and corporate decarbonization goals.
In early 2026, the company signed 20-year power purchase agreements with Meta, covering more than 2,600 megawatts of nuclear energy across its PJM facilities. As Meta expands its AI capabilities and data center footprint, it needs dependable, around-the-clock power. These agreements secure long-term access to emissions-free electricity while giving Vistra predictable revenue streams.
Importantly, the structure of the contracts goes beyond traditional energy sales. They include capacity payments and plant uprates, allowing higher output from existing nuclear units. This approach improves asset efficiency for Vistra while ensuring price stability and supply certainty for Meta.
Vistra also strengthened its clean energy partnerships in Texas. Last year, it signed a separate 20-year agreement with Amazon Web Services for up to 1,200 megawatts of nuclear power from the Comanche Peak Nuclear Power Plant. The deal supports Amazon’s growing data operations with firm, carbon-free electricity and locks in long-term value for the company.
Together, these agreements reinforce the long-term viability of Vistra’s nuclear fleet. Long-term license renewals for the PJM units extend the life of critical zero-carbon infrastructure and strengthen grid reliability. At the same time, they position Vistra to meet rising corporate demand for clean, dependable power in the AI-driven economy.
Source: IEA
Expanding Solar and Natural Gas
Vistra also commissioned the 200-MW Oak Hill Solar Facility on a reclaimed coal mine site. The project includes a PPA with AWS, expanding the clean energy collaboration.
In November 2025, it closed a 2,600-MW acquisition from Lotus Infrastructure Partners. Shortly after, it announced plans to acquire Cogentrix Energy, adding approximately 5,500 MW of gas-fired capacity. The transaction is expected to close in mid-to-late 2026.
Additionally, it has also begun construction on two new gas units totaling 860 MW at its Permian Basin plant, effectively tripling that site’s capacity. In addition, it executed uprates across its Texas gas fleet to increase efficiency and output.
These investments reflect a balanced approach. As renewable penetration increases, flexible gas generation helps stabilize the grid and manage peak demand.
Advancing Emissions Reduction Goals
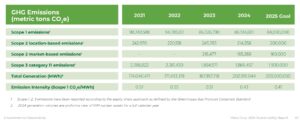
Vistra’s Scope 1 greenhouse gas emissions declined for the third consecutive year in 2024, primarily due to reduced coal generation. Scope 1 includes carbon dioxide, methane, and nitrous oxide, with carbon dioxide representing the largest share.
The company targets a 60% reduction in Scope 1 and 2 emissions by 2030 compared to 2010 levels. It also aims to achieve net-zero emissions by 2050.
Corporate sustainability efforts extend beyond generation. The company’s headquarters operates on 100% Green-e Wind renewable energy certificates. Nuclear-based emissions-free energy certificates also support fleet electricity usage. Together, these certificates covered more than 30% of corporate electricity consumption in 2024.
Source: Vistra
Positioned for Long-Term Value Creation
Vistra enters 2026 with strong momentum. Long-term nuclear PPAs with Meta and Amazon, expanded gas capacity, disciplined hedging, and growing renewable assets provide earnings visibility.
As electricity demand rises from AI, electrification, and digital infrastructure, companies with scale and reliability will benefit. Vistra’s integrated model of combining retail operations, nuclear baseload, flexible gas assets, and renewables positions it to capture that growth.
With projected EBITDA exceeding $7 billion in 2026 and potential upside from acquisitions, Vistra is not only adapting to the evolving energy market. It is actively shaping its future.
https://globalcarbonfund.com/wp-content/uploads/2018/10/GCF_header_logo_340x156.png00carbonfundhttps://globalcarbonfund.com/wp-content/uploads/2018/10/GCF_header_logo_340x156.pngcarbonfund2026-03-09 10:14:412026-03-09 10:14:41Vistra Leverages Nuclear Partnerships with Meta and Amazon to Drive 2026 Growth
Disseminated on behalf of Surge Battery Metals Inc.
lithium Price Analysis Today
Lithium prices trended higher today, supported by tightening supply fundamentals. The gains were primarily driven by reports of weather-related production disruptions in Chile and ongoing permitting delays impacting Australian mining operations. Analysts also highlighted a continuing inventory drawdown, which has begun to squeeze spot availability. These supply-side constraints are providing a floor for prices, offsetting broader market volatility and reinforcing the recovery in battery metal valuations.
Electric vehicles (EVs) are central to the global shift away from fossil fuels. EV sales continue to rise each year. Analysts estimate that global lithium demand may grow to over 2.8 million tonnes of lithium carbonate equivalent (LCE) by 2030 as EVs and grid storage expand.
Battery energy storage systems (BESS) are another major source of demand. Shipments of stationary storage batteries are forecast to grow around 50% in 2025, driven by renewable energy and grid needs.
Growth in both EVs and energy storage is pushing demand for lithium and other battery minerals higher. Many forecasts suggest lithium demand could more than triple by 2030 versus today’s levels.
Source: Surge Battery Metals
These trends are visible in price movements. Lithium prices have risen sharply in recent years. They might hit high levels if demand keeps exceeding supply growth.
Despite some volatility in the market, long-term demand remains robust because EVs and BESS use large amounts of lithium per unit. Cell chemistries like lithium-iron-phosphate (LFP) are expanding, further increasing lithium use across applications.
Tight Supply, Rising Risk: The Global Lithium Bottleneck
Global lithium supply is strained by rapid growth in demand. Supply forecasts have shifted from a modest surplus in 2024 to potential deficits as early as the mid-2020s.
BESS is a key factor. It could account for 30–36% of total lithium demand by 2030, according to major banking forecasts.
At the same time, much of the world’s lithium refining and battery production capacity remains concentrated outside the U.S., especially in China. This concentration raises supply chain risks for North American manufacturers and automakers.
Domestic supply development has not kept pace with demand. Historically, the U.S. produced only a small fraction of the total lithium supply, even though it sits on large known lithium resources.
These factors have pushed companies and governments to speed up new projects and improve local production skills.
Federal Strategy: Building a Domestic Supply Chain
The U.S. government has passed several policies to strengthen the EV supply chain and domestic critical minerals base. Key federal actions include incentives, regulations, and strategic planning. These efforts involve several agencies, like the Department of Energy (DOE) and the Department of Defense (DoD).
Programs like the Inflation Reduction Act (IRA) provide tax incentives for EV manufacturing and battery production. These incentives emphasize sourcing from the U.S. and allied countries to reduce reliance on foreign supply chains. The DOE also funds energy storage research, materials processing, and efforts to scale domestic industrial capacity.
TheFY26 National Defense Authorization Act (NDAA) includes provisions that support critical materials production and supply chain resilience in the defense sector. It broadens the Defense Industrial Base Fund’s authority. Now, it includes support for domestic production and modernization projects, including batteries and related infrastructure.
The law sets rules on buying certain key minerals and advanced batteries from non-allied foreign sources. Over a phased timeline, DoD must avoid sourcing these materials from “foreign entities of concern,” such as those linked to China and other designated countries. They must expedite the qualification of compliant domestic and allied suppliers.
The NDAA also requires the Department of Defense to assess weaknesses in key material supply chains. It promotes programs for stockpiling, recycling, and reuse to reduce reliance on imports. These federal actions support U.S. projects that provide lithium, nickel, and other battery materials. They boost confidence for investors and the industry in the domestic supply chain.
Inside the Battery Metals Economy
Lithium’s role in the EV supply chain is clear: it is a core input for lithium-ion batteries. Long-term demand forecasts for lithium reflect this central position. Some market forecasts project global lithium demand to rise to 3–4 million tonnes LCE by 2030, depending on EV market growth assumptions.
Price forecasts vary but generally reflect tightening supply. Some analysts estimate lithium prices could continue to rise if supply fails to match demand growth. Lithium carbonate spot prices recently jumped to $24,086, a 191%+ increase from July 2025.
Nickel and cobalt remain important for certain battery chemistries, even as some EV makers move toward low-cobalt or cobalt-free chemistries. All these metals are part of the broader battery metals ecosystem that underpins the EV supply chain.
Beyond EVs, electric grid storage, industrial batteries, and portable electronics all contribute to long-term demand. Even conservative estimates show sustained growth in battery-grade materials over the coming decade.
Nevada’s Lithium Anchor: NILI and Its Role in the U.S. Supply Chain
Surge Battery Metals (TSX-V: NILI; OTCQX: NILIF; FRA: DJ5) stands out as a lithium exploration and development company focused on the Nevada North Lithium Project (NNLP).
NNLP hosts one of the highest-grade lithium clay resources in the United States. Its inferred resource of approximately 11.2 million tonnes of LCE at an average grade above 3,000 ppm positions it well above many domestic peers.
This high quality makes the resource attractive for future development. A Preliminary Economic Assessment (PEA) indicates strong economics. It shows a net present value of about US$9.2 billion and an internal rate of return of over 22%. This reflects the project’s strong potential.
The project’s operating cost metrics are also competitive, with estimated costs significantly lower than those of many North American rivals.
NNLP’s shallow geology and proximity to infrastructure help keep capital and processing costs down. The project sits near power lines, highways, and existing mining hubs in Nevada.
Recent drilling programs continue to show promising results. In 2025, the focus was on infill drilling and core sampling. These efforts aim to upgrade resources and prepare for prefeasibility work. Results show thick lithium clay layers, which boost confidence in the project’s size and consistency.
More recently, Surge reported additional strong drill results from Nevada North. The company announced a 31-meter intercept grading 4,196 ppm lithium from surface in a 640-meter step-out hole to the southeast. This step-out extends mineralization about 640 meters beyond the current resource footprint, confirming the strong continuity of high-grade lithium.
The intercept grade is well above the project’s current average resource grade of about 3,000 ppm lithium. Near-surface mineralization also reduces stripping requirements and supports efficient future development. These results strengthen the project’s scale and reinforce its role as a growing domestic lithium source.
Source: Surge Battery Metals
Surge has also secured strategic partnerships. A joint venture with Evolution Mining will speed up exploration and development. This partnership will increase land holdings by over 21,000 acres of promising land.
The company has been recognized for performance in the market, including being named a Top 50 performer on the TSX Venture Exchange in 2024.
Surge Battery Metals plans to improve metallurgical testing for lithium chemicals with over 99% purity. This will help supply battery makers and energy storage companies with high-quality products.
Its management team brings both industry and policy experience, including executives with track records in lithium development and the energy sectors.
Live Nickel Spot Price
Unit: USD/kg
—
—
Loading Chart…
https://globalcarbonfund.com/wp-content/uploads/2018/10/GCF_header_logo_340x156.png00carbonfundhttps://globalcarbonfund.com/wp-content/uploads/2018/10/GCF_header_logo_340x156.pngcarbonfund2026-03-06 12:14:462026-03-06 12:14:46The U.S. EV Supply Chain Race: Where Surge Battery Metals Fits in the National Critical Minerals Strategy