Copper Price Hits All-Time High as AI, Grid Demand and Supply Risks Fuel Rally

Copper has hit another record high as supply disruptions, tight inventories and growing demand from artificial intelligence (AI), power grids and electrification push the metal deeper into record territory. Three-month copper futures on the London Metal Exchange (LME) reached $14,728 per metric ton on September 8. September Comex copper also touched a record $6.739 per pound. LME copper has gained nearly 18% in 2026.  The rally is being driven by both short-term supply concerns and a deeper problem: the world may not be developing enough new copper mines to meet future demand. AI is adding to that pressure, but it is only one part of the story. Power grids, electric vehicles, renewable energy and other infrastructure are also increasing copper demand. US Tariff Fears Tighten Global Supply A major factor behind the latest copper price rally is uncertainty over US trade policy. Washington has already imposed tariffs on some copper products and has considered further measures. A 2025 presidential proclamation directed the Commerce Department to assess whether a 15% tariff on refined copper from January 1, 2027, rising to 30% in 2028, would be warranted. That possibility has changed global trade flows. Traders have moved more copper into the United States ahead of potential tariffs. This has increased US inventories while reducing available stocks in other major markets. The result is a split market. Copper may be sitting in US warehouses, but other regions can still face tighter supplies. That can push copper prices higher as buyers compete for metal that is available outside the US. Global Mine Supply Is Starting to Crack The physical supply picture is also supporting prices. The International Copper Study Group (ICSG) reported that global copper mine production fell 1.1% in the first half of 2026. Copper concentrate output fell 2.6%. Declines in major producing countries, including Chile, Indonesia and the Democratic Republic of Congo, outweighed gains elsewhere.  Source: Bloomberg Chile shows the scale of the problem. Codelco, the world's largest copper producer, reported first-half 2026 production of 564,000 metric tons, down 11% from 634,000 tons a year earlier. Lower output was linked mainly to operational restrictions at its El Teniente mine, along with declines at other operations.  The wider mining industry faces structural limits, too. The International Energy Agency says average copper ore grades have fallen 40% since 1991, while average capital intensity for expanding existing projects has risen 65% since 2020. New copper projects also take about 17 years on average from discovery to production.  That makes the current supply shortage difficult to fix quickly. AI Adds Fuel to Copper’s Demand Boom AI has become a new source of copper demand. Data centers use copper in electrical systems, power distribution, cooling equipment, and connections. But their bigger impact comes from the new power infrastructure needed to support them. The IEA expects global data center electricity use to reach about 945 terawatt-hours (TWh) by 2030, roughly double the 2024 level. Electricity demand from accelerated servers, driven mainly by AI, is expected to grow by around 30% per year in the agency’s base case.  BHP estimates that each additional $200 billion in annual data center investment could require the equivalent of a new 150,000-ton-per-year copper mine to support computer hardware and power infrastructure. It also expects copper demand tied to data centers to rise about sixfold between 2024 and 2050, reaching around 3 million tons per year.  Still, AI is not the only demand driver. SEE MORE: Why Copper Could Be One of the Biggest Commodity Bets of the AI Era Electrification Makes Copper a Critical Energy Metal Copper is essential to the broader energy transition. It is widely used in transmission lines, transformers, electric vehicles, charging networks, renewable power systems, and battery storage. The IEA estimates that clean energy demand for copper could increase from 7.7 million tons in 2024 to 10.9 million tons in 2030 and 12.2 million tons in 2040 under its Stated Policies Scenario. Total copper demand could reach 34.1 million tons by 2040.  That creates a direct link between copper markets and decarbonization. Copper is not a carbon credit or a carbon removal asset. However, it is a critical material for technologies that can reduce emissions. Grid expansion, renewable power and vehicle electrification all depend on reliable copper supply. If copper shortages delay those projects, they could also slow the pace of emissions reductions. The Supply Gap Could Get Much Larger The biggest concern is not only today's shortage but the potential gap later this decade and beyond. The IEA's Global Critical Minerals Outlook 2026 projects a 25% copper supply deficit by 2035 based on the current pipeline of announced projects.  S&P Global sees an even larger risk. Its 2026 study estimates global copper demand will rise from about 28 million tons in 2025 to 42 million tons in 2040, a 50% increase. Without enough new supply, the market could face a potential 10 million-ton annual shortfall by 2040.   The drivers go well beyond AI. S&P points to traditional economic growth, the energy transition, data centers, and defense infrastructure as major sources of future demand. That makes copper one of the most important physical constraints for the global energy and digital buildout. Recycling Can Help, But Not Fast Enough Recycling can help, but it cannot solve the problem by itself. The IEA says available copper scrap could rise from about 16 million tons today to 19 million tons in 2030 and 27 million tons by 2050 under its Accelerated Policy Scenario.  Copper is highly recyclable, but much of the metal installed today remains in long-lived products and infrastructure. That limits how much scrap can return to the market in the near term. New mines will therefore remain necessary as electricity networks, data centers and clean energy infrastructure expand. At the same time, mining companies face declining ore grades, higher development costs and long permitting timelines. Record Prices Could Finally Unlock New Mines Record prices should improve the economics of new copper projects and encourage more recycling. However, high prices alone cannot solve a supply problem that has been building for years. S&P Global estimates that 2025 copper prices were high enough to make only about 60% of identified new projects potentially profitable.  That highlights the challenge. Even when copper prices rise sharply, some deposits may still be too expensive or difficult to develop. The market therefore needs both higher investment and faster project development. Copper’s Rally Has More Than AI Behind It Copper's latest record is partly linked to US tariff fears and changing inventory flows. Yet, the underlying story is much broader. Mine production fell in the first half of 2026. Major producers are facing operational problems. At the same time, AI infrastructure, grid investment, electric vehicles and renewable energy are creating new demand. The IEA expects a major supply deficit by 2035, while S&P Global sees the potential for a 10 million-ton annual shortfall by 2040 without significant new investment. That does not mean copper prices can only rise. High prices can weaken demand, encourage recycling and accelerate new investment. Yet, the structural trend is clear: the global economy is becoming more dependent on copper at the same time that new supply is becoming harder and slower to develop. For the energy transition, that makes copper more than an industrial commodity. It is becoming a critical material that could help determine how quickly the world can build cleaner power systems and the infrastructure needed to reduce emissions. READ MORE: Copper Prices Surge Past $14,800: Will New Mines Help Ease the Supply Crunch?

Copper price has hit another record high as supply disruptions, tight inventories and growing demand from artificial intelligence (AI), power grids and electrification push the metal deeper into record territory.

Three-month copper futures on the London Metal Exchange (LME) reached $14,728 per metric ton on September 8. September Comex copper also touched a record $6.739 per pound. LME copper has gained nearly 18% in 2026. 

The rally is being driven by both short-term supply concerns and a deeper problem: the world may not be developing enough new copper mines to meet future demand. AI is adding to that pressure, but it is only one part of the story. Power grids, electric vehicles, renewable energy and other infrastructure are also increasing copper demand.

copper price

US Tariff Fears Tighten Global Supply

A major factor behind the latest copper price rally is uncertainty over US trade policy. Washington has already imposed tariffs on some copper products and has considered further measures.

A 2025 presidential proclamation directed the Commerce Department to assess whether a 15% tariff on refined copper from January 1, 2027, rising to 30% in 2028, would be warranted. That possibility has changed global trade flows.

Traders have moved more copper into the United States ahead of potential tariffs. This has increased US inventories while reducing available stocks in other major markets.

The result is a split market. Copper may be sitting in US warehouses, but other regions can still face tighter supplies. That can push copper prices higher as buyers compete for metal that is available outside the US.

Global Mine Supply Is Starting to Crack

The physical supply picture is also supporting prices. The International Copper Study Group (ICSG) reported that global copper mine production fell 1.1% in the first half of 2026. Copper concentrate output fell 2.6%. Declines in major producing countries, including Chile, Indonesia and the Democratic Republic of Congo, outweighed gains elsewhere. 

copper mine supply
Source: Bloomberg

Chile shows the scale of the problem. Codelco, the world’s largest copper producer, reported first-half 2026 production of 564,000 metric tons, down 11% from 634,000 tons a year earlier. Lower output was linked mainly to operational restrictions at its El Teniente mine, along with declines at other operations. 

The wider mining industry faces structural limits, too.

The International Energy Agency says average copper ore grades have fallen 40% since 1991, while average capital intensity for expanding existing projects has risen 65% since 2020. New copper projects also take about 17 years on average from discovery to production. 

That makes the current supply shortage difficult to fix quickly.

AI Adds Fuel to Copper’s Demand Boom

AI has become a new source of copper demand. Data centers use copper in electrical systems, power distribution, cooling equipment, and connections. But their bigger impact comes from the new power infrastructure needed to support them.

The IEA expects global data center electricity use to reach about 945 terawatt-hours (TWh) by 2030, roughly double the 2024 level. Electricity demand from accelerated servers, driven mainly by AI, is expected to grow by around 30% per year in the agency’s base case. 

BHP estimates that each additional $200 billion in annual data center investment could require the equivalent of a new 150,000-ton-per-year copper mine to support computer hardware and power infrastructure. It also expects copper demand tied to data centers to rise about sixfold between 2024 and 2050, reaching around 3 million tons per year. 

copper demand in data centers 2030 IEA

Still, AI is not the only demand driver.

SEE MORE: Why Copper Could Be One of the Biggest Commodity Bets of the AI Era

Electrification Makes Copper a Critical Energy Metal

Copper is essential to the broader energy transition. It is widely used in transmission lines, transformers, electric vehicles, charging networks, renewable power systems, and battery storage.

The IEA estimates that clean energy demand for copper could increase from 7.7 million tons in 2024 to 10.9 million tons in 2030 and 12.2 million tons in 2040 under its Stated Policies Scenario. Total copper demand could reach 34.1 million tons by 2040. 

That creates a direct link between copper markets and decarbonization.

Copper is not a carbon credit or a carbon removal asset. However, it is a critical material for technologies that can reduce emissions. Grid expansion, renewable power and vehicle electrification all depend on reliable copper supply.

If copper shortages delay those projects, they could also slow the pace of emissions reductions.

The Supply Gap Could Get Much Larger

The biggest concern is not only today’s shortage but the potential gap later this decade and beyond. The IEA’s Global Critical Minerals Outlook 2026 projects a 25% copper supply deficit by 2035 based on the current pipeline of announced projects. 

S&P Global sees an even larger risk. Its 2026 study estimates global copper demand will rise from about 28 million tons in 2025 to 42 million tons in 2040, a 50% increase. Without enough new supply, the market could face a potential 10 million-ton annual shortfall by 2040.  

copper market balance supply and demand s&p

The drivers go well beyond AI. S&P points to traditional economic growth, the energy transition, data centers, and defense infrastructure as major sources of future demand. That makes copper one of the most important physical constraints for the global energy and digital buildout.

Recycling Can Help, But Not Fast Enough

Recycling can help, but it cannot solve the problem by itself. The IEA says available copper scrap could rise from about 16 million tons today to 19 million tons in 2030 and 27 million tons by 2050 under its Accelerated Policy Scenario. 

Copper is highly recyclable, but much of the metal installed today remains in long-lived products and infrastructure. That limits how much scrap can return to the market in the near term.

New mines will therefore remain necessary as electricity networks, data centers and clean energy infrastructure expand. At the same time, mining companies face declining ore grades, higher development costs and long permitting timelines.

Record Prices Could Finally Unlock New Mines

Record prices should improve the economics of new copper projects and encourage more recycling. However, high prices alone cannot solve a supply problem that has been building for years.

copper prices

S&P Global estimates that 2025 copper prices were high enough to make only about 60% of identified new projects potentially profitable.  That highlights the challenge. Even when copper prices rise sharply, some deposits may still be too expensive or difficult to develop.

The market therefore needs both higher investment and faster project development.

Copper’s Rally Has More Than AI Behind It

Copper’s latest record is partly linked to US tariff fears and changing inventory flows. Yet, the underlying story is much broader.

Mine production fell in the first half of 2026. Major producers are facing operational problems. At the same time, AI infrastructure, grid investment, electric vehicles and renewable energy are creating new demand.

The IEA expects a major supply deficit by 2035, while S&P Global sees the potential for a 10 million-ton annual shortfall by 2040 without significant new investment. That does not mean copper prices can only rise. High prices can weaken demand, encourage recycling and accelerate new investment.

Yet, the structural trend is clear: the global economy is becoming more dependent on copper at the same time that new supply is becoming harder and slower to develop.

For the energy transition, that makes copper more than an industrial commodity. It is becoming a critical material that could help determine how quickly the world can build cleaner power systems and the infrastructure needed to reduce emissions.

The post Copper Price Hits All-Time High as AI, Grid Demand and Supply Risks Fuel Rally appeared first on Carbon Credits.

Is the Cheap Carbon Credit Era Coming to an End?

Carbon credit prices have been under pressure for several years, but the long-term outlook for the voluntary carbon market (VCM) could be very different.

Patch’s A Buyer’s Guide to Carbon Credits points to a potential turning point. The report argues that demand for high-quality carbon credits could eventually outpace available supply, creating upward pressure on prices as companies move closer to net-zero targets.

The market has already experienced a major correction. But the forces that could drive the next phase are beginning to look different.

For buyers, the question may soon shift from how cheaply they can purchase carbon credits to whether they can secure enough high-quality credits at all.

Why Carbon Credit Prices Collapsed After the VCM Boom

The voluntary carbon market experienced explosive growth in 2021. According to Patch, the market quadrupled year over year that year, reaching about $2 billion. At the time, forecasts suggested the VCM could grow to between $10 billion and $40 billion by 2030.

Instead, demand weakened sharply.

  • Carbon credit purchases and retirements fell to around 155 million credits in 2022 from 161 million in 2021, a decline of roughly 4%.

Unlocking the Triggers 

Concerns over credit quality were a major factor. High-profile investigations into some Verra REDD+ projects raised questions about whether certain credits delivered the climate benefits claimed by project developers.

The collapse of the crypto market added another layer of pressure. Crypto investors had poured significant capital into carbon credits during the market’s boom, and their retreat contributed to weaker demand.

Nature-based credits were especially vulnerable. Patch noted that the supply of REDD+ credits fell by 32%, yet buyers remained hesitant. Average prices for nature-based credits subsequently dropped below $2.

Carbon credits

Note: In this market, three primary types of offsets are traded – NGEO, GEO (General Emissions Offsets), and CGEO (Certified Global Emissions Offsets).

The correction exposed a fundamental weakness in the VCM. Much of the demand was behavioral and highly sensitive to price, market sentiment, and concerns over corporate climate claims.

But Patch argues that this is unlikely to define the market forever.

Carbon Credit Supply Could Fall Behind Future Demand

One of the most important findings in Patch’s report is the growing gap between investment in future carbon-credit supply and current market sales.

The report cites Trove Research, which estimated that capital investment in carbon-credit projects was about five times greater than overall carbon-credit sales.

In 2022, the primary market, based on retired credits, was worth approximately $1.5 billion. Capital investment in projects, meanwhile, reached around $7.5 billion.

That imbalance is significant.

It suggests that investors and project developers were committing substantial capital to creating future carbon-credit supply despite relatively weak demand at the time.

The bigger question is whether that future supply will be enough.

Patch cited Trove Research projections showing that demand could exceed supply by 2030 even under lower-demand scenarios. Under a pathway consistent with limiting warming to 1.5°C, the imbalance could emerge earlier.

This could create a very different market environment from the one that produced today’s low prices.

If demand accelerates faster than new projects can deliver credible credits, buyers could find themselves competing for a limited supply.

carbon credits VCM
Source: Patch

Carbon Credit Demand Could Become Less Price-Sensitive

Patch separates carbon-credit demand into two broad categories: behavioral demand and fundamental demand.

Behavioral demand tends to respond quickly to market conditions. Companies may reduce purchases when credit prices rise, economic conditions deteriorate, or concerns about the credibility of offsets increase.

Fundamental demand is more structural.

It comes from companies that have made public climate commitments and eventually need to address emissions that cannot be eliminated through internal reductions alone.

That distinction could become increasingly important as corporate net-zero deadlines approach.

The cost of eliminating the final portion of emissions can be considerably higher than reducing emissions through easier efficiency or clean-energy measures. This is particularly relevant for difficult-to-abate sectors such as aviation, shipping and heavy industry.

As a result, carbon credits could become less discretionary.

Could Carbon Credit Prices Reach $150 by 2035?

Companies may eventually have fewer options for addressing residual emissions, making their demand less sensitive to price.

Patch cited EY Net Zero Centre projections that put carbon prices between $80 and $150 by 2035 across different climate scenarios.

That is far above the prices currently seen across much of the voluntary market.

The key point is not that every carbon credit will reach those levels. Rather, it illustrates how dramatically prices could change if structural climate demand begins to outweigh short-term buyer sentiment.

carbon credit prices
Source: Patch

High-Quality Carbon Credits Are Already Commanding a Premium

Recent data from Sylvera offers an important update to Patch’s longer-term outlook.

The latest figures suggest that buyers are already becoming more selective about where they spend their carbon budgets.

  • In Q2 2026, carbon credit retirements reached 38.55 million, down 10% from the same quarter a year earlier. First-half retirements stood at 89.27 million, also below the previous year’s level.

On the surface, declining retirement volumes could suggest that demand remains weak.

However, pricing tells a more complicated story.

carbon credit prices
Source: Sylvera

Buyers Are Shifting Toward Better Credits

Sylvera’s Q1 2026 data showed that average carbon credit prices increased to $5.69 from $5.60 despite an 8% decline in retirement volumes. Investment-grade BBB+ credits commanded an average price of $20.10, up from $18.10.

The pattern is important because it shows that the market is not moving uniformly.

Buyers may be purchasing fewer credits overall while allocating more money toward credits they consider higher quality.

Sylvera’s 2025 data reinforces the trend. Carbon credit retirements declined 4.5% to 168 million, but the market’s total value increased 6% to $1.04 billion.

High-quality BB+ credits also increased their share of retirements from 44% to 50% and accounted for 70% of total spending.

The market is therefore becoming increasingly differentiated.

Lower-quality or oversupplied credits can remain cheap, while scarce credits that meet stronger integrity expectations can command substantial premiums.

carbon credit prices
Source: Sylvera

Why Buyers May Need to Lock In Carbon Credits Early

Patch’s analysis makes a strong case for buyers to think beyond today’s spot prices.

Long-term carbon-credit purchase agreements can provide companies with greater certainty around future volumes and pricing. At the same time, they give project developers the revenue visibility needed to secure financing and expand their operations.

This could be particularly important for carbon removal.

New removal projects often require significant upfront investment and can take years to develop. If corporate demand accelerates before enough projects reach commercial scale, buyers could face a shortage of available supply.

Early purchasing can therefore serve two purposes.

It can protect buyers from potential future price increases while also helping developers build the supply needed to meet future demand.

However, locking in supply does not mean simply buying the cheapest credits available.

The market’s experience over the past several years has demonstrated why quality matters. Questions around additionality, permanence, measurement, verification, and project-level risks can significantly affect the long-term value of a credit.

The objective should be to secure credible supply at a price that remains attractive against potentially higher future costs.

The Carbon Market Is Splitting Into Two Price Tiers

Patch’s report was produced during a period when the VCM was dealing with a major credibility and demand crisis. The latest market data suggests that the market is not disappearing. Instead, it is becoming more selective.

Overall demand remains uneven, but spending is increasingly concentrated in higher-quality credits.

That could eventually produce a two-tier market.

Lower-quality and oversupplied credits could continue trading at relatively low prices. Meanwhile, high-integrity reduction and removal credits could become increasingly expensive as buyers compete for limited supply.

This distinction is critical for companies planning long-term climate strategies.

Patch’s central argument remains compelling: companies that wait until carbon-credit demand becomes urgent could face tighter availability and higher prices.

Those that secure credible long-term supply earlier may have greater control over both cost and access.

The voluntary carbon market has already shown how quickly prices and buyer sentiment can change.

The next major shift could come from the opposite direction. As corporate climate commitments become more difficult to defer and emissions reductions become increasingly expensive at the margin, fundamental demand could begin to dominate behavioral demand.

CARBON CREDITS MARKET

The bottom line is, if that happens, the biggest risk for carbon-credit buyers may no longer be paying too much.

It could be not having enough high-quality credits to buy.

The post Is the Cheap Carbon Credit Era Coming to an End? appeared first on Carbon Credits.
Microsoft Signs Long-Term PPA for Cypress Creek’s 104 MW Washington Solar Project

Cypress Creek Energy has brought its new Ostrea Solar project online in Washington state, adding 104 MWdc of solar capacity to a region facing rapidly rising electricity demand.

The $180 million project in Yakima County is backed by a long-term power purchase agreement (PPA) with Microsoft (MSFT Stock). The technology giant will purchase electricity and environmental products generated by the facility, making it the project’s long-term offtaker.

Ostrea Solar is the latest example of how large technology companies are using long-term clean energy contracts to secure renewable power while supporting new generation capacity.

The project began commercial operations as Washington’s economy continues to expand. According to Cypress Creek, the state recorded annualized real GDP growth of 4.5% in the first quarter of 2026, more than twice the national rate. The information sector was one of the main contributors, highlighting the growing relationship between Washington’s technology economy and electricity demand.

Microsoft Backs New Washington Solar Capacity

Ostrea Solar is connected to the Bonneville Power Administration transmission system and provides 80 MWac of generation capacity to the regional grid.

ostrea solar cypress creek
Source: Cypress Creek Energy

Microsoft’s agreement covers both the electricity and environmental products produced by the facility. While the company has been expanding its renewable energy procurement across the U.S., projects such as Ostrea are particularly important because they add new generation rather than simply relying on existing clean power.

The timing is significant. Electricity consumption is rising as technology companies, data centers and other businesses expand their operations. More power generation and transmission infrastructure will be needed to meet that demand while supporting Washington’s broader economic growth.

Cypress Creek CEO Kevin Smith said the project demonstrates how new power capacity can be developed while also creating benefits for local communities and protecting the land around energy projects.

The project represents a private investment of approximately $180 million in Washington’s energy infrastructure.

U.S. Solar Capacity Continues to Climb

Ostrea is entering a U.S. solar market that has expanded rapidly over the past decade.

  • The U.S. had about 225.6 GW of estimated solar photovoltaic capacity by June 2026, including utility-scale and small-scale systems, according to the U.S. Energy Information Administration.

Solar is also expected to remain a major source of new U.S. electricity capacity. The EIA expects solar to account for 51% of planned utility-scale generating capacity additions in 2026. Developers are expected to add another 86 GW of total utility-scale capacity this year if all planned projects are completed.

US solar

The growing solar fleet is already having an impact on electricity generation. Utility-scale solar generation increased 34% in 2025, while small-scale solar generation rose 11%, according to the EIA.

Projects such as Ostrea therefore fit into a much larger shift in the U.S. power market, where renewable generation is increasingly being built to serve utilities and large corporate customers.

Cypress Creek Prioritizes Land Conservation at Ostrea Solar

Cypress Creek says Ostrea was developed with land management and environmental protection as key priorities.

During development, the company worked with Washington’s Energy Facility Site Evaluation Council and the Washington Department of Fish and Wildlife. The project design was modified to conserve about 275 acres of shrubsteppe habitat.

Shrubsteppe is an important ecosystem in Washington, supporting a range of plants and wildlife. Much of the state’s historic shrubsteppe has been lost or degraded because of agriculture and development.

Ostrea also includes wildlife corridors intended to preserve movement through the project area. Those corridors can help species such as Rocky Mountain elk continue to move across the landscape.

Land restoration is another part of the project’s environmental strategy.

Some areas of the site were formerly used as cropland but had not been actively farmed for more than two decades. Invasive and non-native vegetation had taken hold in parts of the property.

land conservation
Source: Cypress Creek Energy

Promising Long-Term Stewardship

During construction, Cypress Creek removed invasive plants and restored disturbed areas. The company then planted a mix of grasses and flowering species designed to support native vegetation and pollinators.

The approach highlights a broader issue facing utility-scale solar development. Solar facilities require land, but the entire project area is not covered by panels. Vegetation can remain beneath and around many solar arrays, allowing developers to combine electricity generation with land management.

Cypress Creek plans to own and operate Ostrea for up to 40 years. The company says its goal is to leave the property in good condition when the project’s operating life ends, preserving options for future land use.

$180 Million Investment Creates Local Economic Benefits

Beyond electricity generation, Ostrea is expected to provide a long-term economic contribution to Yakima County.

Cypress Creek estimates the project will generate approximately $13.3 million in state and local tax revenue over its operating life.

Construction was also a significant source of employment. About 300 jobs were created during the development and construction phase, with workers paid prevailing wages.

The project included an apprenticeship program designed to provide workers with experience in construction trades. Around 75 apprentices contributed approximately 39,000 hours to the project.

PCL Solar Constructors USA served as the engineering, procurement, and construction contractor.

Cypress Creek also reported that the project completed construction without a recordable injury or incident.

Community Investment Extends Beyond the Solar Site

The company has also made investments in the surrounding Yakima community.

Cypress Creek contributed $50,000 toward a new aquatic center at Martin Luther King Jr. Park in Yakima. It also participated in a back-to-school initiative at Moxee Elementary School with PCL.

Through its Energizing Tomorrow’s Leaders program, the company has provided scholarships to 14 Yakima County students since 2023. The scholarships represent $18,500 in educational support.

The company has also partnered with the Oregon Institute of Technology on scholarships and educational opportunities for students pursuing energy-related careers.

These initiatives are designed to extend the economic benefits of the project beyond construction and electricity generation.

Microsoft Links Renewable Energy to Rising Power Demand

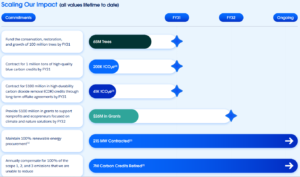
Microsoft already operates one of the largest corporate renewable energy portfolios globally. According to its sustainability reporting, it has 40 gigawatts (GW) of contracted capacity across 26 countries. This scale puts Microsoft among the world’s largest corporate buyers of clean electricity.

Its renewable energy strategy is increasingly tied to the growing electricity needs of digital infrastructure, particularly as data centers and artificial intelligence workloads expand.

microsoft clean energy
Data Source: Microsoft

Ostrea Shows the Next Phase of Solar Development

Ostrea combines corporate clean energy demand with private investment, job creation, land restoration, and long-term environmental management. Cypress Creek will operate and maintain the facility throughout its expected operating life, including its electricity generation, vegetation management, and land stewardship.

As U.S. solar capacity continues to expand, projects such as Ostrea show that renewable development is about more than adding panels. New projects will increasingly need to balance rising power demand with grid needs, environmental protection, and economic benefits for local communities.

The post Microsoft Signs Long-Term PPA for Cypress Creek’s 104 MW Washington Solar Project appeared first on Carbon Credits.
UK Recognizes India’s Carbon Scheme Under CBAM, Easing Exporters’ Carbon Costs

UK Recognizes India’s Carbon Scheme Under CBAM, Easing Exporters’ Carbon Costs

The UK has recognized India’s Carbon Credit Trading Scheme (CCTS) as a qualifying carbon pricing scheme under its upcoming Carbon Border Adjustment Mechanism (CBAM). The move could reduce the carbon cost faced by Indian exporters when the UK’s CBAM begins on January 1, 2027.

Under UK rules, qualifying carbon prices already paid on emissions embodied in imported goods may be taken into account when calculating the importer’s CBAM liability. This is designed to prevent the same emissions from being priced twice.

India’s CCTS now appears on the UK’s official list of qualifying overseas carbon pricing schemes. The list also includes the EU Emissions Trading System, China’s national ETS, Japan’s GX-ETS, Korea’s ETS, Singapore’s carbon tax and South Africa’s carbon tax.

The recognition is important for Indian companies selling carbon-intensive goods into the UK. However, it does not mean every Indian carbon credit will automatically reduce a CBAM bill. Importers must meet detailed UK rules on emissions data, carbon pricing and independent verification.

UK’s Carbon Border Tax Arrives in 2027

The UK CBAM will begin on January 1, 2027, covering imports of selected carbon-intensive products from the aluminium, cement, fertiliser, hydrogen, and iron and steel sectors.

The policy is designed to ensure that imported goods face a carbon cost broadly comparable with products made by UK manufacturers. One of its main goals is to reduce carbon leakage, where production moves to countries with weaker climate policies.

UK importers will generally need to register when they expect to import at least £50,000 of CBAM goods within the next 30 days. The threshold can also be assessed using imports during the previous 12 months. This means the system will mainly affect businesses with significant trade in covered products.

The UK government has also created a system for claiming Carbon Price Relief. This allows importers to reduce their CBAM liability where the relevant goods have already been subject to an eligible carbon price overseas.

India’s CCTS Can Reduce UK Carbon Costs

India’s inclusion on the UK’s qualifying list is important because its national carbon market is now moving into operation. Under the CCTS, India is developing a compliance mechanism for energy-intensive industries.

The government sets greenhouse gas emissions-intensity targets for covered businesses. Companies that perform better than their targets can receive Carbon Credit Certificates, while those that fall short may need certificates to meet their obligations.

INDIA CCTS
Source: Bicon Consultants

The scheme also includes an offset mechanism for eligible projects outside the obligated industrial sector. This framework covers activities that can generate emissions reductions or removals in areas such as energy, industry, agriculture, forestry, waste, transport and carbon capture, utilization and storage.

However, this distinction is critical for exporters. The UK’s CBAM relief is linked to qualifying carbon prices applied to the embodied emissions in imported goods. Simply purchasing a voluntary carbon credit does not automatically create a CBAM deduction.

The UK requires evidence showing that the relevant emissions were subject to a qualifying pricing scheme.

Carbon Data and Verification Will Make or Break Relief

The UK has placed strong emphasis on verification. To claim Carbon Price Relief, an importer must obtain a carbon pricing verification form from the relevant installation, factory, or supply chain.

The form must then be completed by an independent verifier that meets the UK’s requirements. Without the required documentation and verification, the importer cannot claim the relief. The amount of relief also depends on the actual carbon price and the emissions covered by that price.

Importers must calculate the effective carbon price and determine how much of the embodied emissions were subject to an eligible scheme. Any foreign currency relief must then be converted into pounds using UK-published exchange rates.

This makes accurate carbon accounting increasingly important for Indian exporters. Companies will need reliable data on how much CO2 they emit, how those emissions are measured and what carbon costs they have actually paid.

India Is Building a National Carbon Market

The UK’s decision comes as India moves from designing its carbon market toward implementation. India has established rules and procedures for its CCTS and is developing the systems needed to measure, report, and verify emissions and carbon projects.

The Bureau of Energy Efficiency (BEE) has also been working on the accreditation of independent carbon verification agencies. The agencies will play a key role in checking emissions and project claims under the Indian market.

india carbon market ccts
Source: lawrbit

The CCTS is part of India’s wider shift away from its earlier Perform, Achieve and Trade approach toward a national carbon market.

The timing is significant. India is developing its domestic carbon pricing system at almost the same time the UK is preparing to impose a carbon cost on certain imports. That creates a direct connection between domestic climate policy and international trade.

SEE MORE: India’s Carbon Market Portal Goes Live as Carbon Credit Trading Nears

Metals Could Face the Biggest Impact

The recognition could be particularly important for India’s steel and aluminium industries. Both sectors are covered by India’s carbon market framework and the UK CBAM. That gives producers in these industries a potential way to reduce their UK border carbon liability where qualifying domestic carbon prices have been paid, and the UK requirements are met.

The issue is becoming more important as trade between the two countries expands.

The UK-India Comprehensive Economic and Trade Agreement entered into force on July 15, 2026. UK government data shows that total trade between the two countries was worth about £48 billion in 2025.

The agreement provides tariff reductions across a wide range of products, with 99% of Indian goods entering the UK eventually benefiting from zero or reduced tariffs. But lower tariffs do not remove carbon-related costs.

For carbon-intensive products, exporters will have to consider both traditional trade costs and the new cost of embedded emissions under CBAM. Recognizing India’s carbon pricing system could help limit that additional burden.

Carbon Data Is Becoming Part of the Export Toolkit

The wider significance of the UK’s decision goes beyond the immediate tax benefit. Carbon information is increasingly becoming part of international trade. Exporters of covered products will need to understand:

  • the emissions generated during production,
  • how those emissions were calculated, and
  • whether a qualifying carbon price was paid.

The UK CBAM framework effectively turns this information into part of the import process.

For Indian manufacturers, that could encourage better emissions monitoring and reporting. It could also push companies to invest in cleaner production methods, because lower emissions can translate into lower carbon costs at the border.

This could create a growing competitive advantage for producers that can demonstrate lower emissions and strong carbon-accounting systems.

UK and EU Carbon Borders Point to a New Trade Era

The UK is not alone in linking carbon pricing with international trade. The European Union’s CBAM also allows a carbon price paid in the country of production to be taken into account when determining the border charge, provided it meets the EU’s rules.

EU cbam vs UK cbam
Source: KPMG

The UK has adopted a similar principle while creating its own calculation and verification framework. This suggests a wider trend: national carbon markets are becoming increasingly connected to global trade rules.

For exporters, carbon pricing is no longer only a domestic policy issue. It can affect whether products remain competitive in foreign markets.

The UK’s recognition of India’s CCTS is a relatively small regulatory step, but it could have a wider effect.

It gives Indian exporters in covered sectors a clearer path to claim relief where they have already paid an eligible domestic carbon price. At the same time, it gives India’s emerging carbon market an international dimension. Also, the decision reduces one important risk: double carbon pricing on the same emissions.

For Indian exporters, managing emissions is increasingly more than an environmental responsibility. It is also becoming an important part of managing trade costs and staying competitive in global markets.

The post UK Recognizes India’s Carbon Scheme Under CBAM, Easing Exporters’ Carbon Costs appeared first on Carbon Credits.

South Africa’s Power Sector Emissions Fall 19% as Renewables Gain Ground, Says BNEF

South Africa’s power sector is beginning to show signs of a structural shift as renewable energy expands and aging coal plants face growing pressure.

  • Power-sector emissions fell 19% in 2025 to 148 million metric tons of carbon dioxide (MtCO2), according to BloombergNEF’s South Africa Transition Factbook 2026. The decline marks the largest annual drop under BloombergNEF’s Economic Transition Scenario (ETS).

The reduction is particularly important because electricity generation remains one of South Africa’s biggest sources of carbon emissions. Coal continues to dominate the country’s power system, but its role is gradually shrinking as solar, wind and battery storage gain momentum.

However, South Africa’s energy transition is far from complete. The country must expand clean power while maintaining grid reliability, replacing aging coal capacity and building enough transmission infrastructure to connect new renewable projects.

South Africa’s Power-Sector Emissions Face a Long Decline

The emission reduction came despite a slight increase in coal generation. Coal output rose about 1% as newer Kusile units improved the efficiency of the coal fleet. At the same time, electricity generation from oil-fired plants, including Acacia and Port Rex, declined.

The development highlights an important feature of South Africa’s transition. Improving the efficiency of existing generation can lower emissions even before large amounts of coal capacity are retired.

Still, lasting emissions reductions will depend on changing the country’s electricity mix.

  • BloombergNEF expects power-sector emissions to fall 52% from 2025 levels by 2050 under its Economic Transition Scenario. Emissions would reach about 71 MtCO2 by then.
  • The decline would be far greater under BloombergNEF’s Net Zero Scenario. Under that pathway, power-sector emissions could fall to only 1.9 MtCO2 by 2050.

Such a transformation would require a much faster expansion of renewable energy, alongside nuclear, gas, battery storage and carbon capture technologies.

south africa power emission

Coal Remains the Biggest Emissions Challenge

South Africa’s electricity system remains heavily dependent on coal.

  • The country had approximately 67 gigawatts (GW) of installed power capacity in 2025, including around 43 GW of coal capacity. Coal generated approximately 185 terawatt-hours (TWh), accounting for 78% of total electricity generation.

Even so, coal’s dominance has weakened over the past decade. Its share of electricity generation fell from about 90% in 2015 to 78% in 2025.

Meanwhile, solar and wind have moved in the opposite direction. Their combined share of generation increased from just 2% in 2015 to 13% in 2025.

The age of South Africa’s coal fleet adds further pressure. More than 12 GW of coal capacity was already over 40 years old in 2025, while another 16 GW was between 30 and 40 years old.

Consequently, coal retirements are becoming an increasingly important part of the country’s emissions strategy.

South Africa’s 2025 Integrated Resource Plan targets retiring around 8 GW of coal capacity by 2030. The plan also calls for 14 GW of renewable energy and 6 GW of gas capacity to replace some of the retiring generation.

South Africa coal
Source: BNEF

Solar and Wind Could Reshape South Africa’s Power Mix

Renewable energy is expected to grow in importance as South Africa moves away from its coal-heavy electricity system. The forecasts combined solar and wind capacity to rise from around 18 GW in 2025 to 38 GW by 2030.

  • Solar is expected to account for much of this growth. Utility-scale solar capacity could increase from 7.8 GW in 2025 to 14.8 GW in 2030.
  • Small-scale solar is also expanding rapidly. The capacity in this segment is expected to more than double to approximately 13.4 GW by 2030.
  • Wind power will contribute as well, with capacity expected to reach roughly 10 GW by the end of the decade.

BNEF South africa solar and wind

Battery storage will become increasingly important alongside these technologies. Solar and wind output varies according to weather conditions and time of day. Storage can help shift electricity into periods when demand is higher, reducing the need to rely on fossil-fuel generation.

As a result, South Africa’s energy transition is not simply about replacing coal with renewable power. It also requires a more flexible electricity system capable of integrating large amounts of variable renewable generation.

Corporate Renewable Energy Deals Are Accelerating

Private companies are also playing a growing role in South Africa’s renewable energy expansion.

Corporate power purchase agreements (PPAs) are expected to support a significant portion of new utility-scale solar and wind projects. They could support 73% of the expected 2.3 GW of utility-scale solar and wind additions in 2026.

Companies supported approximately 670 MW, or 48%, of tracked renewable capacity added in 2025. Major corporate buyers have included mining and industrial companies such as Sibanye Stillwater, Rio Tinto, Tronox, Air Liquide and Sasol.

Since 2020, companies in South Africa have signed agreements to procure around 5 GW of clean electricity.

This trend could become increasingly important for the country’s emissions outlook. Businesses can secure renewable electricity directly while developers gain greater certainty over future revenues.

At the same time, declining renewable costs are making clean power increasingly competitive with conventional generation.

Grid Investment Could Determine the Speed of Decarbonization

South Africa’s renewable ambitions face one major obstacle: the power grid.

More solar and wind projects will require additional transmission infrastructure to connect new generation and move electricity to areas with high demand.

Without sufficient grid capacity, renewable projects can face delays even when financing and demand are available.

Battery storage could help address some of the system’s flexibility needs. However, storage alone cannot replace the need for a stronger transmission network.

The country is also moving toward greater private-sector participation in electricity markets. These reforms could create additional opportunities for renewable developers, storage companies and infrastructure investors.

At the same time, maintaining reliable electricity remains critical. The country has experienced years of power shortages and load shedding, making energy security a central part of the transition.

The challenge will therefore be to retire aging coal plants without creating new electricity shortages.

South Africa’s Energy Transition Enters a Critical Phase

South Africa’s power sector remains one of the world’s more carbon-intensive electricity systems. Yet the latest data shows the foundations of a major transition are taking shape.

The next stage will be harder. The country needs to accelerate renewable deployment while retiring aging coal capacity, expanding transmission infrastructure and keeping electricity reliable and affordable.

The report highlights the potential scale of the opportunity, with power-sector emissions projected to fall by more than half from 2025 levels by 2050. Achieving deeper reductions, however, will require faster action.

BNEF forecasts that:

  • South Africa will invest around $63 billion in its power grid between 2026 and 2050. This works out to about 44 cents for every dollar invested in power generation.
  • Of the total, 58% will go toward replacing aging infrastructure, while 28% will fund grid upgrades and reinforcement. The remaining 14% will be allocated to new connections.

power sector investment

For South Africa, the energy transition is therefore becoming less about whether coal will decline and more about how quickly clean electricity, storage and grid infrastructure can take its place.

The answer will have major implications not only for the country’s climate targets, but also for its future industrial competitiveness and demand for carbon-free electricity.

The post South Africa’s Power Sector Emissions Fall 19% as Renewables Gain Ground, Says BNEF appeared first on Carbon Credits.
Gold Standard Launches Green Hydrogen Methodology to Generate Carbon Credits

Gold Standard Launches Green Hydrogen Methodology to Generate Carbon Credits

Gold Standard has launched a new methodology that allows qualifying green hydrogen projects to generate carbon credits when they replace more carbon-intensive hydrogen production. The methodology covers hydrogen made through water electrolysis using renewable electricity. It can support both new projects and upgrades at existing industrial sites.

The new framework gives hydrogen developers another way to attract carbon finance. It also sets strict rules for renewable power, additionality, water use, and emissions accounting.

The move comes as global hydrogen demand grows, while low-emissions production remains small. The International Energy Agency (IEA) reports that global hydrogen demand exceeded 100 million tonnes in 2025. Meanwhile, low-emissions hydrogen production stayed around 1 million tonnes.

Gold Standard Targets Hydrogen’s Fossil Footprint

Gold Standard’s Green Hydrogen Production methodology applies to projects that make hydrogen through electrolysis and use renewable electricity. The rules cover both greenfield projects, which build new green hydrogen plants, and brownfield projects, which add electrolysers to existing industrial facilities and replace fossil-based hydrogen.

Eligible projects can serve existing industrial users that previously relied on hydrogen made from coal, oil, or natural gas. The methodology can also cover new uses where green hydrogen replaces a more polluting fuel.

Credits depend on the amount of qualifying green hydrogen actually produced and used. A project, therefore, cannot claim credits simply because it has an electrolyzer or uses renewable power.

Every Kilogram of Hydrogen Must Be Accounted For

Gold Standard puts a strong emphasis on direct measurement. Projects must measure the electricity used and the amount of hydrogen produced. They must also show where the hydrogen goes and confirm that the end use qualifies for credit.

The methodology requires continuous measurement of hydrogen production using equipment such as mass flow meters or precision load cells. Projects must also track hydrogen delivered or sold to eligible users.

If developers cannot prove that a certain volume went to a qualifying end use, that volume cannot generate credits. This approach helps reduce the risk of overstating emissions reductions.

Green Hydrogen Must Prove Its Power Is Truly Renewable

The methodology also sets detailed rules for renewable electricity. Projects can use renewable power from sources such as solar, wind, and geothermal energy. They must prove where the power comes from and show a clear link between renewable generation and hydrogen production.

Simply buying unbundled renewable energy certificates, or RECs, does not qualify.

Gold Standard states that unbundled RECs and guarantees of origin can’t count as renewable electricity. This is because they lack a direct link to the electricity used by the hydrogen plant.

Off-site renewable projects can provide power with a power purchase agreement (PPA); however, they need to meet extra requirements.

For example, the renewable project generally must begin commercial operation within 24 months of the hydrogen facility’s start date. Gold Standard can extend that period by up to 12 months, giving a maximum of 36 months in documented cases outside the developer’s control.

The methodology also moves toward hourly matching between renewable generation and hydrogen production as tracking systems become available.

Gold Standard green hydrogen methodology and carbon credits

Grid Power Gets a Strict 10% Limit

Some grid electricity is allowed, but only in limited amounts. A project can use grid power when renewable supply is not enough, but grid electricity cannot exceed 10% of total annual electricity use.

Gold Standard also applies different emissions rules based on the grid’s carbon intensity. If the grid emissions factor is below 0.2 tonnes of CO2e per MWh, related hydrogen can still qualify as green under the methodology.

If the grid factor reaches or exceeds 0.2 tCO2e/MWh, the project must count the actual emissions linked to that grid electricity. These rules lower the risk of a project using lots of fossil-heavy grid power. This way, it can’t falsely claim credits for zero-emission hydrogen.

Carbon Finance Must Make a Real Difference

Gold Standard also requires developers to show that carbon finance helps make the project possible. The methodology looks at financial conditions, common practices, legal requirements, and lock-in risks.

Projects must also complete an ongoing assessment of their financial needs. This matters because green hydrogen projects may receive subsidies, tax benefits, or other government support.

The rules aim to prevent credits from rewarding emissions reductions that would have happened anyway.

Gold Standard also applies a Downward Adjustment Factor (DAF) to the crediting baseline. The factor considers the host country’s official net-zero target and lowers the baseline over time. This makes the crediting system more conservative as national climate policies strengthen.

Water and Supply Chain Emissions Matter

Water use is another part of the methodology. Electrolysis needs water, which can create pressure in areas that already face water shortages. Gold Standard limits the share of local drinking water use to 5% and requires checks on water availability and hydrological risks.

The methodology also accounts for emissions from equipment used to produce green hydrogen. Developers must consider emissions linked to the manufacture and transport of electrolysers, solar panels, wind turbines, and battery systems during the first crediting period.

The rules also account for hydrogen leakage. Gold Standard uses a 100-year global warming potential of 14.4 for hydrogen when calculating those emissions. That makes the methodology broader than simply comparing green hydrogen with fossil hydrogen at the production plants.

Credits Require Proof of Real Fossil Fuel Displacement

The methodology focuses on actual changes in how hydrogen and energy are produced. Developers must prove that current industrial users have used fossil-based hydrogen for at least three years before they can switch to green hydrogen.

Some uses are excluded entirely. Projects can’t get credits for green hydrogen used in:

  • enhanced oil recovery, 
  • unconventional fossil fuel extraction or processing, and
  • untargeted blending into natural gas networks.

For new hydrogen demand, developers must show that green hydrogen replaces a more emissions-intensive fuel or conventional hydrogen. These rules make the emissions benefit easier to measure and help strengthen the additionality case.

Hydrogen Demand Surges While Clean Supply Lags

The new methodology enters the market as hydrogen demand continues to rise. The IEA reports that global hydrogen demand topped 100 million tonnes in 2025. However, low-emission hydrogen production was only about 1 million tonnes. The agency says low-emissions production grew 20% in 2025, showing progress but also a large gap with overall demand.

global hydrogen production 2025 from IEA

Electrolysis capacity is also growing. The IEA reports that global electrolyser capacity doubled in 2025, exceeding 4 GW. Additionally, over 2.5 GW of new capacity is being built for operation in 2026.

However, the industry still faces high costs, limited infrastructure, and uncertain demand. Carbon finance could help some projects close part of the cost gap. Still, carbon credits alone are unlikely to make green hydrogen competitive in every market.

Green Hydrogen Gets a New Carbon Finance Route

Gold Standard’s new methodology gives green hydrogen developers a clearer path to carbon finance. The rules call for directly measuring hydrogen output. They also set strict renewable power needs. Lastly, projects must prove they replace more carbon-heavy hydrogen or fuels. 

If carbon finance can support more green hydrogen projects, the methodology could help expand low-carbon supply in industries such as refining, chemicals, ammonia, and steel. Yet, developers still need customers, renewable electricity, infrastructure, and financing.

Gold Standard’s framework does not guarantee a flood of new credits. It creates a stricter path for projects to prove that green hydrogen replaces real sources of emissions and delivers measurable climate benefits.

The post Gold Standard Launches Green Hydrogen Methodology to Generate Carbon Credits appeared first on Carbon Credits.
UK’s $541 Million Forest Bet: Can Brazil’s TFFF Turn Tropical Forests into Climate Assets?

The United Kingdom will provide a £400 million ($541 million) loan to Brazil’s Tropical Forests Forever Facility (TFFF). This funding aims to help make tropical forest conservation a long-term financial asset.

This commitment arises as governments look for new ways to fund climate action while managing public spending. Unlike a traditional grant, the UK’s support will be a loan. This shows a shift toward using repayable financing for some international climate investments. However, this assurance depends on final due diligence, governance, and operational arrangements.

The announcement could also help the Brazil-led fund reach its first major financing milestone. The TFFF is targeting $10 billion in public funding during its first year and has already secured almost three-quarters of that amount, according to Reuters. The $10 billion target is to be reached by the end of 2026.

The wider ambition is considerably larger. The facility ultimately aims to mobilize $125 billion, including $25 billion from governments and public institutions.

Why the UK’s TFFF Loan Matters

The UK supported the TFFF concept when it was launched at the COP30 climate summit in Belém, Brazil, but initially stopped short of committing taxpayer funding. But this position has now changed.

The UK government said it intends to invest £400 million through a loan, although

The structure allows Britain to participate without providing the money as a traditional grant. It also reflects a broader debate around international climate finance, as developed economies face pressure to increase funding for climate and nature protection while demonstrating that public money is being used efficiently.

For the TFFF, the UK commitment is important because the facility depends on large pools of long-term capital rather than one-off conservation grants.

Notably, the TFFF is designed to operate as a long-term financing mechanism that provides predictable, performance-based payments to countries that maintain their tropical forests. The facility says it could support more than 70 tropical forest countries covering more than 1 billion hectares of moist tropical and subtropical broadleaf forests.

TFF tropical forest fund
Source: TFF

Turning Standing Forests Into a Financial Asset

The central idea behind the TFFF is relatively simple: countries should receive more financial value from keeping forests standing than from clearing them.

Traditional development finance has often struggled to compete with the economic incentives of agriculture, mining, timber, and other land uses.

The TFFF attempts to change that equation by creating a long-term financial reward for forest conservation.

Countries that meet forest-protection requirements can receive annual payments based on their conservation performance. The facility says these payments are intended to be predictable and long-term rather than dependent on short-term project grants.

That makes the model particularly relevant to the carbon market, although the TFFF is not simply another carbon-credit scheme.

Instead, it can complement existing mechanisms such as REDD+ and forest carbon markets. TFFF official overview

This distinction matters. Carbon markets generally place a financial value on quantified emissions reductions or removals. The TFFF takes a broader approach by creating financial incentives for countries to maintain standing forests and the ecosystem services they provide.

Forests Are a Major Carbon Removal Engine

The climate case for the initiative is strong.

Forests absorb carbon dioxide through photosynthesis and store carbon in trees, vegetation, roots, and soils. The World Resources Institute estimates that forests remove around 16 billion tonnes of CO₂ from the atmosphere each year. This highlights their importance as a natural carbon sink.

The global forest carbon sink is enormous, but it is not guaranteed to remain that way.

Deforestation, degradation, fires, and climate-related stresses can reduce the ability of forests to absorb carbon. In some cases, damaged forests can shift from being carbon sinks to becoming sources of emissions.

This is why protecting existing tropical forests can be an important part of climate strategy.

forest carbon emission

The distinction between carbon removal and avoided emissions is also important.

When a forest continues growing and absorbs additional CO₂ from the atmosphere, that represents carbon removal. When an existing forest is protected from being cleared, the primary climate benefit is the avoidance of emissions that would have occurred if stored carbon had been released.

Both outcomes are valuable, but they should not be treated as identical forms of carbon removal.

Why Protecting Existing Forests Matters

Tropical forests play a particularly important role in the global carbon cycle.

They store enormous amounts of carbon while supporting biodiversity, regulating rainfall and providing livelihoods for millions of people. They currently hold 861 gigatonnes of carbon in their branches, leaves, roots, and soils. However, measuring forest carbon is becoming more complicated as climate change alters forest ecosystems.

Recent research suggests some tropical forest regions have experienced shifts in their carbon-storage capacity, reinforcing the importance of protecting forests while they remain functioning carbon sinks.

For carbon markets, this creates both an opportunity and a challenge.

brazil tropical forest

Forest conservation can deliver significant climate benefits, but accurately measuring additional carbon storage, preventing leakage and ensuring permanence remain critical to maintaining the credibility of forest-based climate finance.

TFFF Could Strengthen Forest Climate Finance

The TFFF is attempting to address part of this financing gap by treating forests as a long-term economic asset.

Its proposed structure combines public and private capital. The broader initiative aims to mobilize $125 billion, with roughly $25 billion expected from governments and public institutions and the remainder from private sources. World Resources Institute: TFFF financing model

The capital would generate investment returns that can help fund payments to tropical forest countries.

That structure is important because forest conservation requires funding year after year.

Deforestation pressures do not disappear after a single grant cycle. Farmers, communities, governments and forest managers need sustained economic incentives to keep forests standing.

The TFFF therefore seeks to create a more predictable source of finance while shifting the economic value of forests toward conservation.

The Next Test Is Mobilizing More Capital

The UK commitment is significant, but it is only one part of the larger financing challenge.

The TFFF still needs to build the capital base required to reach its ultimate $125 billion target. Reaching the initial $10 billion public-finance goal could be an important signal to other governments and institutional investors.

Reuters reported that reaching that first target could also help unlock additional funding, including potential support from the United States.

The facility’s success could influence future approaches to nature and carbon finance. If countries can demonstrate that long-term investment returns can support predictable payments for maintaining forests, similar models could emerge for other ecosystems.

The UK’s investment remains subject to final due diligence, including reviews of the facility’s final size, governance, structure and loan terms.

For tropical forests, however, the underlying message is already clear: protecting carbon-rich ecosystems increasingly needs to be treated not just as an environmental responsibility, but as a long-term financial investment.

The post UK’s $541 Million Forest Bet: Can Brazil’s TFFF Turn Tropical Forests into Climate Assets? appeared first on Carbon Credits.

Europe’s Wildfires Release 27 Million MT of CO2 as France Sets New Emissions Record

Europe’s Wildfires Release 27 Million MT of CO2 as France Sets New Emissions Record

Wildfires have released an estimated 27 million metric tons of carbon dioxide (MtCO2) across Europe so far in 2026, with France accounting for a record amount of emissions, according to the European Union’s Copernicus Atmosphere Monitoring Service (CAMS).

The fires are creating a growing climate risk. They are not only releasing carbon stored in forests and other ecosystems. They can also weaken Europe’s ability to absorb emissions through its land and forests.

France has been one of the clearest examples. CAMS reported that French fires produced 0.89 million tons of carbon (Mt C) during July alone, the highest July level in its record. The previous July record was 0.64 Mt C in 2022.

France’s Fires Set a Record as Europe Burns

The scale of France’s fires reflects an unusually hot and dry summer across parts of Western Europe. CAMS uses satellite observations and its Global Fire Assimilation System to estimate emissions from fires in near real time. Its data showed that France had its highest annual fire emissions through the end of July in the available record.

France wildfire September 2026
Source: Copernicus Atmosphere Monitoring Service

The wider 2026 fire season has also been severe. EU data from the European Forest Fire Information System showed that 647,375 hectares had burned in the EU by September 2. This was due to 1,913 fires, each larger than 30 hectares.

The burned area in 2025 was lower than in the past, which was the EU’s worst year. Still, it was above the average of about 328,000 hectares from 2006 to 2025. This means the 27 MtCO2 emissions figure is part of a broader pattern of widespread fire activity rather than a single extreme event.

Climate Change Is Raising Fire Risk

Researchers say climate change is increasing the conditions that allow large fires to develop.

A World Weather Attribution study found that human-caused warming made extreme fire conditions in southwest France and central Spain more likely in 2026. The analysis linked the high fire risk to a combination of extreme heat, unusually low rainfall and severe soil moisture deficits.

In southwest France, conditions of similar severity are now expected about once every 20 years. In central Spain, they are expected roughly once every six years.

spain wildfire carbon emissions 2026
Source: World Weather Attribution

Researchers found that climate change has boosted extreme fire weather. In southwest France, such severe conditions are now at least twice as likely. In central Spain, they are at least 20 times more likely.

Land management can also affect fire behavior. Forest structure, vegetation, population patterns, and land use all influence how quickly fires spread. This means climate change is an important driver, but not the only one.

Europe’s Forest Carbon Sink Is Losing Strength

The wildfire problem matters to carbon markets because forests and other land ecosystems are a major part of Europe’s climate strategy.

The EU’s land-use, land-use change and forestry sector, known as LULUCF, removed a net 198 MtCO2e in 2023, equal to about 6% of EU greenhouse gas emissions. The European Environment Agency (EEA) noted that the sector’s carbon sink has weakened. The average annual sink from 2014 to 2023 is about 30% lower than in the previous decade.

LULUCF net emissions and removals for the EU-27
Source: EEA

Wildfires are one factor behind that decline. Fires can quickly release carbon stored in vegetation and soils, reducing the amount of carbon that land can absorb.

The EEA has warned that more frequent and severe disturbances, including wildfires and drought, are affecting Europe’s forest carbon stocks. That creates a challenge for Europe’s climate goals.

  • The EU aims for a 310 MtCO2e net-removal target for the LULUCF sector by 2030. However, current national projections show that existing measures won’t meet this goal.

Wildfires Put Forest Carbon Credits to the Test

The growing fire risk has serious implications for nature-based carbon projects. Forest and reforestation initiatives depend on carbon remaining stored for decades.

However, a major wildfire can instantly destroy that stored carbon. When projects burn, carbon standards do not penalize individual corporate buyers. Instead, registries rely on “buffer pools”—shared insurance reserves of carbon credits that are permanently retired to cancel out the losses.

Real-world data shows that these safety nets are under severe strain from modern climate realities. Actuarial analyses of the California Air Resources Board (CARB) compliance program reveal that wildfires have triggered massive credit cancellations. For example, a single event—the Lionshead Fire—alone reversed 963,534 credits.

This is part of a much larger systemic threat. A landmark study by CarbonPlan and UC Berkeley found that California’s program set aside about 6.8 million credits. This amount covers wildfire risk for a century across its entire portfolio.

By 2024, cumulative losses from devastating fire seasons had blown past 10.7 million credits. The program effectively exhausted its hundred-year wildfire insurance pool decades ahead of schedule.

VCM registries face similar pressure. Premier international registries like Verra maintain global buffer accounts comprising tens of millions of tons of CO2.

When major projects fail, like the Colville Indian Reservation forest project in Washington, registries must freeze or cancel millions of credits. This helps keep corporate buyers protected.

Future Fire Risk Could Surge Nearly 200%

New research suggests that Europe’s wildfire problem could become significantly worse later this century without stronger climate action and fire management.

A study in Global Change Biology, led by the Potsdam Institute for Climate Impact Research, found that intense fire weather could raise Europe’s annual burned area by 39% by the end of the century in a low-emissions scenario. Under a high-emissions scenario, the increase could reach about 192%, or nearly three times current levels.

The researchers also found that better prevention, early detection, and firefighting could greatly reduce the increase. Improvements in fire management can cut burned area by 72% to 92%. This depends on the situation. Even so, stronger fire management would not fully offset the effects of severe climate change.

The study highlights an important point for carbon markets. Protecting forests cannot rely only on planting more trees. Projects also need to consider whether those forests can survive increasingly severe climate hazards.

Europe Faces a Tougher Fight to Protect Its Carbon Sinks

The 27 MtCO2 estimated from European wildfires in 2026 adds another layer to the region’s climate challenge. The immediate issue is the carbon released by fires. The longer-term concern is the loss of forests and other ecosystems that would otherwise remove CO2 from the atmosphere.

Europe’s land carbon sink remains an important tool for reaching climate neutrality, but the EEA says its capacity is already declining. For carbon markets, that means the focus must extend beyond how many credits a forest project can generate. The durability of those removals matters just as much.

More resilient forests, stronger fire prevention and better land management can help protect Europe’s carbon sinks. Yet, the latest research shows that these measures will have to work alongside major cuts in greenhouse gas emissions.

As extreme heat and drought increase fire risk, Europe faces a difficult cycle: climate change can make wildfires more severe, fires can release more stored carbon, and damaged forests can become weaker carbon sinks. Breaking that cycle will be critical to both the region’s climate targets and the future reliability of nature-based carbon removal.

The post Europe’s Wildfires Release 27 Million MT of CO2 as France Sets New Emissions Record appeared first on Carbon Credits.
UNEP Warns Global Warming May Overshoot 1.5°C, Calls for Faster Emissions Cuts and Carbon Removal

The world is on track to cross the critical 1.5°C warming threshold within the next few years. A new United Nations Environment Programme (UNEP) report says the threshold is increasingly difficult to avoid, but it does not mean the climate fight is over.

UNEP’s Limiting Overshoot report outlines a difficult but still possible path: allow temperatures to rise above 1.5°C for a limited period, push warming to its lowest possible peak, and then bring global temperatures back down.

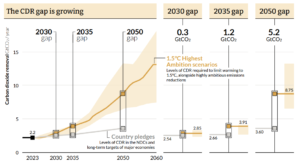
The strategy depends on much faster emissions cuts, stronger climate adaptation and a major expansion of carbon dioxide removal (CDR). It also highlights a growing reality for governments and businesses: reaching net-zero emissions may no longer be the final destination. The world may eventually need to move into net-negative emissions to reverse some of the warming.

1.5°C Is Becoming a Temporary Threshold

The Paris Agreement established 1.5°C as a key long-term limit for global warming compared with pre-industrial levels. UNEP press release revealed that current climate action, however, is not moving quickly enough to keep warming below it indefinitely.

So even if governments fully implement existing national climate plans and meet additional net-zero commitments, the most optimistic scenario considered by UNEP still sees warming peak at around 1.8°C.

In this context, UN Secretary-General Antőnio Guterres said,

“This summer’s scorching heat, raging wildfires and deadly floods are a warning of what lies ahead. We must make the overshoot above 1.5 degrees as small and short as possible. That demands an overshoot of ambition.”

Other pathways result in even higher temperatures.

The difference between 1.5°C and 1.8°C may look small on paper, but the climate consequences can be significant. Every additional fraction of a degree increases pressure on ecosystems, food systems, water supplies, infrastructure and human health.

For vulnerable countries and communities, the consequences could be especially severe.

Small island nations and low-lying coastal cities face growing risks from rising seas. Extreme heat and flooding could become more disruptive, while changing ocean conditions would place additional pressure on marine ecosystems and the communities that depend on them.

UNEP carbon emissions
Source: UNEP

The Longer Temperatures Stay High, the Greater the Risk

The problem is not only how high temperatures rise. How long they remain elevated also matters.

Higher and prolonged warming increases the risk of major climate systems reaching tipping points. UNEP highlights threats involving the Greenland and West Antarctic ice sheets, the Amazon rainforest and the Atlantic Meridional Overturning Circulation, or AMOC.

Some climate changes could build gradually. Others could happen much faster than expected.

The effects would also spread through economies. Rising temperatures can increase energy demand, damage infrastructure, raise insurance costs and put additional pressure on financial systems.

Food and water security are another major concern. Without effective adaptation, global food production could decline by as much as 14% by 2050, according to the report.

These risks make limiting the peak temperature increasingly important, even if the 1.5°C target is temporarily exceeded.

Global warming
Source: UNEP

Additionally, Inger Andersen, Executive Director of UNEP, said:

“There are no good outcomes if we remain above 1.5°C. Across the globe, extreme heatwaves are already proving that climate impacts will strike faster, hit harder, and last longer – costing more lives and causing deeper disruption. Now is the time we must double down on climate action. We can – and must – get on the right path. By cutting greenhouse gas emissions, strengthening resilience and adaptation, and ensuring exceedance of 1.5°C is as small and short as possible.”

The World’s Best Remaining Option: Overshoot, Peak and Decline

UNEP describes an “overshoot, peak and decline” pathway as the best remaining option for reducing the damage from a temporary breach of 1.5°C.

The approach has three broad stages.

  1. First, countries need to slow warming as quickly as possible. Deep cuts in greenhouse gas emissions, particularly methane and other short-lived climate pollutants, would slow the rate of temperature rise.
  2. Next comes the peak. During this period, economies would need to continue cutting emissions and reach at least net-zero while adapting to increasingly severe climate impacts.
  3. The final stage involves bringing temperatures down through sustained net-negative carbon dioxide emissions. This is where carbon removal becomes critical.
Carbon removal
Sourced from UNEP Report

Carbon Removal Moves From Backup Plan to Climate Tool

Carbon dioxide removal involves taking CO₂ out of the atmosphere and storing it for the long term. Approaches can include restoring forests and other nature-based systems, alongside engineered carbon removal technologies.

UNEP makes an important distinction: carbon removal cannot replace emissions reductions.

Companies and governments cannot continue emitting at current levels and rely on CDR to solve the problem later. Emissions must fall sharply first, with carbon removal addressing residual emissions and eventually helping the world move toward net-negative emissions.

The report also stresses the importance of keeping peak warming well below 2°C. Carbon removal can contribute to a return below 1.5°C only if remaining emissions are brought down substantially, and removal is deployed responsibly.

Strong governance will therefore become increasingly important. Carbon removal projects need credible measurement, environmental safeguards and rules that address questions of scale, fairness and long-term storage.

Adaptation Will Be Just as Important

Even a successful return below 1.5°C would not erase the damage caused during the period of higher temperatures.

Some communities could face permanent changes to their environments, livelihoods and economies. In certain locations, relocation may become necessary.

Adaptation must therefore progress alongside emissions reductions and carbon removal.

The most effective strategies can deliver both benefits at the same time. Nature-based cooling, for example, can help reduce heat exposure while supporting ecosystems and improving resilience.

Adaptation will also need to become more flexible. Climate risks can change rapidly, and infrastructure designed for past conditions may not be suitable for a warmer world.

Three Phases of the Climate Response

UNEP divides the response into three interconnected phases.

Immediate action focuses on slowing warming through rapid emissions reductions, especially methane cuts, while protecting vulnerable communities and ecosystems.

Coping and containment begins as temperatures approach their peak. Governments and businesses would need to accelerate decarbonization, reach at least net-zero, and strengthen resilience against increasingly severe impacts.

Long-term resilience comes as temperatures begin to decline. Sustained net-negative CO₂ emissions would be needed alongside long-term adaptation and stronger climate resilience.

The timeline for moving through these stages will depend heavily on how quickly governments act.

emission mitigation
Source: UNEP

Climate Action Is Now a Race Against the Peak

Crossing 1.5°C should not be treated as a new acceptable climate target. The central challenge is to make any overshoot as small and short as possible.

Every fraction of a degree avoided can reduce damage. Every year spent at higher temperatures can increase the risk of irreversible changes.

Reaching the best possible outcome will require more than carbon removal. Governments need stronger climate policies, faster renewable energy deployment, deeper emissions cuts, methane reductions and major investment in adaptation.

Finance and international cooperation will also be essential. Countries with greater historical responsibility for emissions face greater pressure to move faster and provide support to more vulnerable nations.

The climate challenge has therefore entered a new phase. Net-zero remains essential, but it may be only the midpoint. The longer-term goal could require removing more carbon from the atmosphere than humanity emits.

The window for keeping that pathway open is narrowing. The decisions made now will determine not only whether temperatures cross 1.5°C, but also how high they climb, how long they stay there, and whether the world can eventually bring them back down.

The post UNEP Warns Global Warming May Overshoot 1.5°C, Calls for Faster Emissions Cuts and Carbon Removal appeared first on Carbon Credits.