Can GM Stock Balance Strong Q3 Earnings With Its 365M-Ton Emissions Challenge?

General Motors (NYSE: GM) reported stronger third-quarter 2026 earnings as higher profits and cash flow supported its business outlook. The automaker also recorded a milestone in China, where new energy vehicles (NEVs) accounted for more than 60% of its third-quarter sales.

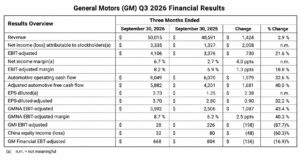
  • GM generated $50.02 billion in revenue, up 2.9% year over year, while net income attributable to shareholders rose to $3.34 billion from $1.33 billion a year earlier. Adjusted earnings per share (EPS) increased 32.2% to $3.70.

Alongside its financial performance, GM continues to invest in electrification, renewable energy and battery storage. Its progress highlights how the automaker is balancing profits from its core vehicle business with efforts to reduce emissions and develop new energy-related opportunities.

GM Q3 Earnings: Revenue and Profits Rise

GM’s third-quarter results showed stronger profitability across its core North American business.

GM Q3 highlights
Source: GM

Adjusted earnings before interest and taxes (EBIT) reached $4.11 billion, compared with $3.38 billion in the third quarter of 2025. The adjusted EBIT margin improved to 8.2% from 6.9%.

North America remained the primary driver of earnings. General Motors North America (GMNA) generated $3.59 billion in adjusted EBIT, up 43.4% year over year. Its adjusted margin rose to 8.7% from 6.2%.

The improvement helped offset weaker results elsewhere. GM International reported adjusted EBIT of $28 million, down from $226 million a year earlier. Equity income from its China operations fell to $32 million from $80 million, while GM Financial’s adjusted earnings before taxes declined 16.9% to $668 million.

gm shares
Source: GM

Despite these pressures, adjusted automotive free cash flow increased 40% to $5.88 billion. GM also ended the quarter with $23.1 billion in automotive cash, providing financial flexibility for investment and shareholder returns.

The company repurchased $2.5 billion of shares during the quarter and retired another 29 million shares. It subsequently completed its previous $6 billion buyback authorization and approved a new $20 billion multiyear program. GM also declared a quarterly dividend of $0.18 per share.

Updates Its 2026 Financial Outlook

GM narrowed its full-year guidance following the quarterly results. It now expects adjusted EBIT of $14.5 billion to $15.5 billion and adjusted automotive free cash flow of $11.5 billion to $12.5 billion.

The company also expects adjusted diluted EPS of $12.75 to $13.75. These forecasts reflect management’s current expectations, rather than guaranteed results.

GM expects several factors to support its business in the coming quarters, including the launch of new full-size pickups, increased production capacity for SUVs and crossovers, and growth in services such as OnStar and Super Cruise. Cost management across warranty expenses, EVs, and materials will also remain important.

For investors, the results show that GM’s earnings still depend heavily on its established vehicle business. Its ability to manage costs while expanding electric vehicles and energy-related services will help determine future profitability.

GM Stock: Buybacks Support Shareholder Returns

GM’s new $20 billion share repurchase authorization signals its willingness to return capital to shareholders. However, the authorization does not mean the company will spend the full amount immediately.

Investors will also monitor demand, margins, and the cost of developing new vehicles. While stronger earnings and cash flow provide support, GM stock’s longer-term performance will depend on sustained profitability and the company’s ability to manage industry risks.

Solid Q3 EV Sales in China 

John Roth, GM senior vice president and president of GM China and Asia, said,

“We are strengthening a competitive and sustainable business in China, guided by our commitment to meeting the evolving needs of Chinese customers. Our improved product mix is building strong momentum for profitable growth across key segments.”

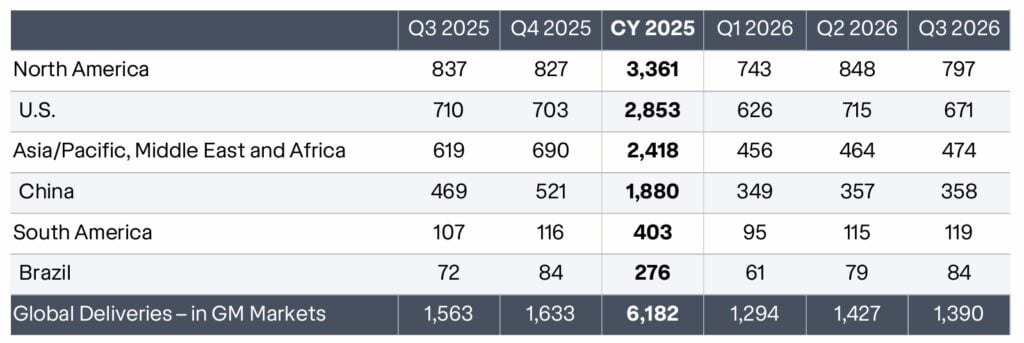
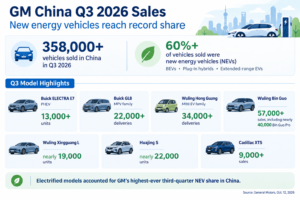
GM’s China business delivered more than 358,000 vehicles in the third quarter, with battery electric vehicles (BEVs), plug-in hybrid electric vehicles (PHEVs) and extended-range electric vehicles (EREVs) accounting for over 60% of sales. This was the company’s highest third-quarter NEV share in China.

Several models contributed to the performance. The Buick ELECTRA E7 plug-in hybrid SUV sold more than 13,000 units, while the GL8 premium multipurpose vehicle family delivered over 22,000 units. The Wuling Hong Guang MINI EV family recorded more than 34,000 deliveries.

The Wuling Bin Guo generated over 57,000 sales, including nearly 40,000 units of the Bin Guo Pro. Meanwhile, the newly launched Buick ELECTRA L7 expanded the brand’s all-electric lineup, and the Cadillac XT5 plug-in hybrid strengthened its position in the luxury SUV segment.

GM said its China joint venture recorded its eighth consecutive profitable quarter. The sales figures suggest that new models and a broader mix of electric and hybrid vehicles are helping the company compete in China’s fast-changing automotive market.

However, higher NEV sales do not automatically translate into higher profits. Competition, pricing, and development costs will determine whether GM can sustain profitable growth in the region.

gm sales
Source: GM’s Q3 China sales announcement.

GM Sustainability: Emissions, Renewable Energy and Battery Storage

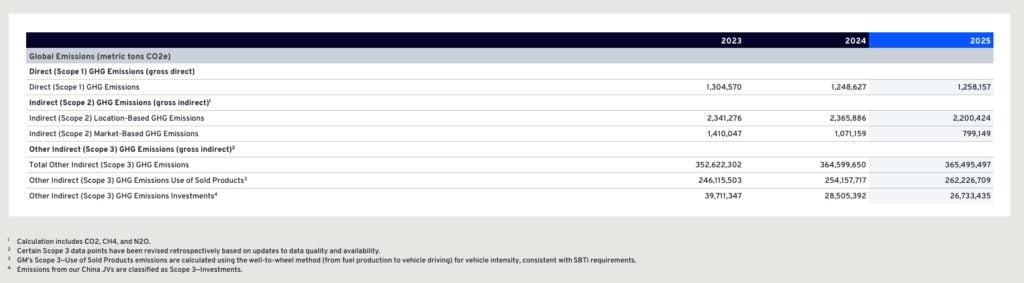
GM reduced its combined Scope 1 and Scope 2 emissions from 4.3 million metric tons in 2018 to approximately 2.1 million metric tons in 2025, a 52% decline. Its target is to cut these operational emissions by 72% by 2035 and achieve carbon neutrality across its global products and operations by 2040.

However, its wider emissions footprint remains substantial.

  • It reported approximately 365.5 million metric tons of Scope 3 emissions in 2025, including 262.23 million metric tons associated with the use of sold products.
  • This makes vehicle use a much larger climate challenge than factory operations alone.

GM also matched 100% of electricity consumption at its U.S. facilities with renewable electricity in 2025 and 70% of its global electricity consumption. It aims to reach 100% globally by 2035.

gm emissions

Battery storage offers another opportunity. Through GM Energy, the company sells home battery systems and supports vehicle-to-home technology for compatible vehicles. It has also explored stationary storage using repurposed EV batteries, which can extend battery life and support electricity reliability.

These initiatives could strengthen GM’s sustainability strategy, but their financial impact will depend on customer demand, operating costs and successful commercial expansion.

Can GM Sustain Its Earnings and Climate Progress?

GM’s third-quarter results show stronger profits, improved cash generation and rising demand for NEVs in China. Its renewable electricity progress and battery storage initiatives also support its longer-term transition.

The challenge is to turn these developments into lasting value. Investors will need to watch North American margins, China’s profitability, EV demand, and emissions across the vehicle lifecycle.

GM’s ability to combine financial discipline with lower-emission technologies will be central to its long-term competitiveness.

The post Can GM Stock Balance Strong Q3 Earnings With Its 365M-Ton Emissions Challenge? appeared first on Carbon Credits.

Asia-Pacific Carbon Market at a Turning Point: Buyers Rise as Credit Supply Falls

Asia-Pacific Carbon Market at a Turning Point: Buyers Rise as Credit Supply Falls

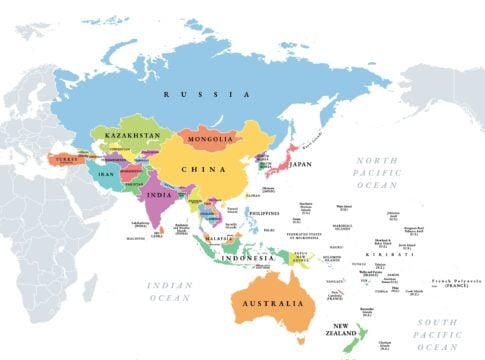
Asia-Pacific is becoming a bigger force in the global carbon market, but not in the way many might expect. The region’s share of global carbon credit issuance and retirements has fallen since 2021. At the same time, its companies are becoming a major source of new buyers, while governments are shaping how credits are produced, traded and used.

These are key findings from AlliedOffsets’ APAC Carbon Market Report 2026, published in October. The report examines carbon credit supply, buyer demand, pricing, Article 6 cooperation and aviation’s carbon offsetting system across the region.

The data reveal a market in transition. New demand is emerging, but supply is uneven. Some countries are opening new routes for international carbon trading, while others are building pipelines of credits that could qualify for use under foreign carbon market rules.

APAC’s Share of Global Carbon Credit Supply Shrinks

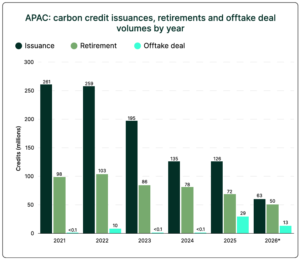
Asia-Pacific’s share of global carbon credit issuance fell from about 50% in 2021 to around 30% in 2025, according to AlliedOffsets. Its share of global credit retirements also declined, from 42% to 33% over the same period.

Retirement happens when a carbon credit is permanently removed from circulation. This often occurs after a company uses it to support a climate claim or meet a requirement. Issuance, by contrast, refers to credits created after a project completes the required process under a carbon crediting program.

The decline in APAC’s global share is notable because issuance and retirements grew in regions outside APAC over the same period. This suggests that the region’s carbon market has not kept pace with growth elsewhere.

However, the report identifies one area of stronger activity: offtake agreements. These contracts allow buyers to purchase credits that a project expects to deliver in the future. APAC accounted for about one-fifth of global offtake volume in 2025 and more than one-third of global volume recorded through October 19, 2026.

APAC carbon credit issuances alliedoffsets
Source: AlliedOffsets

The report cautions that it is too early to know whether this increase marks a lasting trend. Still, offtake activity could help project developers secure revenue and financing before their credits are delivered.

APAC Companies Become a Major Source of New Buyers

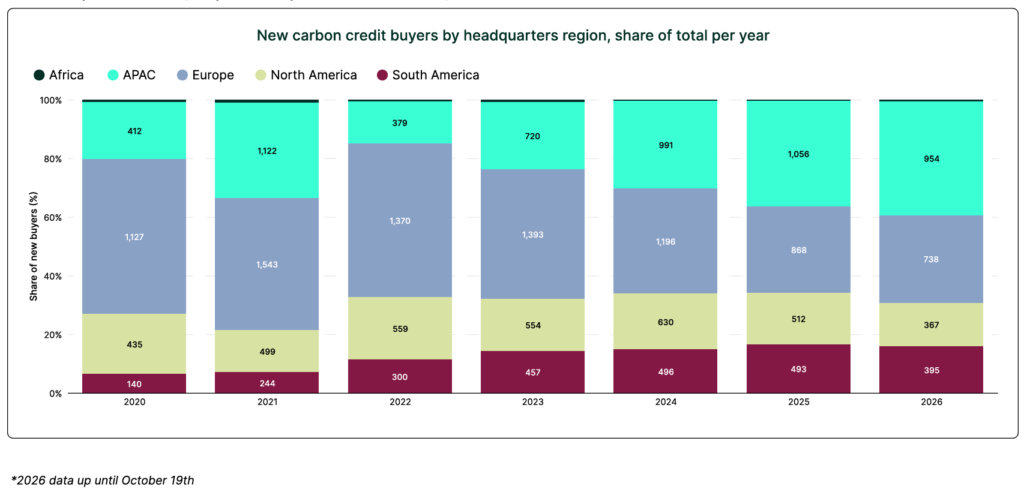
While the region’s share of credit supply has weakened, demand from APAC-based companies is growing. In 2025, companies headquartered in APAC overtook European companies as the largest source of new carbon credit buyers.

APAC-based businesses accounted for about one-third of new buyers in 2025, up from around one-fifth in 2020. The momentum continued in 2026. AlliedOffsets counted 954 new APAC buyers through October 19, already approaching the record 1,056 recorded for all of 2025.

carbon credit buyers by region alliedoffsets
Source: AlliedOffsets

This shift matters because more buyers can create new demand for projects that deliver credible emissions reductions or remove carbon dioxide from the atmosphere. Buyer numbers alone don’t reveal how much credit each company will buy. They also don’t show if the announced interest will result in completed deals.

The report also finds that APAC nature-based removal supply remains concentrated among a relatively small group of developers. Projects in the region issued about 13.2 million nature-based removal credits in 2025.

Nepal’s Ministry of Forests and Environment accounted for 20% of this total, while Terra Carbon supplied 14%. Permian Global contributed another 12%, and Woodside Burrup accounted for 7%. Smaller developers made up the remaining 38%.

This concentration highlights the role of a few major project developers in regional carbon removal supply.

Carbon Credit Prices Vary by Project Type

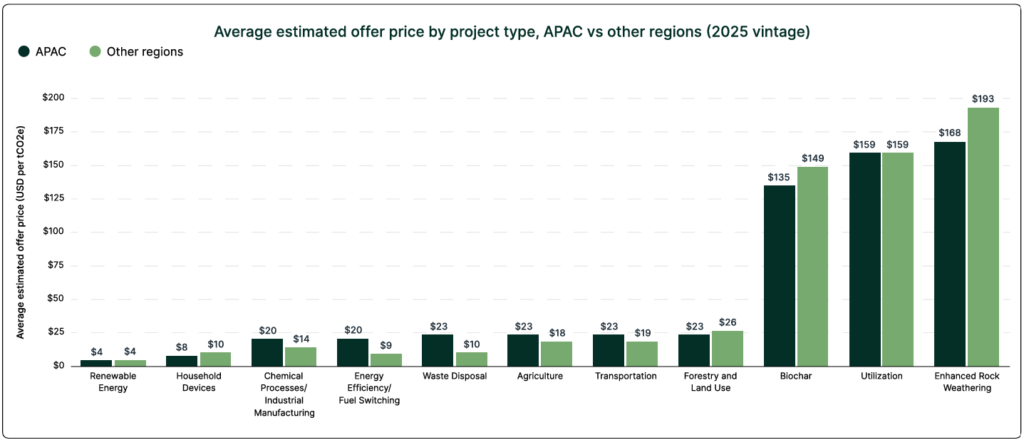
The report’s pricing data show that APAC credits do not always trade at a discount to those from other regions. Prices depend heavily on the type of project.

AlliedOffsets estimated that in 2025, APAC biochar credits cost an average of $135 per tonne of carbon dioxide equivalent. This is about 10% lower than similar offers from other regions. Enhanced rock weathering credits averaged $168 per tonne, around 13% lower than offers elsewhere.

Average estimated offer price by project type alliedoffsets
Source: AlliedOffsets

Biochar is produced by heating organic material, such as agricultural waste, with little or no oxygen. Enhanced rock weathering uses crushed minerals to speed up natural processes that remove carbon dioxide from the atmosphere.

The pattern was different for some other project categories. APAC energy-efficiency and waste-disposal credits had estimated offer prices more than twice those of comparable credits from other regions.

These figures are estimated offer prices, not confirmed transaction prices. They also apply to specific project types and credit vintages, so they should not be treated as a single market-wide price for APAC credits. The differences show why buyers need to assess credit type, quality, and project details rather than relying only on regional averages.

Article 6 Could Open New Routes for Regional Carbon Trading

International cooperation under Article 6 of the Paris Agreement is another major development in APAC. It helps countries work together to cut emissions. This includes transferring internationally transferred mitigation outcomes, or ITMOs, based on the rules.

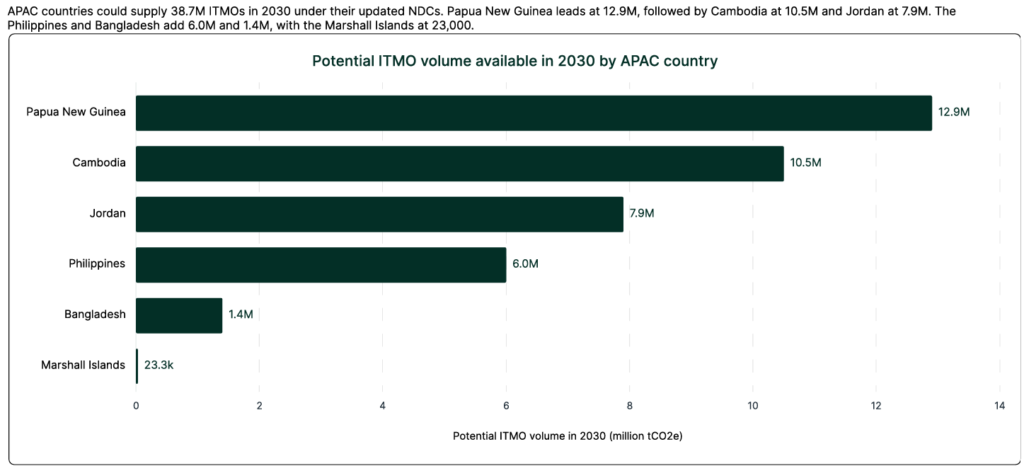
AlliedOffsets estimates that APAC countries could supply 38.7 million ITMOs in 2030 under their updated nationally determined contributions. This is potential supply, not a forecast of credits that will definitely be approved or transferred.

Papua New Guinea accounts for a potential 12.9 million tonnes, followed by Cambodia at 10.5 million and Jordan at 7.9 million. The Philippines might provide 6 million tonnes. Bangladesh contributes 1.4 million, and the Marshall Islands adds about 23,300 tonnes.

ITMO volume available in 2030 by APAC country
Source: AlliedOffsets

The report also tracks projects listed under Singapore’s eligible carbon credit arrangements. These published lists could provide 27.2 million credits from APAC projects with 2021–2030 vintages.

Mongolian grassland and agricultural land projects account for about 19 million, or almost 70% of the total. Philippine REDD+ projects generate about 6 million credits. Smaller amounts come from cookstoves, electric vehicle charging, reforestation, and rice methane projects.

Being listed does not mean all these credits have already been issued or transferred. Actual use depends on project delivery and the applicable rules.

Meanwhile, the Joint Crediting Mechanism (JCM), which supports cooperation between Japan and partner countries, saw a record 17 APAC projects issue credits in 2025. Yet annual issuance has generally remained at or below 100,000 credits, apart from a Cambodian project that issued about 600,000 in 2023.

Indonesia’s Carbon Credit Supply Rebounds as Retirements Slow

Indonesia provides another example of the gap between credit supply and demand. Following the reopening of international carbon trading under Presidential Regulation 110/2025, issuance remained close to zero for three quarters before rising sharply in the third quarter of 2026.

  • AlliedOffsets recorded 10.9 million credits issued in that quarter, almost all from the Katingan project.

Yet, retirements have not increased at the same pace. Indonesian credit retirements fell from 5 million tonnes in the first quarter of 2025 to less than 1 million tonnes per quarter during 2026.

This difference matters. New issuance expands the amount of credit available, but it does not guarantee that buyers will purchase and retire those credits. Demand will depend on factors such as eligibility, price, quality, and the rules governing how credits can be used.

For Indonesia, the next challenge is therefore not just to restore supply, but to attract buyers for the credits coming back into the market.

Aviation Rules Add Another Source of Demand

The aviation sector is also influencing APAC’s carbon market through the Carbon Offsetting and Reduction Scheme for International Aviation, known as CORSIA. The scheme asks covered airlines to manage certain emissions. They can use approved carbon credits as one of the eligible measures.

AlliedOffsets reports that APAC airlines cancelled just over 1 million credits for CORSIA’s first compliance period. Singapore Airlines accounted for 494,196 credits, while Japan Airlines cancelled 350,200. Together, the two airlines represented about 84% of the APAC airline total recorded in the report.

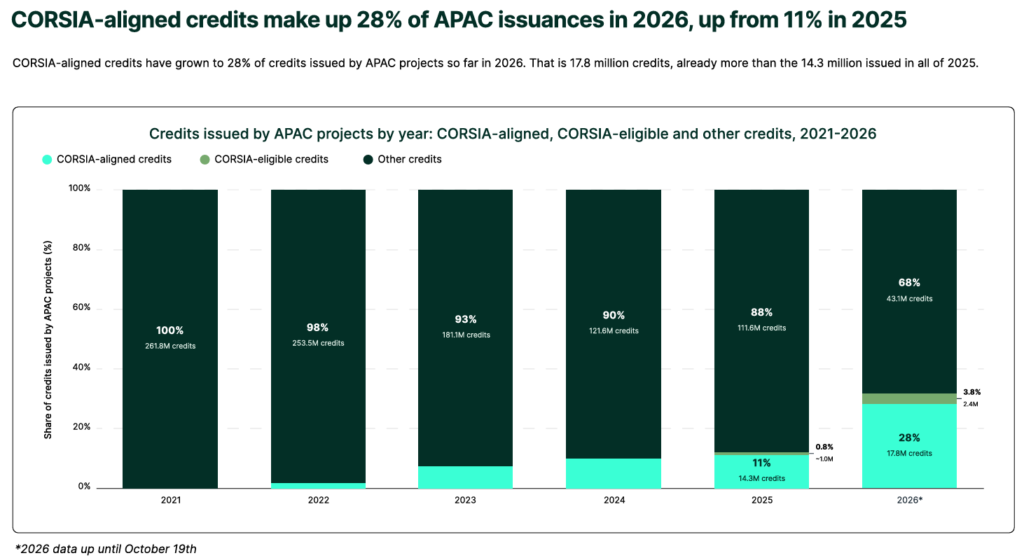
The supply of CORSIA-aligned credits from APAC projects is also growing. These credits accounted for 28% of the region’s issuance through October 19, 2026, equivalent to 17.8 million credits. In 2025, they represented 11% of issuance, or 14.3 million credits for the full year.

The 2026 figure is already higher than the 2025 total, although the 2026 reporting period is not yet complete. CORSIA eligibility and alignment also do not mean every credit can automatically be used by every airline; applicable program and compliance rules still matter.

CORSIA-aligned credits make up 28% of APAC issuances in 2026
Source: AlliedOffsets

Can APAC Turn Rising Buyer Interest Into Lasting Demand?

AlliedOffsets’ findings show a shifting APAC carbon market. Although the region’s share of global issuance and retirements has fallen, new buyers, offtake deals, Article 6 cooperation, and aviation demand are creating opportunities.

Government policy will shape the next phase. Singapore’s eligible credit lists could direct demand toward selected projects, while Indonesia’s reopening of international trading has released new supply. Article 6 growth will depend on countries establishing systems to authorize, track, and transfer credits.

The key question is whether rising buyer interest will lead to sustained purchases and retirements. Developers must deliver credible, eligible credits, while buyers need to assess quality and actual delivery. How well APAC connects demand with reliable supply will determine its future role in global carbon markets.

The post Asia-Pacific Carbon Market at a Turning Point: Buyers Rise as Credit Supply Falls appeared first on Carbon Credits.
EU Carbon Market Shake-Up: Nearly 100 Million More Free Permits for Industry

EU Carbon Market Shake-Up: Nearly 100 Million More Free Permits for Industry

The European Union is moving toward a major change in how it gives free carbon permits to industry. The European Parliament’s environment committee has backed a plan that could provide around 99 million additional free emissions allowances to certain industrial installations from 2026 to 2030.

The proposal aims to help European businesses manage carbon costs and compete with companies in countries with weaker climate rules. But it also raises a key question: how can the EU protect its industries while keeping pressure on them to cut emissions?

The committee’s position differs from the plan backed by EU member states, which would provide around 121 million allowances. Neither proposal should be treated as final law. The two sides must still agree on the rules.

EU Committee Backs 99 Million Free Allowances

The European Parliament’s Committee on the Environment, Climate and Food Safety (ENVI) backed changes to the EU Emissions Trading System (EU ETS). The vote was 64 in favor, 11 against, and two abstentions.

The plan covers industrial installations whose free allowances are calculated using heat and fuel benchmarks. These benchmarks apply when a specific product benchmark is not available.

Under the committee’s approach, around 88 million allowances available for free allocation would be used. It would add another 11 million allowances linked to existing conditions that some installations failed to meet. Together, these would bring the total to about 99 million allowances for the period through 2030.

Each EU ETS allowance permits its holder to emit one metric tonne of carbon dioxide equivalent (CO₂e). Companies that receive more free allowances may need to buy fewer permits to cover their emissions, depending on their actual emissions and allocation.   

The proposal does not give every industrial company the same benefit. It concerns installations covered by the relevant heat and fuel benchmarks and remains subject to the final rules.

Why the EU Wants to Ease Carbon Costs for Industry

The EU ETS puts a price on greenhouse gas emissions from power generation, industry, aviation and other covered activities. Companies must surrender enough allowances to match their reported emissions. They can buy allowances at auction or trade them with other market participants.

The system is designed to make pollution more costly and encourage businesses to reduce emissions. However, some industries receive free allowances to limit the risk of carbon leakage. This happens when companies move production to countries with weaker climate rules, potentially shifting emissions rather than reducing them.

Free allocation is based on common benchmarks that reflect the emissions performance of the 10% most efficient installations in each sector. The EU has been tightening its carbon market rules as it pursues deeper emissions cuts.

The new proposal responds to concerns that updated heat and fuel benchmarks could raise costs for some industrial businesses. These rules are especially relevant to sectors that use large amounts of heat or fuel and do not have a specific product benchmark.

The European Commission’s original July proposal estimated that around 80 million allowances could be used for additional free allocation. Later estimates put the available amount at around 88 million. The committee’s position adds a further 11 million allowances to that pool.

EU Member States Want an Even Larger Allocation

The European Parliament committee and EU member states have taken different approaches to the available allowances. In September, the Council of the European Union backed a plan to combine around 88 million available allowances with a pool of roughly 33 million allowances linked to existing allocation conditions.

That would bring the total to about 121 million allowances for industry over 2026–2030. Reuters estimated that the Council approach could save affected companies around €8.25 billion in carbon costs.

The Parliament committee proposes a different split. It would direct about 11 million of the 33 million pool to industry, with one-third going to the Modernisation Fund and another third to the Innovation Fund. These funds support energy-system upgrades and low-carbon technologies.

The disagreement is not only about the number of permits. It is also about how much support should go directly to industrial companies and how much should help finance the wider energy transition.

The Commission has separately estimated that the roughly 88 million available allowances could avoid around €6 billion in costs for the affected sectors. That estimate relates to the available pool, not the full 121 million allowance option.

The European Parliament’s legislative tracker still lists the file as awaiting Parliament’s position at first reading. The committee vote therefore marks progress, but it does not make the proposed allocation rules law.

EU Emissions Are Falling as Climate Rules Tighten

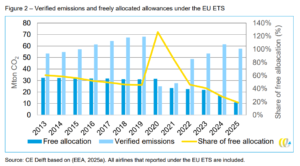
The debate comes as the EU ETS continues to drive emissions reductions. The European Commission reported that verified emissions covered by the system fell by 1.3% in 2025 compared with 2024. Since the system began in 2005, emissions in covered sectors have fallen by about half.

Verified emissions and freely allocated allowances under the EU ETS
Source: CE Delft

The EU ETS remains on track to meet its target of cutting covered emissions by 62% by 2030 compared with 2005 levels. Separately, the EU aims to reduce its net greenhouse gas emissions by at least 55% by 2030 compared with 1990 and reach climate neutrality by 2050.

These targets create a challenge for policymakers. European industries face pressure to lower emissions while managing energy and production costs. Free permits can offer short-term relief, but too much free allocation may weaken the financial incentive to invest in cleaner processes.

The EU has also been changing its wider carbon market rules. The Carbon Border Adjustment Mechanism (CBAM) is designed to address the risk that some carbon-intensive goods could gain a cost advantage by being produced under less stringent climate rules. The EU’s broader ETS framework also phases down free allocation in certain sectors as the new system develops.

How More Free Allowances Could Affect Industrial Investment

If adopted, the extra allowances could lower carbon costs for eligible industrial installations during 2026–2030. The impact on each business would depend on its emissions, allocation level, and the market price of allowances.

The proposal also points to a wider policy choice. Governments want European businesses to stay competitive. They also want companies to invest in energy efficiency, electrification, and lower-carbon production.

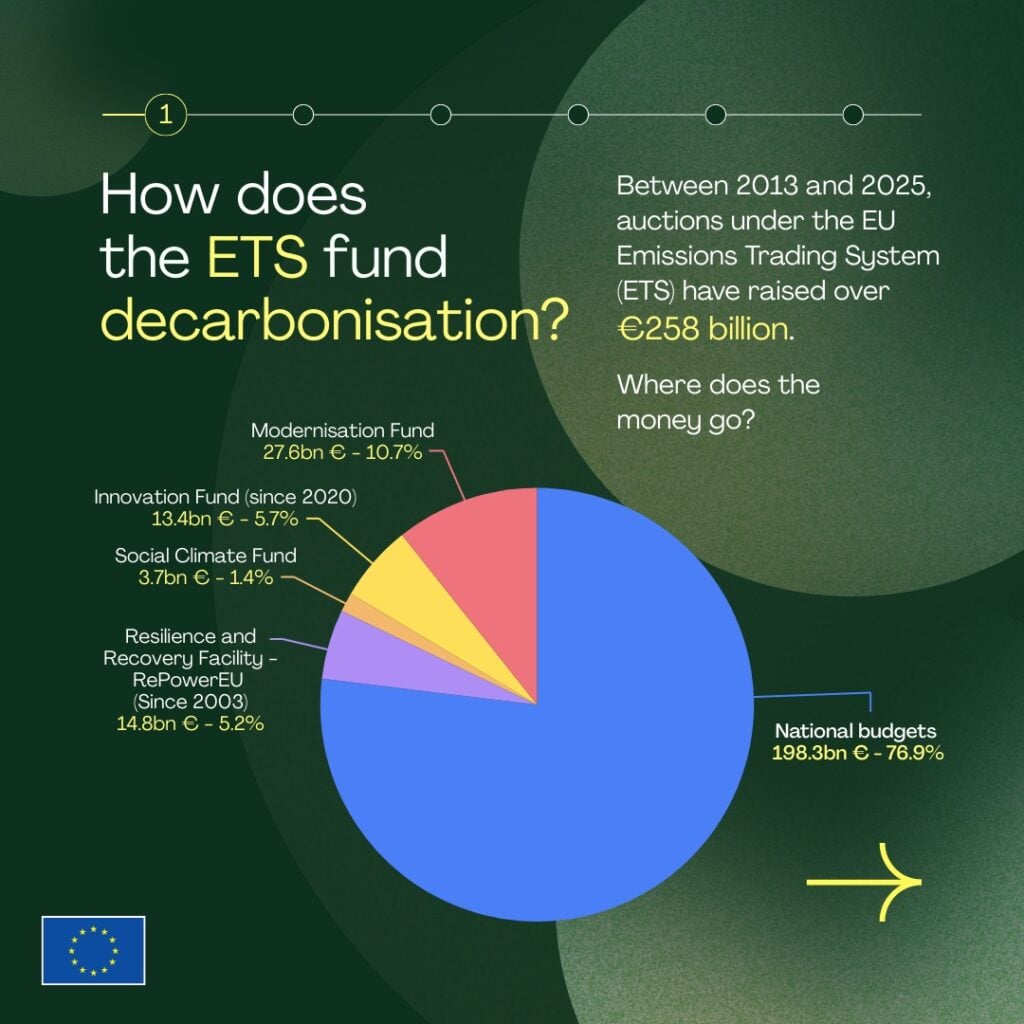
The Innovation Fund and Modernisation Fund are important parts of this effort. EU ETS revenues have helped finance renewable energy, energy efficiency and low-carbon technologies. The European Commission says the system has raised more than €175 billion since 2013.

EU ETS revenue 2025
Source: EC

For companies, free allowances can reduce near-term costs, but they do not remove the need to plan for tighter climate rules. Businesses that improve efficiency and reduce emissions may be better placed to manage future carbon costs as the emissions cap declines.

The Next Test for Europe’s Carbon Market

The next step is for the European Parliament and the Council to reach an agreement on the final rules. The result will show how many allowances can be freely allocated. It will also decide how to split the rest between industry and climate-related funds.

The decision matters beyond the immediate cost relief. The EU is trying to balance industrial competitiveness with a carbon market that continues to reward emissions cuts. Its official data show that covered emissions are falling, while its 2030 and 2050 targets require further progress.

The final design will determine how the EU shares the cost of that transition. More free permits could ease pressure on eligible industries, but the long-term test will be whether the system continues to support investment and deliver emissions reductions.

The post EU Carbon Market Shake-Up: Nearly 100 Million More Free Permits for Industry appeared first on Carbon Credits.
Nickel Price Rises Above $16,000 as Chinese Producers Weigh Indonesia Output Cuts

nickel

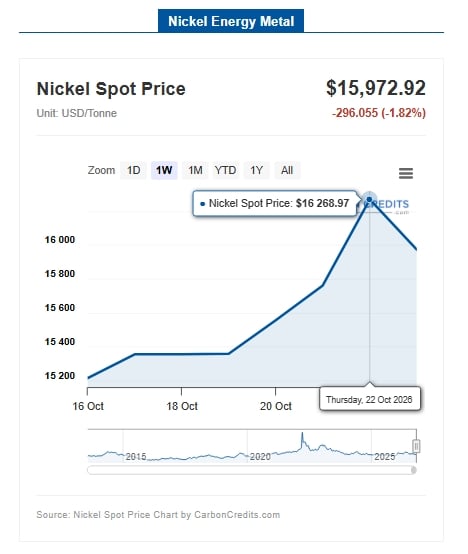
Nickel prices climbed above $16,000 per tonne on the London Metal Exchange (LME) as the prospect of production cuts by Chinese producers in Indonesia raised hopes of tighter supply. The rally marked a fourth consecutive day of gains after prices hit a nine-month low, giving the metal some relief from persistent oversupply concerns.

Nickel rose as much as 2.7% on October 21 before trading 2.1% higher at $16,005 per tonne. The rebound narrowed the metal’s decline for 2026 to less than 4%.

Bloomberg said that the price recovery reflects growing expectations that producers could reduce output to address weak prices and rising operating costs. However, the global nickel market still faces a supply surplus, and the strength of the rally will depend on whether proposed production cuts become actual reductions.

nickel prices

Nickel Price Analysis: Why Is the Metal Rising?

The latest rally follows growing speculation that major Chinese nickel producers could coordinate production cuts at their Indonesian operations. These facilities include high-pressure acid leaching (HPAL) plants that produce mixed hydroxide precipitate (MHP), an intermediate material used to manufacture battery chemicals.

Bloomberg further reported that executives from several major Chinese producers are considering potential output curbs. A previous attempt to agree on reductions in August failed to produce a deal.

Market participants are now focusing on the potential scale of the cuts. Gao Yin, an analyst at Shuohe Asset Management, told Bloomberg that the production reductions being discussed in the market were significant.

Production Cuts and Short-Covering Support Nickel Prices

Hopes for lower production have supported nickel prices by raising expectations of tighter supply. Indonesia is the world’s largest nickel producer, so changes in its output can affect global supply and prices.

Short-covering has also helped prices recover, according to Trading Economics. This happens when traders buy back nickel contracts to close bets on falling prices, adding to buying pressure.

However, the rebound does not guarantee a lasting recovery. Prices will depend on Indonesia’s production decisions, stainless steel demand, battery trends, and the growth of new supply.

LME Nickel Price Curve Signals Higher Future Prices

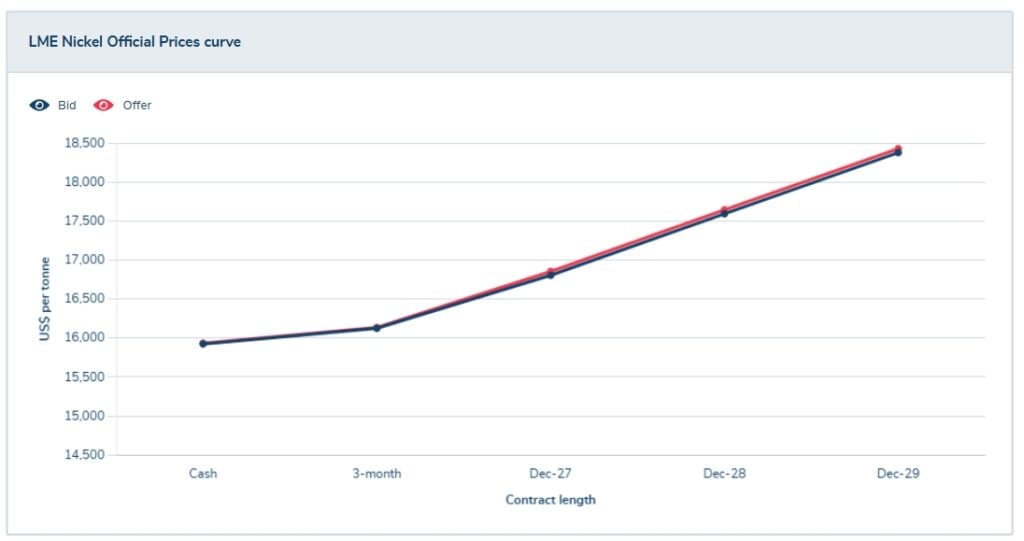
The LME nickel price curve shows that nickel prices are higher for contracts with longer delivery dates. Prices rise from around $15,900 per tonne for immediate delivery to approximately $18,400 per tonne for December 2029.

This upward trend suggests the market expects nickel prices to be higher in the future, although the curve reflects current market pricing rather than a guaranteed forecast.

LME nickel
Source: LME

Indonesia’s Production Cuts Could Tighten Supply

Indonesia’s nickel industry faces pressure from weaker selling prices, rising costs, and tighter mining quotas. These conditions have increased the incentive for producers to reconsider production levels.

Under its annual work plan and budget system, known as RKAB, the country approved a lower nickel ore production quota for 2026 than for 2025. The International Nickel Study Group (INSG) noted that Indonesia’s quota decisions consider supply and demand conditions. Applications for 2027 quotas are due by November 15, 2026.

Weather Disruptions and Weak Production Add to Supply Risks

Weather-related disruptions have added another supply risk. Bloomberg earlier reported that water shortages linked to El Niño forced nickel smelters at the Morowali Industrial Park to reduce nickel pig iron (NPI) production. The potential impact was estimated at 100,000 tonnes.

NPI is a lower-grade nickel product primarily used in stainless steel production. Reduced NPI output could tighten supply in that segment, while potential cuts at HPAL facilities could affect nickel intermediates used in battery manufacturing.

These developments could support prices if they lead to meaningful production losses. However, lower mining quotas and temporary operating disruptions do not automatically translate into a sustained global shortage, particularly when producers continue to expand processing capacity.

  • IEA further added that low prices continued to hurt nickel production outside Indonesia, with mined output falling by over 10% and refined production declining by nearly 3%.

Indonesia nickel

The Northern Miner reported that Chinese-backed projects in Indonesia have expanded capacity for both stainless steel and battery materials, adding to the challenge of balancing supply with demand.

INSG Forecasts Nickel Surplus in 2026 and 2027

Despite the recent price gains, the global nickel market is expected to remain in surplus, according to the INSG’s October outlook.

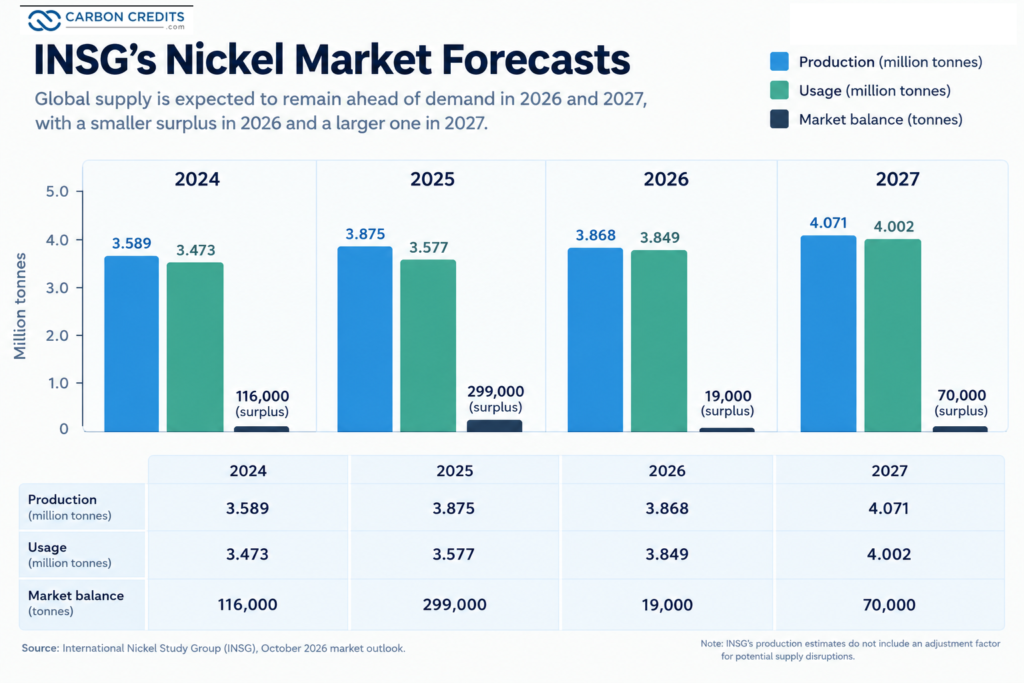
The intergovernmental group revised its 2026 forecast from a 32,000-tonne deficit in April to a 19,000-tonne surplus. The earlier projection would have marked the first annual supply shortfall since 2021.

The revision reflects stronger expected production growth than previously anticipated. Both supply and demand have increased in the group’s estimates, but production remains slightly ahead of consumption.

The INSG’s latest forecast is explained below in detail:

nickel forecast

The forecasts suggest that the market surplus will narrow substantially in 2026 before expanding again in 2027. Although this year’s projected surplus is relatively small compared with 2025, it still indicates that expected production exceeds consumption.

The INSG also cautioned that its production estimates do not account for an adjustment factor for potential supply disruptions. Actual output could therefore differ from the forecast.

Stainless Steel and EV Battery Demand Remain Key Drivers

Nickel demand depends heavily on stainless steel manufacturing, with rechargeable batteries providing another important source of consumption.

According to the World Stainless Association, global stainless steel melt shop production increased 5% year over year in the first half of 2026. The INSG expects the sector to expand further in the second half of this year and throughout 2027.

Growth in stainless steel production could help absorb additional nickel supply. However, the outlook for electric vehicle (EV) batteries remains less certain.

IEA Forecast:

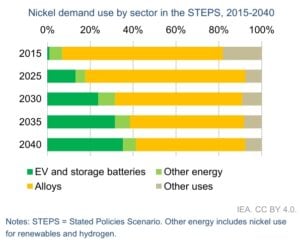
The IEA expects batteries to account for 30% of total nickel consumption by 2035, driving nearly two-thirds of demand growth. Demand is likely to come mainly from battery makers outside China, particularly in North America and Europe, where consumers favor long-range electric vehicles (EVs).

nickel demand

However, the growing adoption of lithium iron phosphate (LFP) batteries, which do not require nickel, could limit battery-grade nickel demand. Nickel-based batteries will remain important for some EV applications, but their adoption rate will influence how quickly new supply is absorbed.

Can Nickel Prices Sustain the Rebound?

Nickel’s rise above $16,000 per tonne shows how prices can react to expected production cuts. However, Indonesia’s producers have yet to agree on the proposed reductions, so actual supply cuts remain uncertain.

The INSG expects a small surplus of 19,000 tonnes in 2026, rising to 70,000 tonnes in 2027. This suggests oversupply risks will persist, especially if battery demand grows more slowly than expected.

For now, nickel prices will depend on actual production cuts, Indonesia’s mining quotas, and demand from stainless steel and battery makers. Without lower supply or stronger demand, the recent rally may be short-lived.

RECENT: Sumitomo Projects 34,000-Ton Nickel Surplus in 2027 Amid Indonesia Output Recovery 

The post Nickel Price Rises Above $16,000 as Chinese Producers Weigh Indonesia Output Cuts appeared first on Carbon Credits.
Article 6 Carbon Market Deals Rise 14% as Countries Build Global Trading Network

Article 6 Carbon Market Deals Rise 14% as Countries Build Global Trading Network

International carbon market cooperation is gaining ground as more countries sign agreements to trade carbon credits under the Paris Agreement. However, a new report highlights a big challenge: turning agreements into verified emissions reductions. Countries need these reductions to reach their climate goals.

The 2026 Article 6 Implementation Status Report, released by the Paris Agreement Article 6 Implementation Partnership (A6IP), found that bilateral carbon market arrangements rose 14% in one year, reaching 113 by July 2026. These arrangements allow countries to work together on projects that reduce or remove greenhouse gas emissions.

The report also found that countries are making progress on approval rules, carbon registries, and emissions tracking. Yet, many governments still lack the systems needed to fully carry out international carbon trading.

For carbon project developers and investors, the findings point to a growing market opportunity. More countries are building the rules for cross-border carbon deals, but the pace of actual credit transfers will depend on how quickly they can put those systems into practice.

Article 6 Agreements Reach 113 as Global Cooperation Expands

The report recorded 113 bilateral arrangements in 2026, up from 99 in 2025. Of these:

  • 61 were memorandums of understanding (MoUs),
  • 44 were bilateral agreements, and
  • 8 fell into other categories, such as declarations or statements of intent.

These arrangements provide a starting point for countries to cooperate on emissions-cutting projects and the transfer of carbon credits. However, an MoU or other arrangement does not automatically authorize projects or allow credits to be transferred.

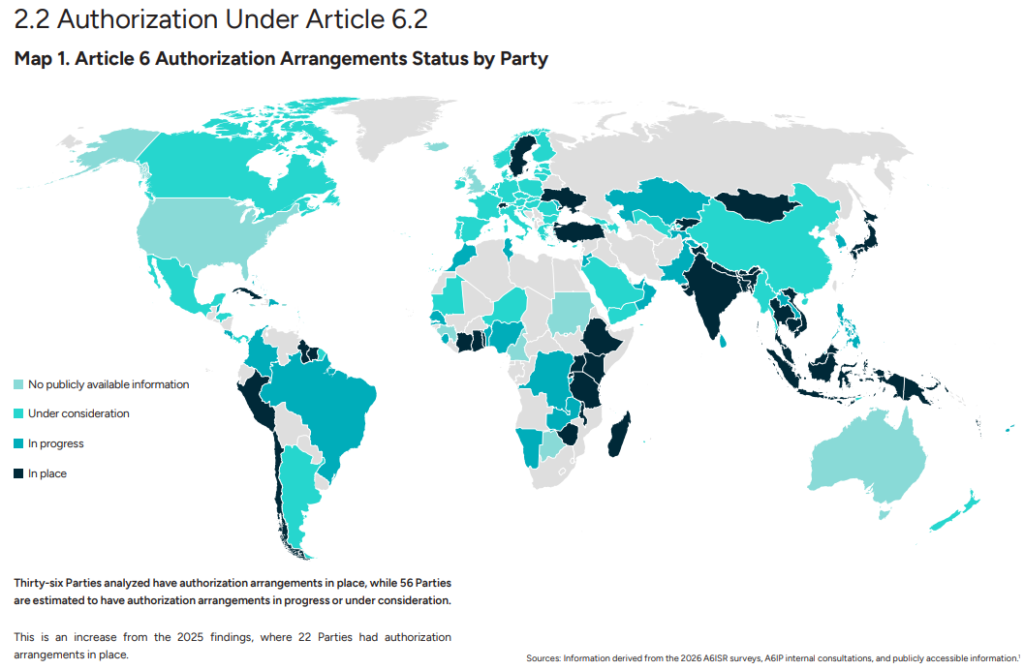
Article 6 Authorization Arrangements Status
Source: A6IP

The report identified 68 countries taking part in bilateral cooperation: 58 host countries and 10 countries seeking to acquire emissions reductions.

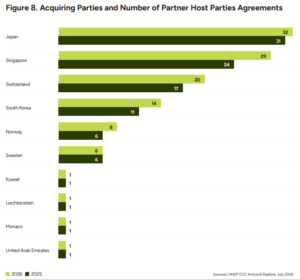
Japan remained the leading acquiring country, with 32 agreements. Singapore followed with 29, up from 24 in 2025. Switzerland increased its agreements from 17 to 20, while South Korea rose from 11 to 14.

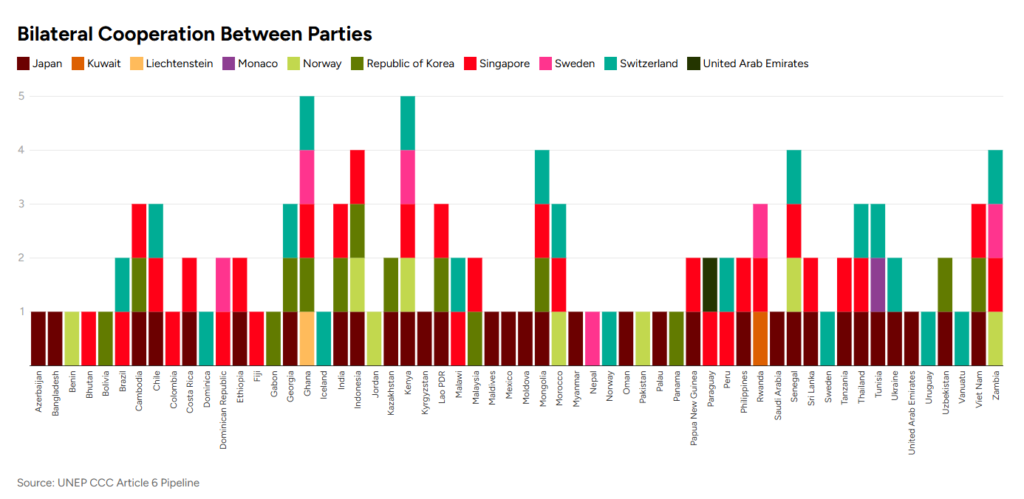
Among host countries, Ghana and Kenya had the highest engagement, each working with five acquiring countries. Indonesia, Mongolia, Senegal, and Zambia followed, each with four partners.

Acquiring Parties and Number of Partner Host Parties Agreements
Source: A6IP

These figures show that international carbon cooperation is spreading across regions. They also highlight the growing role of Asian countries in building cross-border carbon markets.

More Countries Are Preparing to Authorize Carbon Credits

Bilateral agreements are only one part of the process. Countries also need rules for deciding which projects can generate credits for international transfer.

Under Article 6.2 of the Paris Agreement, countries can cooperate by transferring internationally transferred mitigation outcomes, or ITMOs. These transfers need government approval and clear records. This stops the same emissions reduction from counting for more than one country’s climate goal.

The A6IP report found that 36 countries had authorization arrangements in place, compared with 22 in the 2025 report. Another 56 were developing or considering these arrangements.

Article 6 Bilateral Cooperation Between Parties
Source: A6IP

Tracking systems are also advancing. Sixteen countries had systems in place to track ITMOs, while many others were still developing or considering them.

However, only 15 of the 106 countries analyzed had both authorization and tracking arrangements in place. Just 23 had submitted initial reports to the United Nations Framework Convention on Climate Change (UNFCCC).

This gap matters. Countries must know who can approve credit, how to track it, and how to report transfers. This knowledge is key for confident international trading.

Actual Carbon Transfers Remain Small

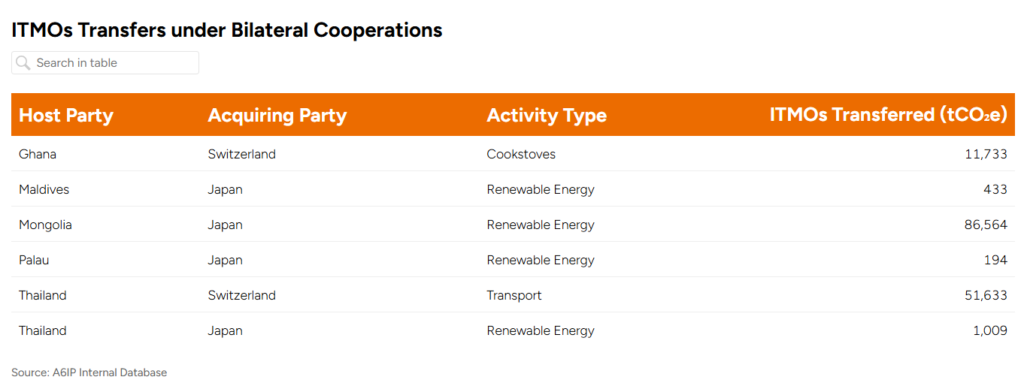
The report’s figures show why the growth in agreements should not be mistaken for a mature trading market. By July 2026, countries had transferred 151,566 tonnes of carbon dioxide equivalent (tCO₂e) in ITMOs under bilateral cooperation, according to the report.

ITMOs Transfers under Bilateral Cooperations
Source: A6IP

This is a small volume compared with the number of agreements and projects being developed. It shows that many countries are still building the systems needed to move from policy commitments to completed transactions.

The report also tracked progress under Article 6.4, which created the Paris Agreement Crediting Mechanism (PACM), a centralized United Nations system for issuing carbon credits.

By the report’s cutoff, host countries had approved 415 activities for transition from the earlier Clean Development Mechanism. Two transitioned programs of activities had generated about 1.11 million Article 6.4 emission reductions (A6.4ERs).

These developments show that different parts of the Paris Agreement carbon market are progressing at different speeds. The next challenge is to convert project pipelines and approvals into credits. These credits must follow the rules and be usable for their intended purposes.

Singapore and Southeast Asia Build New Opportunities

Recent developments in Southeast Asia offer a clear example of how Article 6 cooperation is moving forward.

Singapore and Laos signed an implementation agreement in September 2026 and agreed on 58 eligible carbon credit methodologies. The list covers areas such as forestry, agriculture, methane reduction, biochar, and renewable energy.

The agreement gives project developers a clearer starting point for preparing eligible projects in Laos. However, the 58 methodologies do not represent 58 approved projects. Individual projects must still meet the countries’ requirements before credits can be authorized for international transfer.

Singapore’s network of 29 bilateral arrangements also makes it one of the most active acquiring countries in the report. Its agreements aim to provide access to eligible international carbon credits as the country works toward its climate targets.

Indonesia is another important market to watch. Its government is developing the systems needed to participate in Article 6.2 cooperation, including preparation of its initial report. The Philippines is still working on its national carbon market framework. It is also assigning the relevant authorities, as noted in the A6IP report.

These examples show that countries are at different stages. Some are already transferring credits, while others are building national rules, registries, and project approval processes.

Carbon Project Developers Still Face Readiness Gaps

The report highlights a growing need for technical support as countries move toward implementation.

Governments need clear laws, trained officials, carbon registries, and systems to measure, report, and verify emissions reductions. They also need to decide which project types are eligible and how to protect their own climate targets when credits are transferred abroad.

For project developers, these rules affect how quickly projects can move from planning to approval and credit issuance. Unclear procedures can increase costs and delay investment.

The report identified 38 support programs focused on policies and frameworks, 34 focused on project development and methods, and 16 focused on registries and infrastructure. Another 54 programs covered knowledge-sharing and other forms of support.

These efforts are important because signing an agreement is only the first step. Countries must also show that projects deliver real emissions cuts or removals, avoid double counting, and meet the reporting requirements of the Paris Agreement.

For buyers and investors, the main opportunity is a growing pipeline of potential projects. The main risk is that delays in national systems may slow the supply of credits that are ready for transfer.

Can Article 6 Turn More Agreements Into Verified Carbon Credits?

The 2026 report points to clear progress in international carbon market cooperation. Bilateral arrangements are growing, more countries are preparing authorization systems, and new projects are moving through the Paris Agreement’s crediting mechanisms.

However, the gap between agreements and actual transfers remains wide. Countries still need stronger tracking, reporting, and approval systems to support a market that buyers and governments can trust.

For Asia, the growth of Singapore’s network and ongoing work in countries such as Laos, Indonesia, and the Philippines show how Article 6 could support investment in emissions-cutting projects.

The next stage will be measured not by the number of agreements signed, but by how many projects deliver verified emissions reductions and how effectively countries authorize, track, and transfer those results.

The post Article 6 Carbon Market Deals Rise 14% as Countries Build Global Trading Network appeared first on Carbon Credits.
Amazon (AMZN), American Electric Power (AEP), and X-energy (XE) Explore 960-MW SMR Nuclear Project in Indiana

American Electric Power (NASDAQ: AEP) is exploring a 960-megawatt (MW) nuclear power project in Indiana with Amazon (NASDAQ: AMZN) and advanced reactor developer X-energy (NASDAQ: XE). The proposed facility could help meet rising electricity demand from data centers and other energy-intensive industries while adding carbon-free power to the regional grid.

Announced on October 19, 2026, the project would use small modular reactors (SMRs) at the former Breed Generating Station site in Sullivan County. Amazon will support development funding and intends to purchase electricity under a long-term contract if the project advances.

The partnership highlights growing interest in nuclear energy as U.S. electricity demand increases. However, the project remains in the feasibility stage, and the companies have not made a final investment decision.

AEP Plans 960 MW of Advanced Nuclear Capacity

The proposed facility would include 12 Xe-100 reactors developed by X-energy. Each reactor would generate 80 MW, bringing the project’s planned capacity to 960 MW.

The companies are evaluating the former site of Indiana Michigan Power’s Breed Generating Station, a retired coal-fired power plant. The location could support a new generation project while creating economic opportunities in Sullivan County.

The partnership combines AEP’s power generation and nuclear operating expertise with X-energy’s reactor technology and Amazon’s financial support and planned electricity purchases.

Bill Fehrman, AEP chairman, president and chief executive officer, said:

“Advanced nuclear energy has the potential to provide dependable power for over half a century while supporting economic growth in our communities. With this development plan, we are working to bring together the resources to help meet unprecedented growth in energy demand with reliable baseload power while protecting affordability for existing customers,” said “Our agreements with Amazon and X-energy will provide all necessary capital protections and financial safeguards that we have said are essential for any potential nuclear project to move forward.”

Source: X-Energy

Amazon’s Long-Term Power Deal Could Protect AEP Customers

Amazon intends to buy power through a long-term agreement designed to cover the facility’s construction and operating costs for the contract period. This arrangement could give the project a more predictable revenue stream while helping protect AEP’s existing customers from its financial risks.

AEP has emphasized that any potential nuclear development must include appropriate capital protections and financial safeguards. The companies must assess feasibility, costs, and other development requirements before deciding whether to proceed with construction.

If completed, the facility could operate for more than 60 years, creating jobs, expanding the local tax base and strengthening Indiana’s electricity infrastructure.

Josh Weissman, VP of Data Center Infrastructure Capacity Delivery at Amazon, said:

“At Amazon, we are committed to serving the needs of our customers and achieving our Climate Pledge goal to be net-zero carbon across our operations by 2040. This collaboration with AEP and X-energy would enable us to make progress on both while ensuring that Indiana’s communities benefit. Together, we’re looking to develop nearly a gigawatt of carbon-free power for the regional grid and pay our full costs without passing them to others. This project would also create jobs and generate tax revenues to benefit Hoosier communities for decades to come.”

Amazon’s Growing Investment in Nuclear Power

Amazon’s involvement reflects the growing need for dependable electricity to support cloud computing and artificial intelligence (AI).

Data centers require substantial amounts of electricity to run servers, cooling systems, and networking equipment. As technology companies expand AI services, securing reliable power has become an increasingly important part of their growth strategies.

Nuclear power can generate electricity around the clock without direct carbon dioxide emissions during operation. It can therefore help meet continuous electricity demand while supporting corporate decarbonization goals.

Amazon aims to reach net-zero carbon emissions across its operations by 2040. The proposed Indiana facility could support that objective while supplying electricity to the wider regional grid.

  • The project also fits into Amazon’s broader collaboration with X-energy to deploy more than 5 gigawatts (GW) of new nuclear capacity in the United States by 2039.

However, the Indiana development remains subject to feasibility assessments, regulatory requirements, financing and construction decisions.

For Amazon investors, the potential benefit lies in securing long-term electricity supplies for its expanding cloud and AI infrastructure. The proposed facility could also support its efforts to reduce operational emissions. Neither benefit is guaranteed at this stage, as the project has yet to move into construction.

U.S. Nuclear Power Capacity Reaches Nearly 98.4 GW

The United States operates the world’s largest commercial nuclear power fleet. According to the U.S. Energy Information Administration (EIA), the country had 94 operating commercial nuclear reactors at 54 power plants across 28 states as of March 2026. Their combined net summer generating capacity was approximately 98.4 GW.

us nuclear

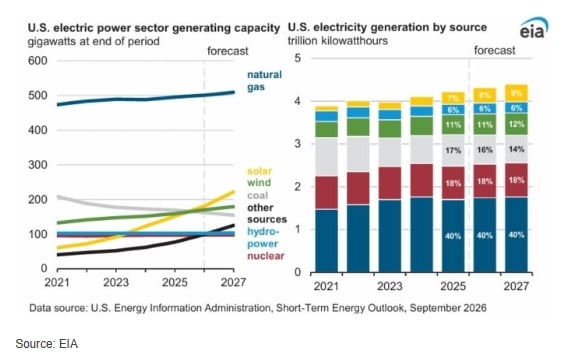
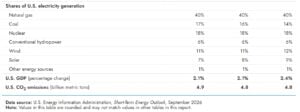
Nuclear energy remains an important part of the country’s electricity mix. The EIA reported that nuclear power supplied about 18% of U.S. utility-scale electricity generation in 2025. Its September 2026 outlook also projected nuclear power’s share would remain around 18% in 2026 and 2027.

US NUCLEAR CAPACIY

Electricity demand is rising as data centers and industrial facilities expand. The EIA also reported that total U.S. electricity generation reached a record 4,429 billion kilowatt-hours in 2025, up 2.8% from 2024. It expects generation to continue growing in 2026 and 2027.

The proposed Indiana project would add 0.96 GW of capacity, equivalent to roughly 1% of the existing U.S. nuclear fleet’s net summer capacity. Although relatively small compared with the national fleet, the project could contribute to efforts to expand dependable, low-carbon electricity supplies.

Small Modular Reactors Could Support Future Growth

Traditional nuclear power plants typically use large reactors, while SMRs are designed around smaller individual units that can be deployed together. The proposed Indiana facility would group its 12 reactors into sets of four.

This approach could offer flexibility when adding generating capacity, but SMRs still face challenges involving licensing, construction costs, financing and commercial deployment. The Indiana project must overcome these hurdles before it can supply electricity.

The broader nuclear industry is also exploring ways to increase output by extending existing plants’ operating lives, restarting retired reactors and developing new facilities. These options could help utilities respond to rising demand while reducing reliance on fossil-fuel generation.

What the Nuclear Project Means for AEP Stock

For AEP, the agreement offers an opportunity to evaluate additional generation capacity as electricity demand grows. The company plans to invest $78 billion from 2026 through 2030 to improve its electricity infrastructure and support customer needs.

Amazon’s proposed long-term power purchase could strengthen the project’s commercial case. Its development funding and planned electricity purchases are intended to help protect AEP customers from project costs.

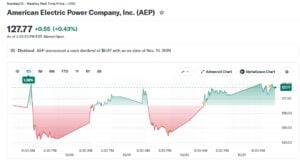
AEP stock
Source: Yahoo Finance

However, investors should distinguish between a development agreement and an operating power plant. The proposed facility will not immediately add to AEP’s generating capacity or earnings. Its eventual financial impact will depend on construction costs, contract terms, regulatory approvals, and operating performance.

For Amazon, the project could provide a long-term source of reliable electricity for data centers while supporting its climate ambitions.

The partnership illustrates how utilities and technology companies are exploring nuclear energy to meet growing power needs. Its progress will depend on whether the partners can turn the development agreement into a technically feasible and commercially viable project.

The post Amazon (AMZN), American Electric Power (AEP), and X-energy (XE) Explore 960-MW SMR Nuclear Project in Indiana appeared first on Carbon Credits.
Tesla (TSLA) Q3 Earnings Shock: Carbon Credit Revenue Crashes 73%, Profits Sink 43%

Tesla (NASDAQ: TSLA) reported nearly flat third-quarter 2026 revenue as declining automotive regulatory credit sales and lower vehicle deliveries weighed on its financial performance. The electric vehicle (EV) maker generated $28.05 billion in revenue, while net income attributable to common stockholders fell 43% year over year to $787 million.

The results highlight Tesla’s changing business model as it invests in artificial intelligence (AI), robotics and battery storage. While its energy storage deployments increased, revenue from automotive regulatory credits continued to decline, reducing a historically important source of high-margin income.

According to Tesla’s Q3 2026 earnings update, the company generated $1.53 billion in free cash flow and ended the quarter with $45.45 billion in cash, cash equivalents and short-term investments.

Tesla Q3 2026 Earnings: Key Financial Results

Tesla’s total revenue was broadly unchanged from $28.10 billion in Q3 2025. However, operating income fell 56% to $718 million as operating expenses increased and regulatory credit revenue declined.

Its adjusted earnings per share were $0.48, compared with $0.50 a year earlier.

Here’s the complete breakdown of the results:

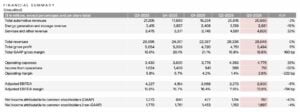
tesla Q3
Source: Tesla

The company’s free cash flow was $1.53 billion, down 62%.

Operating expenses rose 39% to $4.78 billion, driven partly by research and development spending. Capital expenditure increased 110% to $4.73 billion as Tesla expanded its infrastructure and invested in future technologies.

Tesla Carbon Credit Revenue Drops to $113 Million

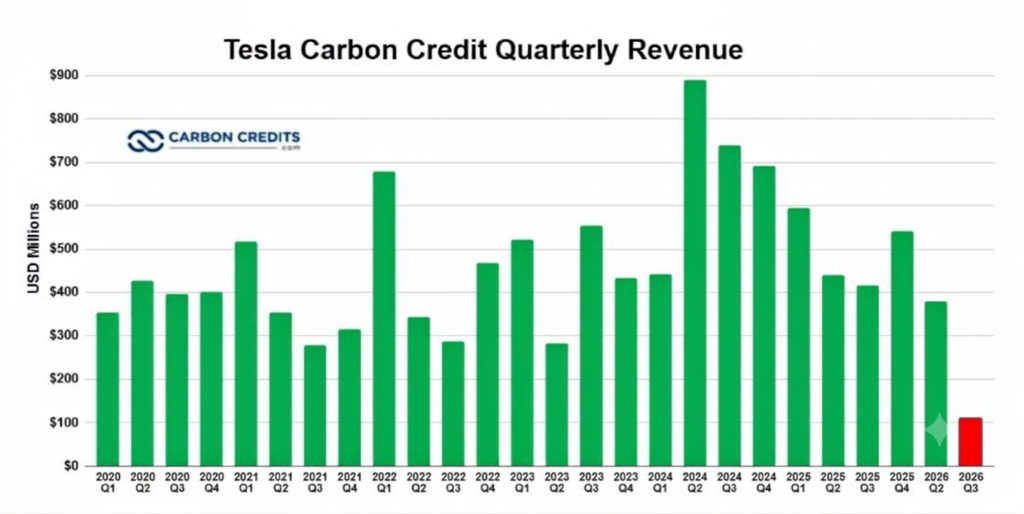
  • Tesla’s automotive regulatory credit revenue fell to $113 million in Q3 2026, down 73% from $417 million in Q3 2025. Revenue also declined 23% from $146 million in Q2 2026.

The credits accounted for approximately 0.4% of Tesla’s total quarterly revenue, compared with 1.5% a year earlier. Tesla cited lower regulatory credit revenue as a factor weighing on both revenue and operating income.

The decline follows a broader downturn in Tesla’s credit business. In 2025, the company generated $2.76 billion from regulatory credits, a record high in 2024, before annual credit revenue fell 28% to approximately $2 billion in 2025. The quarterly figures show that the decline has continued into 2026.

tesla carbon credits
Data Source: Tesla

Tesla earns this revenue by selling surplus automotive regulatory credits to other automakers that need them to comply with emissions requirements. These credits have historically supported profitability because they provide revenue without the manufacturing costs associated with selling vehicles.

However, as more automakers expand their EV lineups, some need fewer credits from Tesla. Changes in emissions policies and compliance requirements can also affect demand. The latest results underline the financial impact of this shift as Tesla faces pressure to generate more earnings from its core businesses.

Vehicle Deliveries and Automotive Revenue Face Pressure

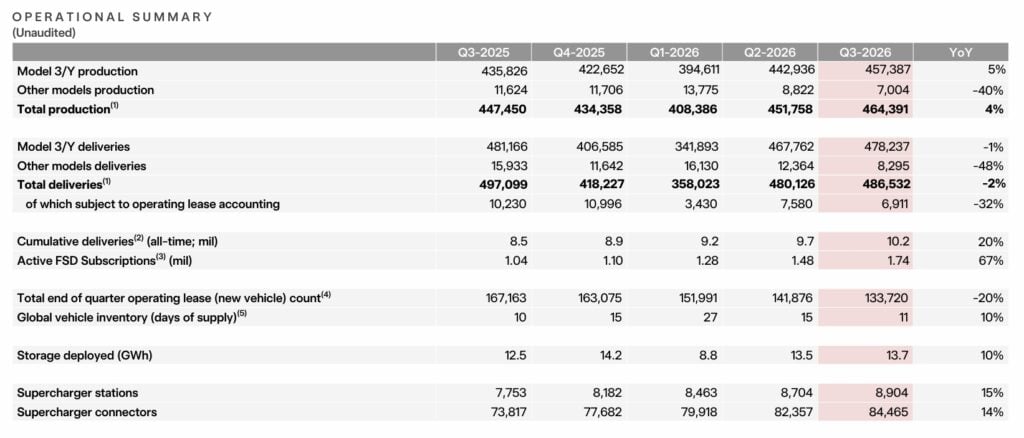
Tesla delivered 486,532 vehicles during the quarter, down 2% year over year, despite producing 464,391 vehicles, up 4%.

Automotive revenue reached $20.56 billion, down 3% from a year earlier. The company also cited lower average selling prices and fewer deliveries as factors affecting revenue.

Services and other revenue increased 33% to $4.61 billion, supported partly by growth in automotive ancillary sales and Full Self-Driving (Supervised) subscriptions. Active FSD subscriptions reached 1.74 million, up 67% year over year.

These businesses could help diversify Tesla’s revenue as regulatory credit income becomes less significant. However, higher research and development costs and investments in AI and robotics continue to weigh on near-term profitability.

tesla automotive

Tesla Energy Storage Business Offers a Growth Opportunity

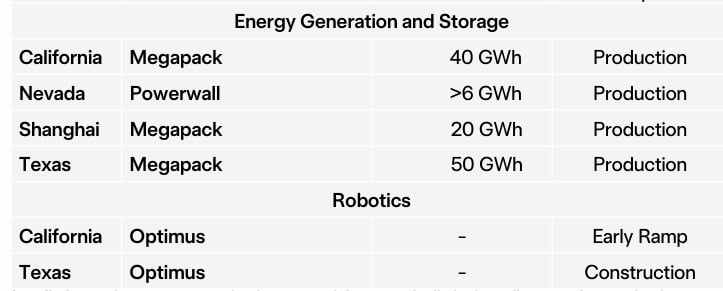
Tesla’s energy generation and storage revenue declined 16% year over year to $2.88 billion. However, the company deployed 13.7 gigawatt-hours (GWh) of energy storage products, up 10% from Q3 2025.

Tesla said demand remained strong, with its highest-ever quarterly order rate and backlog. Production also began at Megafactory Texas, which has a planned annual capacity of 50 GWh.

The energy storage business could benefit from rising electricity demand from data centers and the expansion of renewable energy. Grid-scale battery systems, including Tesla’s Megapack, can store electricity and help manage fluctuations in demand, support grid reliability, and integrate variable renewable power.

tesla battery storage
Source: Tesla

Tesla expects data center demand to support future storage sales. Still, the latest revenue decline shows that strong orders and deployment growth do not always translate into higher quarterly revenue.

What Tesla’s Earnings Mean for Investors

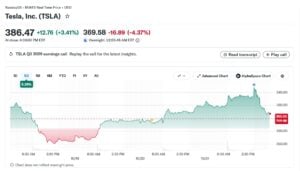
Tesla’s Q3 2026 results show why investors are watching its transition beyond vehicle manufacturing. TSLA shares traded at $386.96 on October 21, 2026, gaining 3.55%.

tesla stock
Source: Tesla

The company’s $45.45 billion cash position provides financial flexibility to fund its expansion. However, Tesla will need stronger operating performance to offset the declining contribution from regulatory credits and support its investments in AI, robotics, and energy storage.

For the clean energy market, battery storage remains an important growth opportunity as power demand rises and electricity grids adapt to renewable energy. For Tesla (TSLA stock) investors, the challenge will be turning that opportunity into sustained revenue growth and stronger profitability as its traditional credit business loses importance.

The post Tesla (TSLA) Q3 Earnings Shock: Carbon Credit Revenue Crashes 73%, Profits Sink 43% appeared first on Carbon Credits.
Citi’s $72 Million Carbon Removal Deal Bets on Biochar to Scale Climate Finance

Citi’s $72 Million Carbon Removal Deal Bets on Biochar to Scale Climate Finance

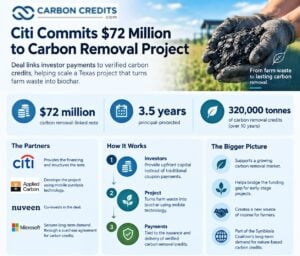
Citi has closed a $72 million carbon removal-linked note to help expand a Texas project that turns farm waste into biochar. The deal links investor payments to the delivery of verified carbon removal credits, creating a new way to finance projects that take carbon dioxide out of the atmosphere.

The 3.5-year, principal-protected note supports Applied Carbon’s mobile technology for processing agricultural waste. Nuveen, an investment firm, joined the deal. Microsoft supports long-term demand through its carbon credit purchase agreement with Applied Carbon.

The transaction highlights a growing challenge in the carbon removal market: projects need money to build and deploy equipment before they can produce credits. By linking finance to future carbon removal, Citi aims to help bridge that gap.

How Citi Links Investor Payments to Verified Carbon Removal

Citi structured the note so that investors give up traditional coupon payments in exchange for a different payment structure. An upfront amount goes toward financing Applied Carbon’s project. Investors then receive payments linked to the issuance and delivery of carbon credits generated by the project.

Sonia Battikh, Global Head of Carbon Offsets Trading at Citi, remarked:

“This Carbon Removal-Linked Note builds on Citi’s pioneering work linking bond performance to environmental outcomes and marks our first outcome bond tied to verified carbon removals. By bringing together investors, project developers and long-term carbon demand, we are continuing to expand the range of opportunities through which capital markets can finance real-world outcomes.”

The note is described as principal-protected and runs for 3.5 years. However, Citi has not publicly disclosed the full payment formula, the expected investor return, or the number of carbon removal credits tied to the transaction. The $72 million is the size of the note, not a disclosed price per tonne of carbon removed.

Citi calls the deal its first outcome bond tied to verified carbon removal. In an outcome-linked structure, financial returns depend in part on a measurable result. Here, that result is the issuance and delivery of carbon credits. This structure connects three parts of the carbon removal market:

  • investors who provide capital,
  • a developer that builds and operates the project, and
  • buyers that create demand for the credits.

If it works as intended, the model could help other projects attract funding before they generate all their expected carbon removal.

Citi’s $72M Carbon Removal Deal

Applied Carbon Turns Farm Waste Into Biochar

Applied Carbon uses mobile pyrolysis equipment to process crop residue into biochar. Pyrolysis heats organic material with little or no oxygen, turning it into a carbon-rich solid rather than allowing it to decompose or be burned in the open.

The company’s system can operate directly in fields or at field edges. It combines crop residue processing and biochar application in one pass, reducing the need to transport bulky agricultural waste to a separate facility. The company says this approach can make production more flexible across the farming cycle.

Biochar can store carbon in a relatively stable form when the material and its use meet the right conditions. Applying it to soil may also improve moisture retention and soil properties. But the amount of carbon stored for the long term depends on factors such as the feedstock, production process, biochar quality, and final use.

Applied Carbon biochar technology
Source: Applied Carbon

Applied Carbon announced a $21.5 million funding round in July 2024 to deploy its technology. The company has also been selected for U.S. Department of Energy carbon removal prize programs. The new Citi-linked note provides another financing route to support deployment.

Microsoft’s Credit Deal Helps Support Future Demand

A key part of the financing is the project’s existing relationship with Microsoft. In March 2022, Applied Carbon announced that Microsoft had selected its biochar project for its carbon removal portfolio. Citi says Microsoft has an offtake agreement for a portion of the credits generated by the project.

An offtake agreement is a contract to buy future production. For carbon removal projects, it can give developers a clearer view of future revenue, helping them plan investment and operations. It may also help lenders and investors assess whether a project can generate enough income to support its financing.

However, the deal does not mean every tonne of expected removal has already been delivered. The Citi note links payments to the issuance and delivery of credits, while the full credit volume and delivery schedule have not been disclosed publicly.

Carbon Removal Demand Rises as Biochar Production Expands

The financing arrives as carbon removal demand and biochar production expand, although the market still faces challenges in scaling supply. A 2026 review by Climeworks notes that, based on market data from BloombergNEF, CDR.fyi, and AlliedOffsets, carbon removal offtakes hit 64 million metric tonnes in 2025. This is an increase from 30 million tonnes in 2024.

Durable carbon removal offtakes rose from 8 million tonnes to 29 million tonnes over the same period. The report valued the overall carbon removal market at about $8 billion in 2025. These figures refer to contracted offtakes, not carbon removals already delivered or credits retired.

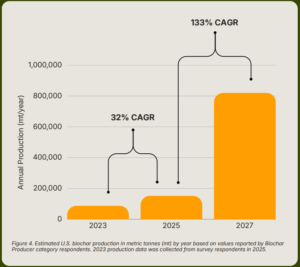
Biochar is part of this wider growth. The International Biochar Initiative’s 2025 Global Biochar Market Report found that global biochar production hit 520,810 metric tonnes in 2025. This is a rise from 180,150 tonnes in 2023.

US biochar production
Source: International Biochar Initiative

The report drew on responses from 930 stakeholders across 96 countries. Survey respondents projected production could reach 3.5 million tonnes by 2027 and 9.3 million tonnes by 2030. These are industry projections, not guaranteed outcomes.

The market still needs more investment. The same report identified limited access to capital as a barrier for 35% of respondents. A separate Climeworks review noted that carbon removal projects often need funding before construction, while buyers may prefer credits delivered years later. That gap makes financing models tied to future credit delivery potentially important.

How the Deal Fits Citi’s Wider Climate Finance Strategy

Citi’s note fits within its wider sustainable finance strategy. The bank has a goal to support $1 trillion in sustainable finance by 2030. It has also committed to net zero greenhouse gas emissions from its own operations by 2030 and from its financing activities by 2050.

These commitments cover different parts of Citi’s business. Financing a carbon removal project is not the same as cutting emissions from the bank’s own offices or reducing emissions linked to its lending and investment activities. The note should therefore be viewed as a financial product that supports a carbon removal project, rather than proof that Citi has met its own emissions targets.

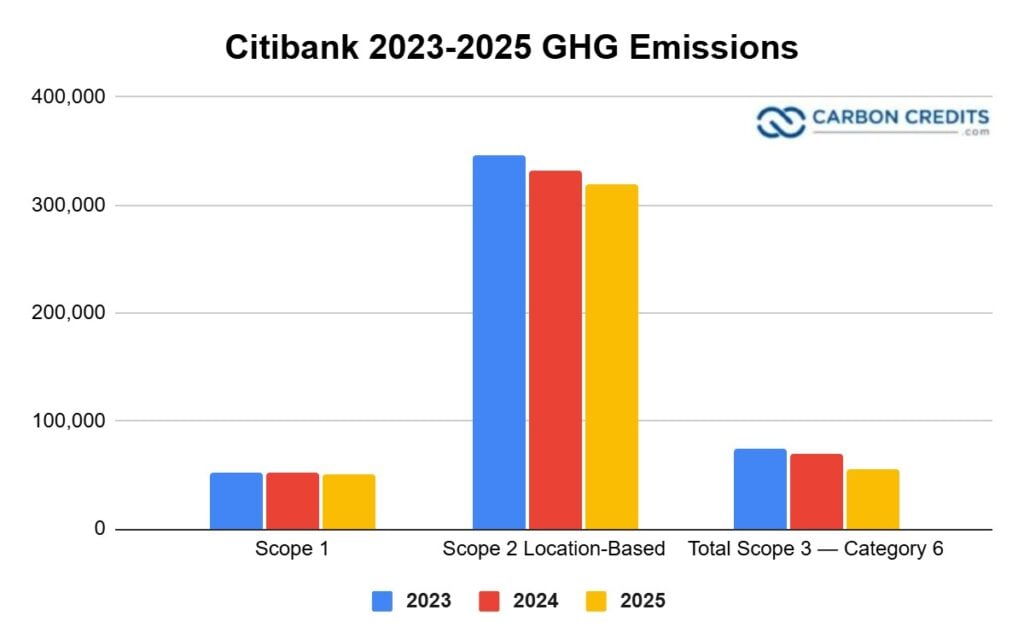
Yet, it is remarkable to note that Citi’s location-based Scope 1 and 2 emissions fell 3.8% in 2025 to 370,030 metric tons of CO₂e. The bank also reduced energy consumption by 43% from its 2010 baseline, surpassing its earlier 40% reduction target, while maintaining 100% renewable electricity sourcing in 2025. These results show progress in reducing emissions from its own operations, including buildings and electricity use.

Citibank GHG emissions 2025

Citi has previously structured sustainable finance products that link financial returns to environmental or social outcomes. The bank says this new note is its first outcome bond tied to verified carbon removals. The deal extends that approach into a market where developers often need large amounts of upfront capital, and buyers want confidence that credits will be delivered.

Verified Credits and Delivery Will Decide the Deal’s Success

The project’s climate value will depend on more than the size of the note. Credible carbon removal requires accurate measurement of how much carbon is stored, accounting for emissions from collecting and processing feedstock, and checks that the carbon remains stored for the period claimed.

Biochar can offer durable storage, but results vary by production method, material, and application. Project monitoring also needs to guard against overestimating the climate benefit or counting the same removal more than once.

Investors face a separate question: whether the project generates and delivers enough eligible credits, on time, to support the note’s payment structure. Citi has not disclosed the expected credit volume, price per tonne or investor returns, so the financial and climate outcomes cannot yet be fully assessed from public details.

Even so, the transaction offers a clear example of how banks, institutional investors, technology developers and corporate buyers can work together to finance carbon removal. Its longer-term significance will depend on whether Applied Carbon can scale its equipment, deliver verified credits and show that the model can support more projects.

The post Citi’s $72 Million Carbon Removal Deal Bets on Biochar to Scale Climate Finance appeared first on Carbon Credits.
Sweden Awards €840 Million to Three Carbon Capture Projects to Store 5.75 Million Tonnes of CO₂

Sweden Awards €840 Million to Three Carbon Capture Projects to Store 5.75 Million Tonnes of CO₂

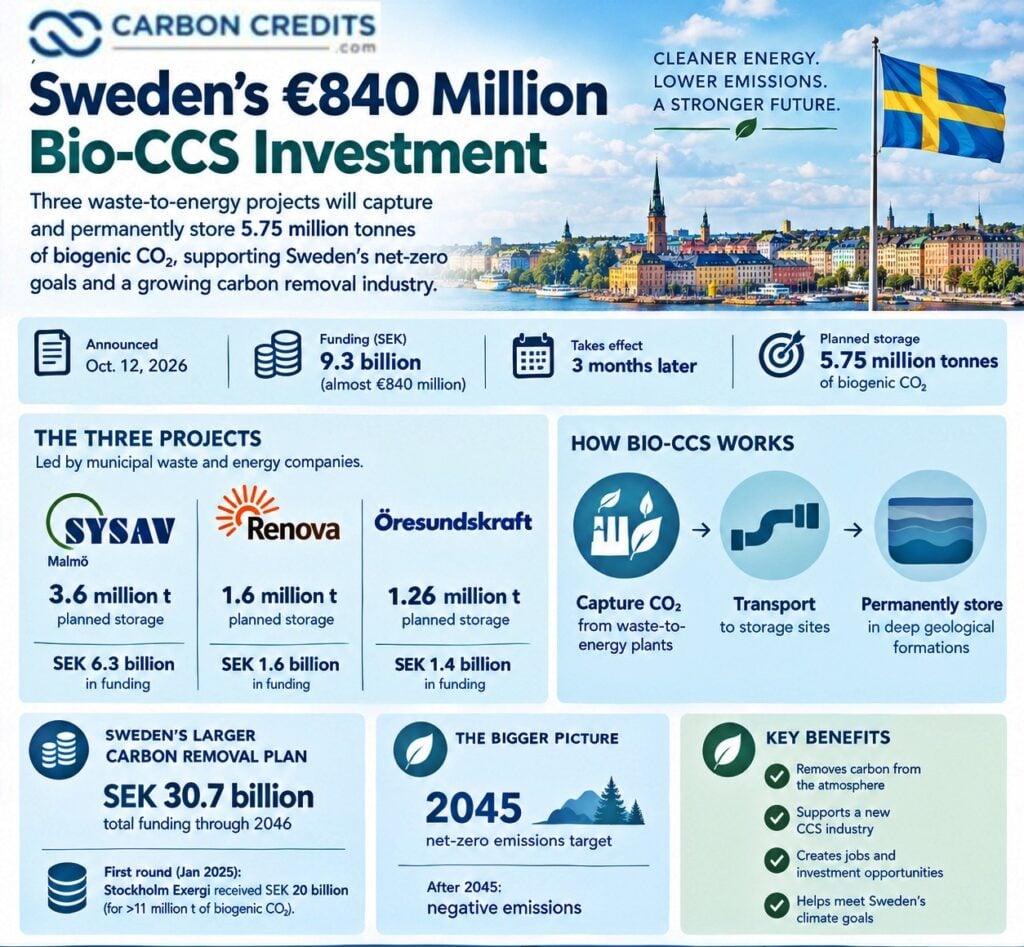
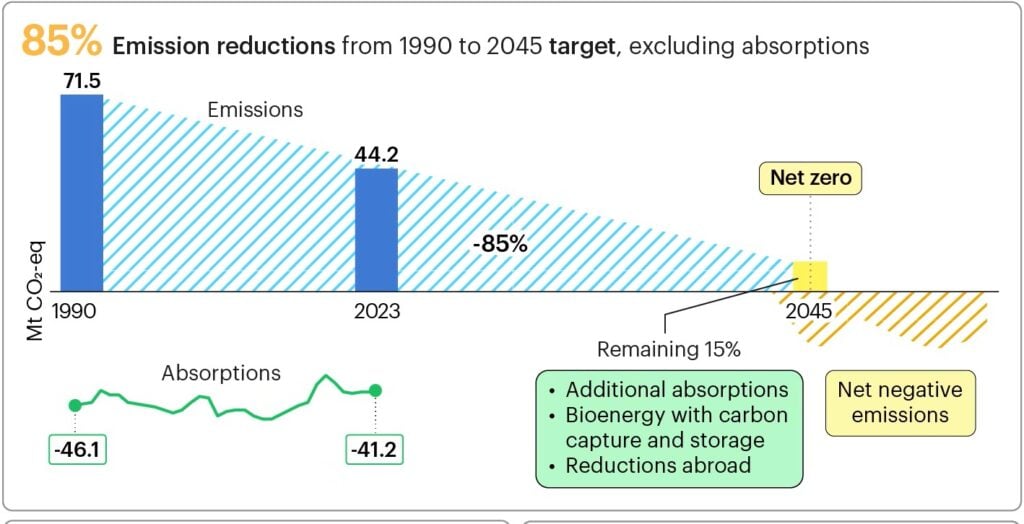
Sweden is committing €840 million to three carbon capture projects that aim to permanently store millions of tonnes of carbon dioxide (CO₂). The funding marks another step in the country’s plan to reach net-zero emissions by 2045 and achieve negative emissions after that.

The Swedish Energy Agency awarded SEK 9.3 billion (almost $950 million) to three waste-to-energy operators: Renova, SYSAV, and Öresundskraft. Together, their projects plan to capture and permanently store 5.75 million tonnes of biogenic CO₂.

The funding comes through Sweden’s second government auction for bio-CCS, a technology that captures carbon dioxide from biological sources and stores it underground.

The projects could help Sweden remove more carbon from the atmosphere while building a new industry around carbon capture and storage. However, the planned storage volumes still need to be delivered. The funding will be paid out as storage begins, rather than as a single upfront payment.

Sweden Backs Three Carbon Capture Projects

The three projects are led by municipal waste and energy companies. Their facilities process waste and produce electricity and district heating. Adding carbon capture could allow them to store CO₂ that would otherwise enter the atmosphere.

The Swedish Energy Agency divided the SEK 9.3 billion award among the projects as follows:

  • SYSAV: SEK 6.3 billion to develop its SkyZero carbon capture project in Malmö.
  • Renova: About SEK 1.6 billion for its carbon capture plans.
  • Öresundskraft: About SEK 1.4 billion for its project.

The three companies plan to store 3.6 million tonnes, 890,000 tonnes, and 1.26 million tonnes of biogenic CO₂, respectively, during their support periods. These amounts add up to 5.75 million tonnes. 

The projects must begin geological storage within four years of the funding decision. The government will release the support as storage activities begin. This structure links public funding to project delivery. It also gives the companies support for both construction costs and operating expenses.

How Bio-CCS Can Create Negative Emissions

Bio-CCS combines carbon capture and storage with CO₂ from biological sources. Plants absorb CO₂ as they grow. When biomass is used in industrial processes or burned for energy, that carbon can return to the atmosphere.

Bio-CCS captures the CO₂ and stores it in deep geological formations instead. If the process meets the required conditions, it can remove carbon from the atmosphere and create negative emissions.

This differs from capturing fossil CO₂. Fossil fuels release carbon that has been stored underground for millions of years. Capturing and storing those emissions can prevent additional CO₂ from entering the atmosphere, but it does not automatically remove carbon that is already there.

The distinction matters for climate targets and carbon removal markets. Projects must show where the captured carbon comes from, how much is stored, and whether the storage remains secure.
The Swedish projects will capture CO₂ from waste-to-energy plants. These facilities process mixed waste, which contains both biological materials and fossil-based materials such as plastics.
As a result, not all captured CO₂ will count as biogenic carbon removal. The climate benefit depends on the amount of biogenic CO₂ captured and permanently stored, along with the emissions produced across the process.

Sweden’s €840 Million Bio-CCS Investment

Sweden Uses Reverse Auctions to Allocate Carbon Removal Funding

Sweden uses reverse auctions to allocate support for bio-CCS projects. In a standard auction, buyers compete to pay the highest price. In a reverse auction, project developers compete to provide a service at the lowest required level of public support.

For Sweden’s program, applicants had to meet technical and other requirements and offer a credible plan for capturing, transporting, and permanently storing biogenic CO₂. The agency then assessed the bids and awarded support to eligible projects.

The aim is to direct public money toward projects that can deliver negative emissions at a lower cost to taxpayers. The second auction closed in August 2026. Renova, SYSAV, and Öresundskraft were the only three applicants, and all three received funding.

The award also shows that bio-CCS is still developing as a market. Large projects require significant investment in capture equipment, transport systems, and access to suitable geological storage. Government support can help cover these costs while the industry develops its business models.

Sweden’s Larger Carbon Removal Industry: SEK 30 Billion in Awards

The latest award is part of a wider Swedish program worth SEK 30.7 billion through 2046. In January 2025, Stockholm Exergi received SEK 20 billion in the first funding round. Its project plans to store more than 11 million tonnes of biogenic CO₂ over the support period.

With the latest awards, about SEK 29.3 billion of the total funding budget has now been allocated to four companies: Stockholm Exergi, Renova, SYSAV, and Öresundskraft. Together, their projects have the potential to store nearly 17 million tonnes of biogenic CO₂ by 2046.

Sweden aims to reach net-zero greenhouse gas emissions by 2045 and achieve negative emissions afterward. Cutting emissions across the economy remains essential, while carbon removal can help address emissions that are difficult to eliminate.

Sweden net zero target
Source: IEA

The country has several potential advantages for bio-CCS, including its forest industry and facilities that produce biogenic CO₂. However, turning this potential into real carbon removal will require reliable technology, transport and storage systems, and long-term monitoring.

Could Sweden’s Bio-CCS Investment Help Scale Carbon Removal?

Sweden’s investment could help establish a stronger business case for engineered carbon removal in Europe. Bio-CCS projects need large amounts of capital before they can begin storing CO₂. Government support reduces some of that financial risk and helps companies build the infrastructure needed to operate at scale.

The projects may also help develop expertise in carbon capture, transport, geological storage, and emissions measurement. These services could become important as more industries look for ways to reduce emissions and remove carbon.

However, public funding does not automatically mean that carbon credits will be issued or sold. Any credits linked to these projects would depend on the applicable rules, accounting methods, verification, and market arrangements.

Buyers and investors will also need clear evidence of how much CO₂ is captured, how much is biogenic, and how much reaches permanent storage. Energy use, transport, and other project emissions must be considered when assessing the overall climate benefit.

The projects’ progress will therefore matter as much as the size of the funding award.

Can Sweden Turn Bio-CCS Funding Into Lasting Climate Gains?

Sweden’s €840 million award gives three carbon capture projects a major boost. Together, they aim to store 5.75 million tonnes of biogenic CO₂, while the wider government program seeks to build a larger industry for permanent carbon removal.

The reverse-auction model links support to planned storage and helps direct public funds toward eligible projects. But the expected climate benefits will depend on whether the companies build their facilities, start storage on time, and verify the amount of biogenic CO₂ permanently stored.

For carbon markets, the key lesson is that public funding can help bring carbon removal projects closer to reality. Still, the lasting climate value will depend on measured, verified, and permanent storage.

The post Sweden Awards €840 Million to Three Carbon Capture Projects to Store 5.75 Million Tonnes of CO₂ appeared first on Carbon Credits.