Deutsche Bank Sees Silver Prices at $70 an Ounce in 2027 as Market Shifts from Shortage to Surplus

Silver’s supply outlook is changing quickly.

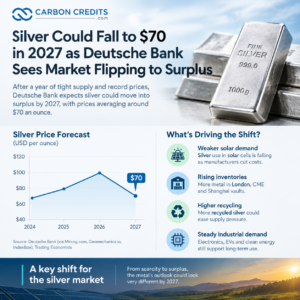
After a physical shortage and a dramatic price rally in 2026, the silver market could enter surplus as early as 2027, Deutsche Bank says. Rising inventories, weaker industrial consumption and falling silver use in solar manufacturing are reducing pressure on the market.

The bank’s outlook, reported by Mining.com, points to a very different silver market from the one investors saw at the start of this year. Deutsche Bank metals analyst Daniel Ghali expects silver prices to average around $70 an ounce in the second quarter of 2027.

The forecast comes as silver prices retreat from their 2026 highs.

Silver Price Pulls Back From Record High

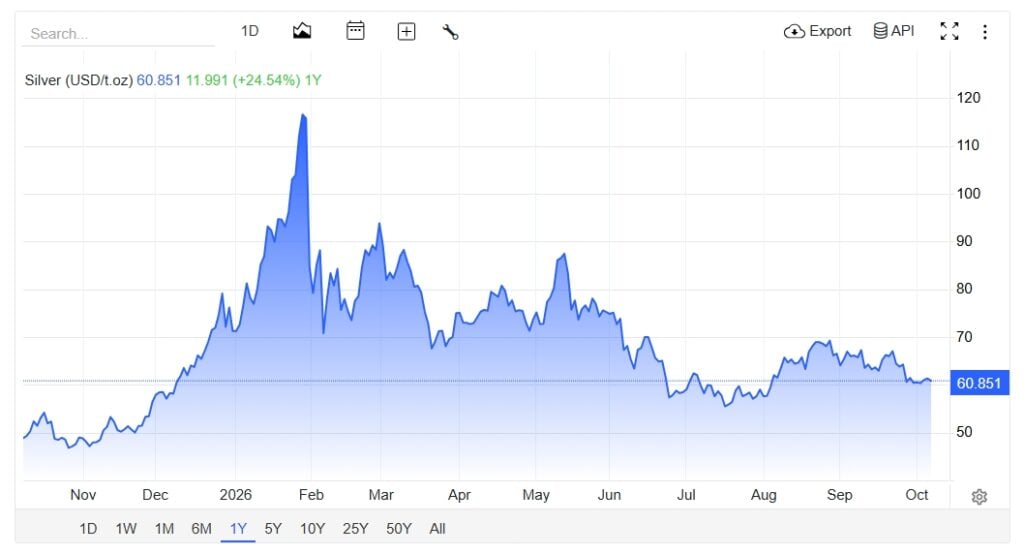
Silver has experienced an unusually volatile year.

Trading Economics data show silver trading around $60.72 an ounce on October 7, down about 7.7% over the past month. However, the metal remains about 24% higher than a year ago. Silver reached an all-time high of $121.64 an ounce in January 2026.

silver

The decline reflects more than normal market volatility. Higher Treasury yields, a stronger U.S. dollar, and changing expectations for Federal Reserve policy have pressured precious metals.

But Deutsche Bank sees a more fundamental reason for potential weakness ahead: the silver market is becoming less physically constrained.

London commercial vaults held more than 914 million ounces of silver at the end of August, including more than 300 million ounces considered readily available. Deutsche Bank said readily available London stocks have increased about 70% since October 2025.

Inventories have also increased in CME warehouses and Shanghai. The bank attributes the buildup to higher recycling, the release of privately held metal, and weaker fabrication demand.

That growing inventory cushion could make another severe physical shortage less likely.

Solar Industry Becomes the Biggest Demand Risk

The biggest change could come from the solar industry.

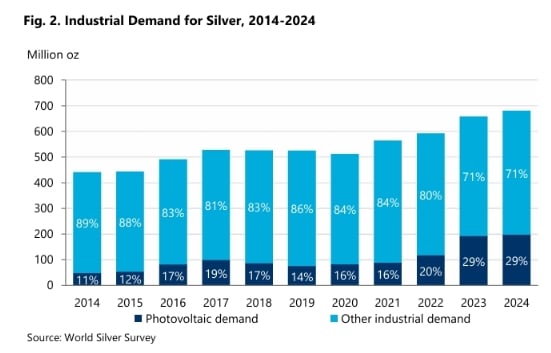
Silver plays an important role in solar cells because of its high electrical conductivity. But manufacturers are under growing pressure to reduce the amount of silver used in each cell as prices rise.

Deutsche Bank expects global silver consumption in solar applications to fall by more than 20% this year. Chinese solar demand could decline by about 33%.

Manufacturers are using thinner electrical contacts, copper-plated silver pastes and new cell designs that require less silver. The bank estimates silver use per solar cell will fall 17% in 2026.

High prices have strengthened that incentive.

silver demand

At one point in 2026, silver accounted for more than 30% of solar-module production costs, compared with less than 10% at the beginning of 2025. That share has since fallen to roughly 14%, but the cost remains high enough to encourage further material savings and substitution.

This creates an important paradox for the energy transition. Solar deployment can keep growing rapidly while the amount of silver required per panel falls.

Silver Demand Is Not Disappearing

A weaker solar market for silver does not mean industrial demand will collapse.

Silver remains widely used in electronics, electrical equipment, medical technologies and other industrial applications. Electrification, data infrastructure and renewable energy continue to support demand for the metal.

Recycling could also become a more important source of supply.

A recent Reuters analysis highlighted improvements in solar-panel recycling, including technologies capable of recovering silver at very high rates. Rystad Energy estimates that recycled panels could supply as much as 21% of the silver needed for solar-panel production by 2035.

That could further reduce the solar sector’s dependence on newly mined silver over time.

Investment Demand Could Decide Silver’s Next Move

With physical scarcity easing, investment demand may become even more important for prices.

Deutsche Bank estimates silver-backed investment funds could potentially release around 40 million ounces by the end of 2027 if investors respond to interest-rate conditions in a way similar to previous Federal Reserve tightening cycles.

India also presents a weaker demand signal. The bank estimates the country’s silver imports are about 25% below last year’s levels following higher import duties and purchasing restrictions. Chinese demand remains a wild card, however, because silver continues to trade at a premium in China despite rising inventories.

  • Trading Economics currently expects silver to average around $63.60 by the end of the quarter and reach about $74.56 over the next 12 months, showing that the broader market does not necessarily expect prices to collapse even as physical tightness eases.

The key difference is that silver may no longer need extreme scarcity to support its price.

What a Silver Surplus Means for the Energy Transition

A move from shortage to surplus would give manufacturers more breathing room, but it could also change the economics for silver miners.

If solar companies continue reducing silver intensity while recycling expands, future demand growth may not translate directly into higher primary silver consumption.

For investors, the story is therefore shifting from simply finding more silver to understanding where demand will come from.

Deutsche Bank’s forecast does not guarantee a surplus. Stronger Chinese demand, renewed investment buying, supply disruptions or another wave of precious-metals demand could quickly tighten the market again.

For now, however, the silver story is changing. A metal that started 2026 at the center of a supply squeeze could enter 2027 with rising inventories, more recycling and a solar industry determined to use less of it.

The next phase of the silver market may be less about scarcity and more about how quickly manufacturers can adapt.

The post Deutsche Bank Sees Silver Prices at $70 an Ounce in 2027 as Market Shifts from Shortage to Surplus appeared first on Carbon Credits.

Carbon Credits Get More Expensive as Q3 Retirements Decline, Sylvera Finds

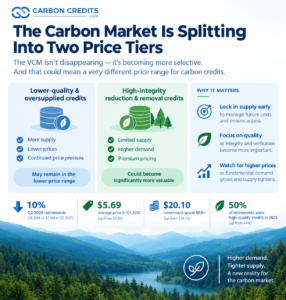
The voluntary carbon market (VCM) continued to move away from a volume-driven model in the third quarter of 2026, with carbon credit retirements falling even as buyers spent more on the credits they purchased.

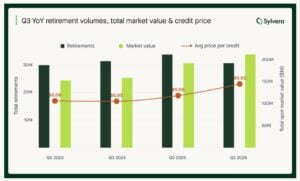
  • Carbon credit retirements reached 30.6 million in Q3 2026, down 9% from 33.7 million a year earlier, according to carbon market data provider Sylvera. However, the value of those retirements rose to $211.8 million from $190.6 million in Q3 2025.

The difference points to a market where buyers are becoming more selective. The report reveals that the average price paid for a retired credit climbed to $6.92 in Q3, compared with $5.66 a year earlier. For the first nine months of 2026, the average reached $6.12, up from $5.40 during the same period in 2025.

The trend also builds on what Sylvera identified earlier this year. In the first half of 2026, retirement volumes were down 9% year over year, while market value increased. By the end of Q3, however, cumulative retirements had edged above 2025 levels at 130.3 million credits, compared with 129.1 million through the first three quarters of last year.

Meanwhile, year-to-date retirement value reached $798 million, 14% above the $697.3 million recorded a year earlier.

carbon credit retirements

Quality Is Taking a Bigger Role in Carbon Credit Pricing

The strongest signal from the latest data comes from the widening gap between higher- and lower-quality credits.

Credits rated BBB or higher represented only 18% of rated retirement volume in Q3. Yet they generated 42% of rated market value. This suggests buyers are willing to pay significantly more for credits that meet stronger quality expectations rather than simply purchasing the cheapest available supply.

The premium becomes even clearer across individual project categories.

  • For afforestation, reforestation and revegetation (ARR), BBB+ credits averaged $23.47 per tonne in Q3, compared with $12.80 for credits rated BB or below. Improved forest management (IFM) showed a similar divide. BBB+ IFM credits reached $21.07, while lower-rated credits averaged $12.79.
  • REDD+ also saw a sharp quality-driven price difference. BBB+ REDD+ credits averaged $7.75 in Q3, up 58% from $4.90 a year earlier. Lower-rated REDD+ credits increased from $2.70 to $3.56 over the same period.

As a result, the REDD+ price gap between the two quality groups nearly doubled from $2.20 to $4.19. The trend suggests that buyers are not abandoning nature-based credits altogether. Instead, they appear increasingly willing to distinguish between projects based on perceived quality.

carbon credits sylvera

Renewables Still Dominate, But Their Market Position Is Changing

Renewable energy projects accounted for 41% of Q3 retirements, giving them the largest share among project categories. However, Sylvera cautions that the increase in market share does not represent renewed growth in renewable credit demand.

Renewable retirements totaled 40.7 million credits during the first nine months of 2026, roughly unchanged from the same period in 2025. That remains far below the 77.1 million credits retired during the first three quarters of 2022. Full-year renewable retirements peaked at 99.7 million in 2022 before falling to 49.3 million in 2025.

The quality issue is particularly important here. Sylvera does not rate renewable projects above C because many grid-connected renewable projects face additionality concerns. As a result, renewables accounted for 76% of B/C/D-rated retirement volume in Q3.

That helped push the share of B/C/D-rated credits across the entire retirement market to 66.1%, the highest level since Q3 2023. In other words, renewable credits continue to provide substantial market volume, but their presence also weighs on the overall quality profile of retirements.

REDD+ Demand Normalizes While Agriculture Gains Ground

REDD+ accounted for 18% of Q3 retirements, down sharply from 38% in Q2. However, the comparison needs context because Q2’s unusually high share was largely driven by one major retirement.

Beyond that temporary spike, REDD+ demand appears relatively stable, with retirement activity spread across Colombia, Brazil, Cambodia, Peru, and the Democratic Republic of Congo.

Agriculture was a more notable growth area. Its share of retirements increased from 2.55% to 7.82%, while retirement volume more than doubled. Energy and utility companies played an important role in that shift, with agriculture representing 28% of their Q3 retirement mix, compared with 6.8% a year earlier.

This diversification matters because the market is gradually moving beyond a small group of traditional project categories. Buyers are showing greater interest in credits tied to agriculture, forest management, and other project types where measurable climate and environmental benefits can support stronger pricing.

carbon credits renewables

Corporate Buyers Are Still Active

Despite the overall decline in quarterly retirement volumes, major corporate buyers continued to transact at scale.

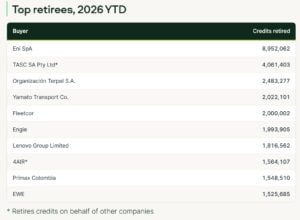
Yamato Transport and Corpay each retired about 2 million credits in Q3, making them the largest retirees during the quarter. Primax Colombia followed with just over 1 million.

For the first nine months of 2026, Eni remained the largest retiree with nearly 9 million credits. TASC, Organización Terpel, Engie and Lenovo also ranked among the largest buyers.

At the same time, Shell’s retreat remains significant. The company retired only about 496,000 credits through the first three quarters of 2026, compared with roughly 7 million during the same period in 2025. Sylvera first highlighted the decline in its Q2 report, and the latest numbers suggest the pullback has continued.

carbon credit retirement
Source: Sylvera

Q3 Reports Point to a More Selective Market

Sylvera’s findings broadly align with the quality-focused direction highlighted by other Q3 market research, although the datasets show different parts of the market.

CEEZER described Q3 as a cooler market, with weaker retirement activity and a sharper focus on credits carrying recognized quality labels.

  • Its analysis found that CCP-labeled retirement value increased 6.9% year over year even as the associated volume fell 17.7%. It also found that CCP-labeled issuances carried a roughly 48% premium over the broader market, up from about 5% a year earlier.

The difference between the reports is useful. Sylvera’s data shows that quality premiums are already visible across individual project types, while CEEZER’s analysis suggests that recognized integrity standards are becoming an increasingly important market filter.

Together, the findings point to a carbon market that is becoming less focused on buying the largest possible volume of credits. Instead, buyers appear more willing to pay for credits that can offer stronger ratings, clearer additionality, and greater confidence in environmental outcomes.

What Comes Next for the Carbon Market?

Sylvera’s Q3 data suggests that the voluntary carbon market is entering a more selective phase.

Retirement volumes remain uneven, and large corporate buying decisions can significantly influence quarterly results. Yet the rise in average prices and total market value shows that weaker volume does not necessarily mean weaker demand.

Instead, the market appears to be splitting between lower-cost credits that continue to provide significant volume and higher-quality credits that attract a growing share of spending.

That shift could have major implications for developers. Projects with stronger additionality, monitoring, and permanence claims may increasingly compete for a premium, while lower-quality supply could face greater difficulty attracting buyers.

For investors and corporate buyers, the message is similar: headline retirement volumes alone no longer tell the full story. The more important question may be how much capital is flowing toward credits that the market considers genuinely high quality.

Is the carbon market finally shifting from buying more credits to buying better ones?

The post Carbon Credits Get More Expensive as Q3 Retirements Decline, Sylvera Finds appeared first on Carbon Credits.
EU Carbon Price Jumps as CBAM Certificate Hits €82.32 per Tonne

EU Carbon Price Jumps as CBAM Certificate Hits €82.32 per Tonne

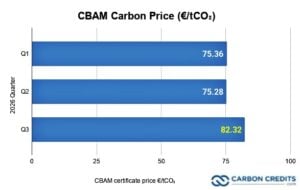
The European Union set the Q3 2026 price for Carbon Border Adjustment Mechanism (CBAM) certificates at €82.32 per tonne of CO₂. This provides importers with a new benchmark for the carbon cost of emissions-heavy goods entering the bloc.

The European Commission published the price on October 5, after calculating it from EU Emissions Trading System (EU ETS) auction prices during the third quarter. It is the highest quarterly CBAM certificate price published so far in 2026. The price rose 9.4% from €75.28/tCO₂ in Q2 and about 9.2% from €75.36/tCO₂ in Q1.

The move comes as CBAM enters its first year of full operation. Importers now bear costs tied to the carbon emissions of their products. This makes the EU’s carbon price more important for global manufacturers and exporters.

CBAM Turns Carbon Reporting Into a Financial Cost

The CBAM definitive regime took effect on January 1, 2026, replacing the transitional system that operated from 2023 through 2025. The mechanism currently covers cement, iron and steel, aluminum, fertilizers, electricity and hydrogen.

Importers must report the emissions embedded in covered goods and eventually surrender the corresponding number of CBAM certificates. The system is designed to address carbon leakage.

Without CBAM, EU manufacturers covered by the EU ETS could face a carbon cost that foreign producers do not pay. This could encourage production to move outside the EU or allow more carbon-intensive imports to compete with European goods.

CBAM is intended to apply a comparable carbon cost to covered imports. The European Commission states that the mechanism aims to make sure imported products pay a carbon price similar to what EU producers pay. This also encourages cleaner production outside the EU.

An EU official recently said that starting in January 2026, CBAM will shift from reporting emissions to adding a financial cost to those emissions.

Q3 CBAM Price Climbs Nearly 10%

The new €82.32/tCO₂ price marks a clear increase during 2026. The Q3 price is important because it applies to CBAM-covered emissions from goods imported into the EU during that quarter.

CBAM Carbon Price q3 2026

However, importers do not begin buying certificates during 2026. The Commission says that approved CBAM declarants will start buying certificates in February 2027 for their imports from 2026.

The first CBAM declarations and corresponding certificate surrender are due by September 30, 2027. This gives companies time to calculate their embedded emissions, verify data, and prepare for the financial obligation.

How Much Could €82.32 Cost Importers?

The certificate price provides a straightforward way to estimate the potential carbon cost. For example, an importer with 10,000 tonnes of embedded emissions would face a gross certificate cost of approximately €823,200 at the Q3 2026 price.

At 100,000 tonnes, the figure rises to about €8.23 million.

The actual liability can be lower because CBAM allows importers to deduct a carbon price already paid in the country where the goods were produced. The final number of certificates also depends on the rules for calculating embedded emissions and the applicable free-allocation adjustment. That makes emissions data increasingly valuable.

The Commission has released guidance for specific sectors, including cement, hydrogen, fertilizers, iron and steel, aluminum, and electricity. It aims to help companies calculate embedded emissions during the set period.

For exporters, cleaner production can therefore become a competitive advantage. Lower embedded emissions mean fewer CBAM certificates are ultimately required.

Weekly CBAM Pricing Starts in 2027

The €82.32 price is also important because it represents the last phase of the EU’s temporary quarterly pricing system. For 2026, the Commission calculates four prices, one for each calendar quarter.

From 2027 onward, certificate prices will be calculated and published weekly. The methodology is designed to track the EU ETS more closely by using the relevant auction prices for EU ETS allowances. This means importers will face a more dynamic carbon price environment.                                         

The EU’s approach aims to keep the carbon cost for imports aligned with the carbon cost faced by European producers under the ETS. It also means companies will need to pay closer attention to carbon price movements when planning procurement, production and investment.

For businesses importing large quantities of emissions-intensive materials, carbon pricing could increasingly become part of ordinary supply chain cost management.

Top 10 Country of Production for CBAM

EU Could Expand CBAM’s Reach

CBAM is not necessarily staying limited to its current product categories. In June, the European Commission welcomed a Council agreement to extend CBAM to specific downstream goods and strengthen anti-circumvention measures.

The proposal aims to stop companies from sidestepping the rules. They can’t process covered materials into specific products outside the EU and then import them. This could expand the number of businesses exposed to the mechanism.

At the same time, the EU recently assessed its 50-tonne de minimis threshold. From April 2025 to March 2026, the Commission found that the threshold would exempt only 0.87% of embedded emissions. This is below the 1% limit set by the regulation.

The threshold was introduced to reduce the administrative burden on smaller importers. The Commission previously estimated that it would exempt about 182,000 importers while still covering more than 99% of emissions within CBAM’s scope.

The result is a system designed to reduce paperwork for small shipments without removing most emissions from the mechanism.

Carbon Pricing Is Expanding Beyond Europe

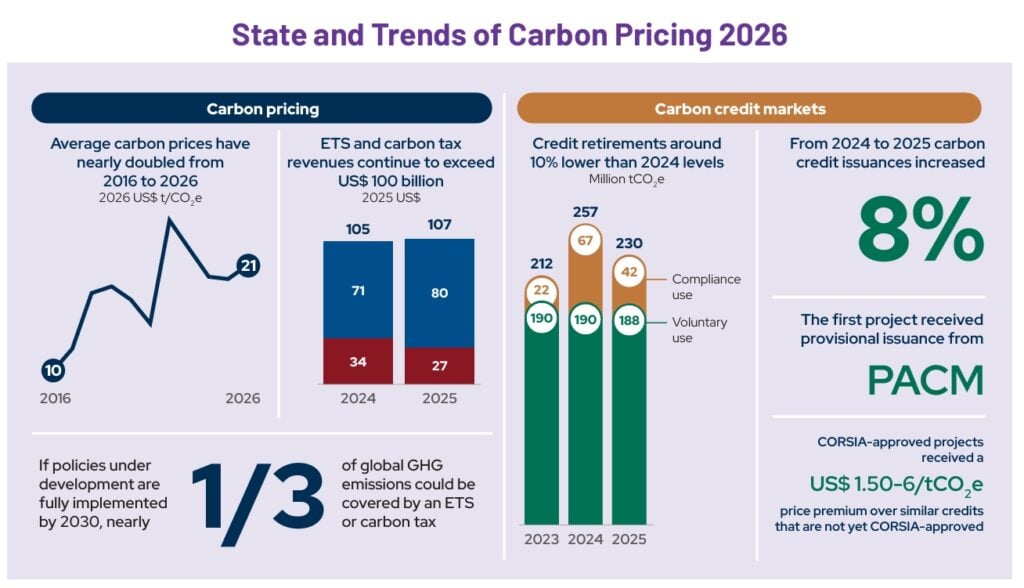
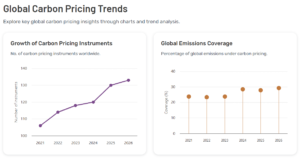
The CBAM price arrives as carbon pricing continues to expand globally. The World Bank’s State and Trends of Carbon Pricing 2026 report found that 87 carbon pricing policies were operating worldwide as of 2026.

Direct carbon pricing now covers over 29% of global greenhouse gas emissions. In 2025, carbon pricing systems generated over $107 billion in government revenue. The average direct carbon price reached nearly $21/tCO₂e.

carbon pricing trend world bank 2026
Source: World Bank
  • The EU’s €82.32 CBAM certificate price is therefore substantially above the global average direct carbon price.

However, the comparison is not like-for-like. The World Bank figure includes various carbon taxes and emissions trading systems. In contrast, CBAM is tied to the EU’s carbon market and targets embedded emissions in certain imports.

Still, the trend is clear: Carbon is increasingly becoming a direct economic cost in international trade.

EU Climate Policy Is Tightening the Long-Term Signal

CBAM is part of the EU’s broader climate strategy.

The bloc set a target in 2026 to cut net greenhouse gas emissions by 90% from 1990 levels by 2040. At least 85% of this reduction must happen within the EU, and up to 5% can come from international carbon credits. The bloc remains committed to achieving climate neutrality by 2050.

CBAM supports that trajectory by extending the carbon price signal beyond EU borders for covered products. The policy also interacts directly with the EU ETS, where European industrial producers already face carbon costs.

As the EU ETS gradually cuts free allocation for sectors under CBAM, the border mechanism will become more important. This gives manufacturers a stronger incentive to reduce emissions rather than simply absorb higher carbon costs.

The shift also creates stronger incentives for exporters to provide accurate, verified emissions data. Companies with lower actual emissions can potentially reduce their CBAM liability compared with producers relying on higher default values.

From 2027, the move to weekly certificate pricing will make the system even more closely tied to carbon market movements.

CBAM Is Becoming a Global Trade Signal

The European Commission’s €82.32/tCO₂ Q3 price marks another step in the transition from carbon reporting to carbon pricing at the border. The price is almost 10% above the Q2 benchmark.

The EU is also getting ready for weekly pricing starting in 2027, with the first certificate surrender deadline set for September 2027. At the same time, carbon pricing is spreading globally. The World Bank reports that direct carbon pricing now covers nearly 30% of global emissions.

For companies exporting emissions-intensive products to Europe, the implications are clear. Carbon emissions are no longer only an environmental metric. Under CBAM, they can directly affect the cost of accessing the EU market.

As the mechanism expands and the EU continues tightening its climate targets, the ability to measure, verify, and reduce embedded emissions is likely to become an increasingly important part of international industrial competitiveness.

The post EU Carbon Price Jumps as CBAM Certificate Hits €82.32 per Tonne appeared first on Carbon Credits.

Amazon, Constellation Back $3 Billion Nuclear Expansion at Maryland’s Calvert Cliffs

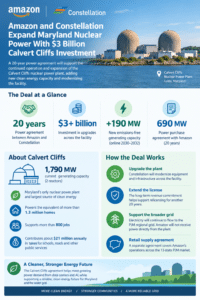
Amazon (Nasdaq: AMZN) and Constellation Energy (Nasdaq: CEG) have signed a 20-year power agreement to support the expansion and continued operation of the Calvert Cliffs nuclear power plant in Maryland.

The agreement will help fund more than $3 billion in upgrades across the facility and add about 190 megawatts (MW) of new emissions-free generating capacity. The additional power is expected to come online between 2030 and 2032.

The deal comes as large technology companies seek more reliable electricity to support growing data center and artificial intelligence demand.

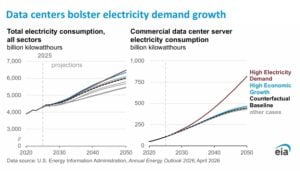
The EIA estimates data center servers already accounted for about 7% of U.S. commercial electricity consumption in 2025. By 2050, server electricity use could reach 446–818 billion kWh, depending on how quickly data center power demand grows.

us data center

The Deal Supports 190 MW Nuclear Capacity Increase

Calvert Cliffs currently has 1,790 MW of generating capacity, making it Maryland’s only nuclear power plant and its largest source of clean electricity.

  • Under the new agreement, Amazon will purchase 690 MW of power through a 20-year arrangement with Constellation. The deal includes the planned 190 MW uprate, which will increase the plant’s output without requiring construction of an entirely new reactor.

Constellation plans to use the investment to modernize equipment and infrastructure throughout the plant. The company also expects Amazon’s long-term revenue commitment to support the process of relicensing Calvert Cliffs for another 20 years.

The companies have also signed a separate retail electricity supply agreement covering Amazon’s operations across the 13-state PJM power market.

Importantly, the electricity generated at Calvert Cliffs will continue to enter the PJM regional grid. Amazon will not receive electricity directly from the plant. Instead, its long-term commitment helps support the economics of maintaining and expanding generation that serves the wider electricity system.

Calvert Cliffs Strengthens Maryland’s Power Supply

Calvert Cliffs plays an important role in Maryland’s electricity system. Constellation says the plant produces about 80% of the state’s clean energy and generates enough electricity to serve more than 1.3 million homes.

The facility also supports more than 800 jobs and contributes approximately $21 million in annual taxes for public services, including schools and roads.

The planned expansion will therefore affect more than the plant’s electricity output. The investment will support upgrades at an existing nuclear facility while helping maintain its workforce and local economic contribution.

Constellation also sees the site as a potential location for future clean energy projects. The company said Amazon’s long-term commitment will help it move forward with additional clean energy development at Calvert Cliffs.

U.S. Nuclear Power Remains a Major Electricity Source

The Calvert Cliffs agreement comes as nuclear power continues to provide a significant share of U.S. electricity.

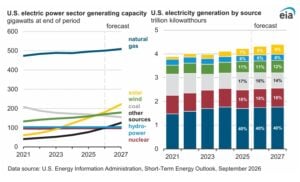
  • According to the U.S. Energy Information Administration’s September 2026 data, U.S. utility-scale nuclear capacity stood at about 98.4 gigawatts (GW) in July 2026. Nuclear power represented roughly 7.5% of total U.S. utility-scale generating capacity at that time.
  • Nuclear plants also generated about 460.1 terawatt-hours (TWh) of electricity during the first seven months of 2026, according to EIA data released in September. That was 1.5% higher than the comparable period in 2025.

EIA’s September 2026 Short-Term Energy Outlook also expects nuclear power to account for about 18% of U.S. electricity generation in both 2026 and 2027.

nuclear EIA
Source: EIA

These figures show why extending the operating life of existing reactors can add dependable generation without waiting for an entirely new nuclear plant to be built.

Amazon Builds a Large Clean Energy Portfolio

The Calvert Cliffs agreement adds to Amazon’s growing clean-energy portfolio. In 2025, Amazon said it had more than 700 renewable and carbon-free energy projects across 30 countries, representing more than 40 GW of capacity.

BloombergNEF has also ranked Amazon among the world’s largest corporate buyers of clean energy. The company contracted 10.22 GW of clean energy capacity in 2025.

Amazon’s major clean-energy and nuclear deals include:

  • X-Energy: In 2024, Amazon joined a $500 million funding round for X-Energy, which is developing small modular reactors. Amazon expects the partnership to support more than 5 GW of new nuclear capacity in the U.S. by 2039.
  • Energy Northwest: Amazon is supporting a planned SMR project in Washington state. The initial project is expected to provide 320 MW, with potential to expand to 960 MW.
  • Talen Energy: Amazon signed a long-term agreement to access power from Talen Energy’s Susquehanna nuclear plant in Pennsylvania. The deal can provide up to 1,920 MW through 2042.

The Calvert Cliffs agreement takes a different approach by supporting an existing reactor fleet and increasing its output through an uprate. This can provide additional capacity while preserving an established nuclear facility and its connection to the regional grid.

As U.S. power demand grows, deals like this can help fund nuclear plant upgrades while adding more reliable, emissions-free power to the grid. They also highlight how long-term corporate power agreements can support existing nuclear facilities and help enable new generating capacity.

The post Amazon, Constellation Back $3 Billion Nuclear Expansion at Maryland’s Calvert Cliffs appeared first on Carbon Credits.
Tesla (TSLA) Q3 Deliveries Beat Analysts’ Expectations, But BYD Widens EV Lead

Tesla (NASDAQ: TSLA) delivered more vehicles than Wall Street expected in the third quarter of 2026, giving investors a reason to turn more positive on the electric vehicle maker’s near-term outlook.

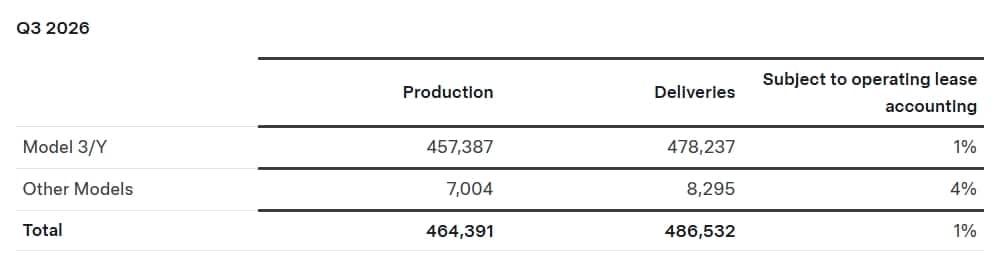
Tesla delivered 486,532 vehicles in Q3, beating the company-compiled analyst consensus of 461,974. Deliveries also rose 1.3% from 480,126 vehicles in Q2. However, they remained 2.1% below the 497,099 vehicles delivered in Q3 2025.

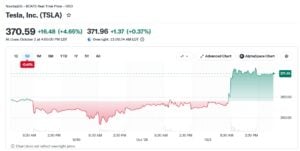
The stronger-than-expected result helped Tesla stock rebound. Shares closed at $370.59 on October 2, up 4.7% in the session. Reuters reported that the stock gained more than 5% earlier in trading after the delivery figures were released.

tesla stock TSLA
Source: Yahoo Finance

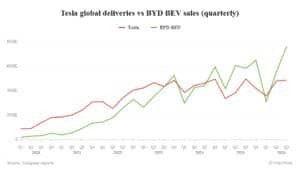
Still, Tesla faces a growing challenge from Chinese EV giant BYD. BYD’s battery-electric vehicle sales continued to pull further ahead of Tesla during the quarter.

Tesla Q3 Deliveries Beat Estimates

Tesla’s Q3 delivery result came in well above the latest company-compiled consensus.

Analysts surveyed by Tesla had expected 461,974 deliveries, with a median estimate of 463,406. Tesla ultimately delivered 486,532 vehicles, exceeding the consensus by about 24,600 vehicles.

The Model 3 and Model Y remained the company’s main volume drivers. Tesla delivered 478,237 Model 3/Y vehicles during the quarter, compared with just 8,295 deliveries across its other models.

Production, meanwhile, reached 464,391 vehicles.

Tesla also deployed 13.7 gigawatt-hours (GWh) of energy storage products during Q3. That figure was below the 15.9 GWh analyst consensus, highlighting that Tesla’s energy business remains an important part of the company’s broader growth story.

The delivery beat is significant because analysts had entered the quarter expecting a decline. FactSet estimates cited by MarketWatch had pointed to roughly 461,000 vehicles, or a 7% year-over-year decline.

Instead, Tesla limited the decline to about 2%.

tesla tsla ev
Source: Tesla

Tesla vs. BYD: The EV Gap Is Growing

Despite Tesla’s better-than-expected quarter, its competition with BYD is becoming more intense.

BYD sold 762,478 battery-electric passenger vehicles during Q3, according to data compiled by CnEVPost. That was up nearly 31% from a year earlier and 37% from Q2.

As a result, BYD sold about 275,946 more battery-electric vehicles than Tesla during the quarter.

The comparison needs some context. Tesla reports deliveries of its vehicles, while BYD sells both battery-electric vehicles and plug-in hybrids under its broader new-energy vehicle category.

BYD sold 1.32 million new-energy vehicles in Q3, including both types. Total NEV sales rose 18.8% year over year.

BYD also recorded 463,561 new-energy vehicle sales in September alone, its strongest monthly result of 2026. Overseas passenger vehicle and pickup shipments jumped 153.9% year over year to 179,877 in September, Reuters reported.

BYD vs tesla
Source: CNeV

This international expansion could become increasingly important for the global EV market. It also shows how competition is moving beyond traditional EV strongholds as Chinese manufacturers expand into overseas markets.

Sustainability Remains a Key Part of Tesla’s Story

Tesla’s delivery numbers also matter from a sustainability perspective because more EV sales can accelerate the shift away from gasoline-powered vehicles.

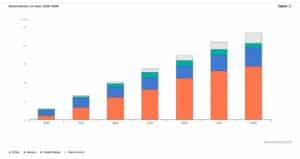
The International Energy Agency said global electric car sales exceeded 20 million in 2025, with EVs accounting for one in four new cars sold worldwide. China remained the largest EV market, accounting for six out of 10 electric cars sold globally.

IEA EV sales
Source: IEA
  • Tesla says its products helped avoid 37 million metric tons of CO₂e emissions in its 2025 Impact Report. The company’s sustainability strategy also extends beyond vehicles to battery storage, solar energy, and its supply chain.

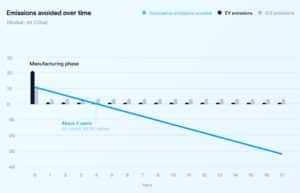
The company also highlighted the emissions benefit of its electric vehicles over their operating lives. It estimates that one Tesla vehicle can avoid about 32 metric tons of CO₂ emissions over its lifetime compared with a comparable gasoline-powered vehicle. However, the actual benefit varies by factors such as electricity generation, vehicle efficiency, and driving patterns.

tesla emission
Source: Tesla

However, EV growth does not eliminate the environmental impact of manufacturing. Batteries require minerals such as lithium, nickel, graphite, and other materials, while vehicle production and electricity generation also create emissions.

That makes the growth of energy storage particularly relevant. Tesla deployed 13.7 GWh of storage products in Q3, while the company-compiled analyst consensus had expected 15.9 GWh.

Large-scale batteries can help integrate renewable power into electricity systems by storing electricity when supply is high and releasing it when demand rises.

Can Tesla’s Q3 Delivery Beat Support Its Stock?

Tesla stock entered October under pressure after a volatile year. Shares closed at $370.59 on October 2, although the latest delivery beat provided some relief.

Investors are now looking beyond vehicle sales. Tesla’s valuation increasingly depends on its plans for robotaxis, AI, robotics and energy storage, while its automotive business remains critical to funding those investments.

Tesla will report its full Q3 financial results on October 21. The earnings report should give investors a clearer view of vehicle margins, revenue, cash flow, and spending on its next-generation businesses.

For now, the delivery beat strengthens Tesla’s near-term position. However, BYD’s growing lead in battery-electric vehicle sales highlights the competitive pressure facing Tesla as global EV adoption accelerates.

The longer-term sustainability opportunity remains significant, but Tesla must balance EV growth with improving manufacturing efficiency, battery supply chains and the emissions impact of its operations.

The post Tesla (TSLA) Q3 Deliveries Beat Analysts’ Expectations, But BYD Widens EV Lead appeared first on Carbon Credits.

Toyota (TM Stock) Bucks the EV Slowdown as Electrified Sales Surge Nearly 40%

Toyota Bucks the EV Slowdown as Electrified Sales Surge Nearly 40%

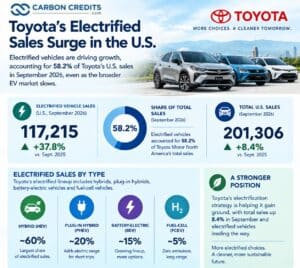
Toyota is showing that electrification can drive growth even as parts of the U.S. electric vehicle market slow. The Japanese automaker sold 117,215 electrified vehicles in the United States in September 2026, up 37.8% from a year earlier. Electrified vehicles accounted for 58.2% of Toyota Motor North America’s total September sales.

The result came as sales of Toyota’s gasoline-only vehicles fell sharply. Yet, total sales still increased 8.4% to 201,306 vehicles, outperforming the roughly 6.5% industry increase forecast by Cox Automotive.

The numbers highlight Toyota’s different approach to electrification. Rather than relying mainly on battery-electric vehicles (BEVs), Toyota has built a broad lineup of hybrids, plug-in hybrids, BEVs and fuel-cell vehicles.

That strategy is now producing measurable sales growth.

Electrified Vehicles Are Driving Toyota’s U.S. Growth

Toyota’s September results were led by its electrified lineup. The company sold 117,215 electrified vehicles, up 32,125 units from September 2025. For the third quarter, electrified vehicle sales reached 363,367, up 28.5% year over year and representing 57.4% of total sales.

Toyota’s overall third-quarter sales reached 633,223 vehicles, up just 0.6%. That means electrified vehicles accounted for most of the company’s sales growth during the quarter.

The Toyota division sold 104,105 electrified vehicles in September, up 36.6%. Lexus added another 13,110, up 47.4%. Toyota also ended September with 32 electrified vehicle options across its Toyota and Lexus brands.

The contrast with conventional vehicles is significant. Toyota’s gasoline-powered sales fell 16.5% in September, according to reporting based on the company’s sales data. The figures suggest that electrification is increasingly supporting Toyota’s sales even when demand for traditional powertrains weakens.

Hybrids Are Doing Much of the Heavy Lifting

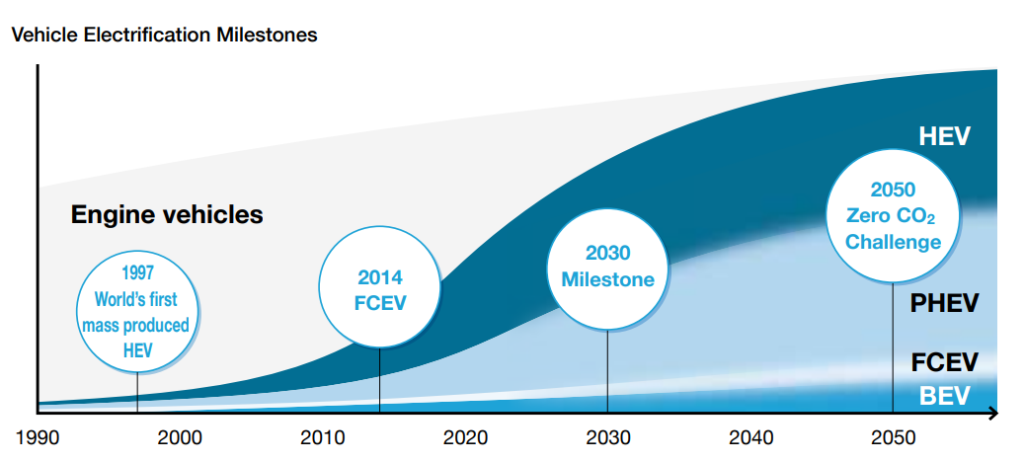
Toyota’s definition of “electrified” includes more than battery-electric vehicles. Its lineup includes conventional hybrids, plug-in hybrids, battery-electric vehicles, and fuel-cell vehicles. This gives the company a broader base for capturing consumers who want lower fuel consumption without moving immediately to a fully electric vehicle.

toyota Vehicle electrification milestones
Source: Toyota

Andrew Gilleland, senior vice president, Automotive Operations Group, Toyota Motor North America, noted:

“Our third-quarter results reinforce a simple truth—customers want choices. From affordability to electrification, our multi-path strategy continues to meet customers where they are and give them options that fit their lifestyles.  With solid momentum and disciplined inventory heading into Q4, we’re well-positioned to finish the year strong.”

That approach is particularly relevant in the U.S., where EV adoption has faced affordability and policy challenges.

The International Energy Agency estimates that electric cars accounted for just under 10% of U.S. car sales in 2025, compared with 25% globally. Global electric car sales exceeded 20 million units in 2025, up 20% from 2024.

Toyota’s results show that consumers can still shift toward electrified powertrains even when BEV adoption is slower.

The company’s June results had already shown the trend. Toyota sold 122,063 electrified vehicles in the U.S. that month, up 35%, while second-quarter electrified sales reached 383,091, up 19.5%. The September figures indicate that momentum continued into the third quarter.

Toyota Is Closing the Gap With GM

The electrification-led sales growth is also helping Toyota gain ground on General Motors in the U.S. Toyota sold 633,223 vehicles in the third quarter, compared with GM’s 670,974. GM’s sales fell 5.5%, while Toyota’s edged up 0.6%.

Toyota therefore trailed GM by only about 37,751 vehicles during the quarter.

Cox Automotive said Toyota was gaining market share as consumers shifted toward hybrids and passenger cars, areas where Asian automakers have maintained a strong position. Toyota’s growth is notable because its strategy does not depend solely on BEV sales.

It has continued investing in hybrids while expanding its battery electric lineup. This gives the company multiple ways to respond to changes in fuel prices, consumer preferences, incentives, and emissions regulations.

The approach also gives Toyota time to expand its BEV business while maintaining sales from its established hybrid franchise.

Global EV Sales Are Still Growing

Toyota’s results come against a global backdrop of continued EV expansion. The IEA expects global electric car sales to reach about 23 million vehicles in 2026, representing roughly 28% of total car sales. Europe is projected to see EV sales increase about 20%, taking electric vehicles to approximately one-third of new-car sales.

China’s electric car share is expected to approach 60% this year. However, growth is becoming less uniform.

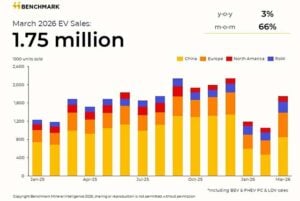
Global EV sales were about 3.9 million in the first quarter of 2026, down 8% from the same period in 2025. The decline was largely linked to weaker sales in China and the U.S. following policy changes. Europe moved in the opposite direction, with first-quarter EV sales rising close to 30% year over year.

March-2026-EV-sales europe from BMI

The IEA also expects the number of electric-car models available globally to exceed 1,100 in 2026, with about 150 new electric models announced for the year. That means competition is increasing even as the overall market expands. 

Toyota Is Planning a Bigger Electrified Mix

Toyota’s own forecasts show that electrification will become a larger part of its global sales. For fiscal 2027, Toyota forecasts 10.5 million Toyota and Lexus vehicle sales, broadly flat from fiscal 2026.

But it expects electrified vehicle sales to rise from 5.04 million to 5.956 million units. That would increase the electrified share from 48.1% to 56.7%.

The forecast includes:

  • 5.071 million hybrids, up from 4.620 million.
  • 286,000 plug-in hybrids, up from 175,000.
  • 598,000 BEVs, up from 243,000.

Toyota expects total electrified sales to approach 6 million vehicles in fiscal 2027. It also expects hybrid sales to exceed 5 million for the first time.

The numbers show where Toyota sees near-term demand. Hybrids remain the largest part of the strategy, while BEV sales are expected to more than double.

The Sales Surge Also Supports Toyota’s Climate Strategy

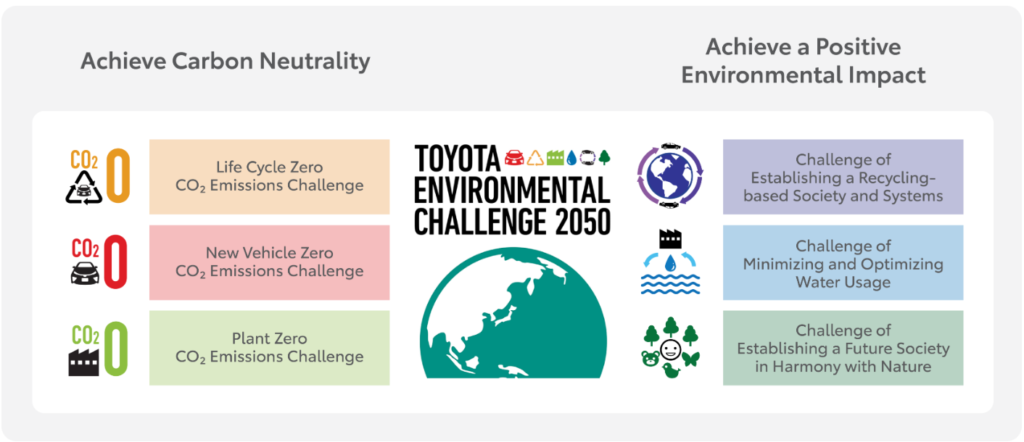
Toyota’s broader environmental strategy is built around its Environmental Challenge 2050, which includes six targets covering carbon emissions, water, circularity and biodiversity.

The company aims to achieve carbon neutrality across the vehicle lifecycle by 2050. In North America, Toyota aims to make all facilities carbon neutral by 2035.

Toyota reported a 32% reduction in Scope 1 and Scope 2 greenhouse-gas emissions from its North American operations compared with FY2019 as of FY2025.

Toyota carbon neutrality net zero 2050 goal
Source: Toyota

It is also increasing renewable electricity use. At the end of FY2025, 114 participating Toyota dealerships had reduced their use of electricity from nonrenewable sources by 20% through the company’s environmental program.

Electrified vehicles form an important part of this strategy because they can reduce tailpipe emissions compared with conventional vehicles. However, Toyota’s multi-pathway approach also reflects the different infrastructure and energy conditions across markets.

Toyota Stock Reflects a More Complicated EV Story

Toyota’s electrification gains have not translated into a sustained rise in its U.S.-listed shares.

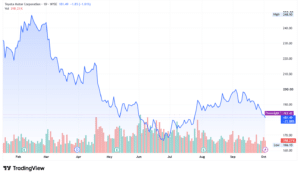
Toyota Stock TM

Toyota Motor’s NYSE-listed ADR closed at $183.10 on September 30, down 1.93% that day. It closed at $183.34 on October 1 and $181.49 on October 2. The stock had been trading near $198 in early September, putting it roughly 9% below its September 11 close by October 2.

The movement reflects broader concerns around the global auto market, including tariffs, China competition, fuel prices, interest rates, and changing EV policies. Still, Toyota’s sales data offer a different signal.

The company’s electrified vehicles are gaining share even as the broader U.S. auto market faces uneven EV demand. Its third-quarter electrified sales rose nearly 29%, while total sales were almost flat.

Toyota EV sales q3 2026

Hybrids Put Toyota on a Different EV Growth Path

Toyota’s latest U.S. results show a different path through the global auto industry’s transition. Globally, EV adoption continues to expand. The IEA expects electric vehicles to represent 28% of global car sales in 2026, with roughly 23 million electric cars sold.

Toyota’s own forecast points to nearly 6 million electrified vehicle sales in fiscal 2027, including almost 600,000 BEVs. The figures suggest Toyota’s electrification strategy is broadening rather than shifting entirely toward battery-electric vehicles.

For now, hybrids remain the company’s largest electrified segment. But with BEV sales forecast to more than double, Toyota is also increasing its exposure to the fastest-changing part of the automotive market. That combination is helping the automaker buck the recent U.S. EV slowdown while keeping its longer-term carbon neutrality targets in focus.

The post Toyota (TM Stock) Bucks the EV Slowdown as Electrified Sales Surge Nearly 40% appeared first on Carbon Credits.
CIP, Grok Ventures Back U.S.-Based Antora Energy’s Massive Thermal Battery Project in Kansas

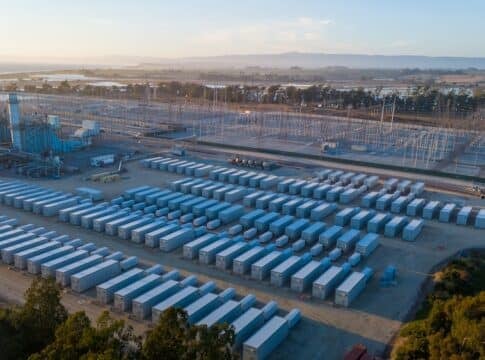
US-based Antora Energy is planning a 5.8 gigawatt-hour (GWh) multi-day thermal energy storage project at Pratt Energy’s biorefinery in Pratt, Kansas.

The project will provide reliable, around-the-clock energy to the ethanol facility while supporting local jobs, workforce training, and new investment in Pratt County.

The press release also highlighted that once completed, the project is expected to rank among the world’s largest battery storage systems. Antora plans to begin delivering energy to Pratt Energy next year under a long-term heat offtake agreement.

  • The project is backed by Copenhagen Infrastructure Partners (CIP), Australian investment firm Grok Ventures and University Pension Plan Ontario (UPP). CIP led the third-party equity financing through its credit platform investments.

The deal comes as U.S. industries face rising electricity demand and growing pressure to secure reliable, affordable energy while reducing emissions.

Antora’s Thermal Battery Targets Industrial Energy Demand

Antora Energy is a U.S. energy storage company focused on thermal batteries that store electricity as heat and later deliver it as heat or power.

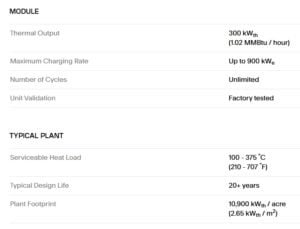
Instead of relying on conventional lithium-ion battery chemistry, Antora stores energy in insulated blocks of solid carbon. The system can absorb low-cost electricity when it is available and release energy when industrial customers need it.

This approach allows the company to target industrial facilities that require continuous heat and power.

Antora says its technology does not rely on supply-constrained critical minerals. It also uses factory-built modules, which could help reduce construction timelines compared with some large energy infrastructure projects.

“Antora’s thermal energy storage is the new standard for powering always-on operations with low-cost energy”

antora
Source: Antora

Expanding Its U.S. Energy Storage Footprint

The Kansas project follows Antora’s recent expansion in the U.S. energy storage market. Earlier this year, the company commissioned a 5 GWh thermal energy storage system in Big Stone City, South Dakota.

The company also expects the project to create and support more than 100 construction and operations jobs.

David Bierman, co-founder and Chief Commercial Officer of Antora, said:

“American industry runs on affordable, reliable energy. Our partnership with Pratt Energy delivers it, helping meet Kansas’s rising energy demand without increasing power bills for homes or businesses. This biorefinery project is creating jobs and spurring local investment without straining the resources the community depends on.”

Pratt Energy Could Move Toward Lower-Carbon Ethanol

Pratt Energy operates an ethanol biorefinery that processes locally grown corn and sorghum into transportation fuel and co-products used in biodiesel and animal feed.

The company has operated in Pratt since 2013 and works with farmers across the region.

The new thermal storage system could help the facility improve energy efficiency while lowering the carbon intensity of its products.

Antora said the project could help Pratt Energy move toward producing ethanol with a 100% zero-carbon-intensity profile. Lower-carbon ethanol could also open additional markets for Kansas agricultural products as fuel buyers place greater emphasis on emissions.

Additionally, the project is expected to use little additional water beyond Pratt Energy’s existing operations. It is also designed to operate without increasing noise levels for nearby properties.

For the ethanol industry, access to lower-carbon energy can become increasingly important as producers seek to reduce emissions across their operations and improve the environmental profile of their fuels.

The long-term heat offtake agreement also gives Antora a committed industrial customer for the project, creating a direct link between energy storage and industrial demand.

Investors Back Large-Scale Thermal Energy Storage

Copenhagen Infrastructure Partners is one of the investors backing the Kansas project.

CIP is a global energy infrastructure investment firm that invests across areas including renewable power, energy storage, transmission, low-carbon fuels, advanced bioenergy and carbon capture.

The firm has raised about $49 billion to date and manages 15 funds, according to the company.

CIP’s involvement highlights the growing interest from infrastructure investors in energy storage technologies that can serve industrial customers and provide longer-duration energy.

Grok Ventures is also participating in the financing. The Australian investment firm focuses on technology-driven solutions across major global challenges, including the energy transition.

UPP, a Canadian pension fund, is the third financial participant in the project.

The investment group gives Antora access to capital as it moves from individual demonstrations toward larger commercial deployments.

The US Battery Storage Market Capacity

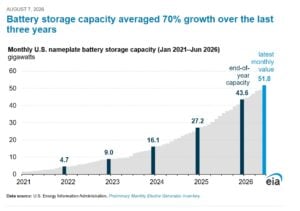
Utility-scale battery storage capacity reached nearly 52 gigawatts (GW) by June 2026, after operators added 8.3 GW during the first half of the year. The U.S. had 43.6 GW of operational utility-scale battery storage at the end of 2025, with capacity growing at an average annual rate of 70% over the past three years, according to EIA data.

The growth is expected to continue. U.S. developers plan to add about 24 GW of utility-scale battery storage in 2026, up from a record 15 GW added in 2025.

Battery storage accounts for about 28% of the 86 GW of new utility-scale generating capacity planned for the U.S. this year.

Battery storage USA
Source: EIA

Battery Storage Market Moves Beyond Short-Duration Systems

The Kansas project also highlights how the battery storage market is expanding beyond conventional short-duration electricity storage.

Most large battery projects deployed today use lithium-ion technology and typically provide power for a few hours. Thermal energy storage can address a different part of the market by storing energy for longer periods and delivering industrial heat directly.

  • That matters because many industrial facilities cannot simply replace fossil-fuel-based heat with electricity without changing how they operate.
  • Thermal batteries could provide another pathway by storing electricity during periods of lower prices and then supplying heat when needed.

The approach could become particularly useful as renewable energy expands and power markets experience larger differences between periods of high and low electricity prices.

Antora’s system is designed to provide both heat and power, allowing the same basic technology to serve industrial facilities or potentially support the wider grid.

The company says its thermal batteries can be deployed for industries including chemicals, food production and steel, as well as for grid applications.

The Bottom Line 

For Antora, the Kansas project represents another step toward commercial-scale deployment. For Pratt Energy, it could provide reliable energy while supporting efforts to lower the carbon intensity of ethanol production.

The project also shows how energy storage investments can extend beyond batteries and grid services. By connecting storage directly with industrial heat demand, companies can use new energy technologies to improve operations, reduce emissions, and strengthen the economics of low-carbon products.

As more U.S. industries look for reliable energy and lower-carbon production, projects like Pratt could help expand the role of thermal batteries in the country’s energy transition.

The post CIP, Grok Ventures Back U.S.-Based Antora Energy’s Massive Thermal Battery Project in Kansas appeared first on Carbon Credits.

Cowboy Clean Fuels Sells First Durable Carbon Removal Credits in Salesforce-Backed Purchase

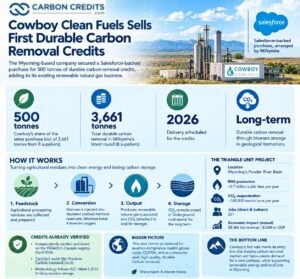
Cowboy Clean Fuels has sold its first durable carbon removal credits through a Salesforce-backed purchase arranged by Milkywire, with delivery scheduled for 2026. The Wyoming-based company said the transaction marks its entry into the durable carbon removal market. It adds carbon removal sales to its existing business producing renewable natural gas (RNG).

Cowboy is one of eight carbon removal suppliers included in Milkywire’s latest Salesforce-backed purchasing round. The group covers 3,661 tonnes of durable carbon removal across direct air capture, ocean alkalinity, biomass storage and related approaches.

Cowboy accounts for 500 tonnes of that total. The volume is small compared with the scale of global emissions. But the transaction is important for a different reason. Cowboy’s project is already operating, and the purchase helps create demand for a relatively new carbon removal pathway.

Ryan Waddington, Chief Executive Officer, Cowboy Clean Fuels, said:

“Durable carbon removal needs pathways that can be verified today and expanded tomorrow, and Wyoming’s subsurface gives us both. Buyers working with us get permanent removal alongside carbon-neutral renewable gas from the same operations, a combination very few suppliers can offer. This is an important step for Cowboy Clean Fuels and for the rural communities in Campbell County, Wyoming, that make the work possible.”

Cowboy Turns Farm Residues Into Carbon Removal

Cowboy’s process combines biomass carbon removal and storage (BiCRS) with renewable natural gas production. The company takes agricultural processing residues and injects them into depleted coalbed methane reservoirs in Wyoming’s Powder River Basin. Microorganisms inside the coal seams break down the biomass without oxygen.

That process produces methane and carbon dioxide.

Cowboy captures the methane as renewable natural gas, while the CO2 becomes attached to the coal and remains stored underground. The company calls this its BiCRS+RNG process.

The model differs from traditional bioenergy with carbon capture and storage (BECCS). In BECCS, biomass is burned for energy, and the CO2 produced is captured.

Cowboy instead relies on natural microbial activity underground. The company uses existing coalbed methane wells and infrastructure. This cuts down on the need for new infrastructure.

The Triangle Unit Is Already Operating

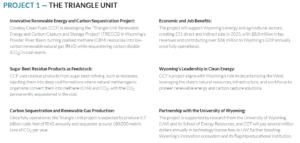
The carbon removal credits come from Cowboy’s Triangle Unit project, located in Wyoming’s Powder River Basin. The project is already operating. Cowboy says the facility started commercial operations after getting approval from Wyoming authorities. It has been injecting biomass to convert it into methane and CO2.

When fully operational, the Triangle Unit will produce about 0.7 billion cubic feet of renewable natural gas each year. It will also sequester around 180,000 metric tons of CO2 annually, as stated by the company. The project is also designed around existing energy infrastructure.

That approach could help lower capital requirements compared with building an entirely new carbon removal facility. Cowboy says it can also extend the useful life of existing wells and infrastructure while creating new income for land and resource owners.

The company estimates the project will support 221 jobs directly and indirectly. It will generate $8.8 million in annual tax revenue. Also, it will add over $36 million to Wyoming’s GDP each year when fully operational. These are company estimates rather than measured economic results.

Cowboy's Triangle Unit project
Source: Cowboy

Carbon Removal Credits Were Already Verified

The Salesforce-backed purchase is not the first time Cowboy has brought its carbon removal credits to the market. In April 2026, the company announced that its credits were independently verified and listed on the Evident C-Capsule registry. This means they are now available for purchase. The projects were certified under the Absolute Carbon Standard (ACS).

Cowboy has said its methodology follows ISO 14064-2:2019 and is designed for long-duration geological storage.

Climate Vault Solutions picked the Triangle Unit project for its carbon removal portfolio. This decision followed a review by its Technology Experts Chamber. Climate Vault said the project was the first BiCRS project to pass its review and that Cowboy became part of its independently vetted supplier portfolio.

These steps are important because carbon removal buyers increasingly want evidence that projects can measure and account for their net climate benefit.

Cowboy has also faced questions because its process uses coal formations and creates methane. The company says no coal is burned in its process and that the methane is captured for use as renewable natural gas. The CEO said the company is tackling issues like permanence, methane, and lifecycle emissions. They focus on measurement and third-party review.

Salesforce Is Creating Early Demand for CDR

The purchase is part of Salesforce’s commitment to contract $100 million of durable carbon dioxide removal by 2030. Salesforce made the commitment in 2022 as a founding member of the First Movers Coalition. The company says the goal is to help create demand for carbon removal technologies before they reach full commercial scale.

Milkywire is helping Salesforce deploy part of that commitment through smaller purchases from early-stage suppliers.

In January 2026, Milkywire made over 12,500 tonnes of Salesforce-backed purchases. These came from 19 suppliers and involved six carbon removal methods across 15 countries. That programme was valued at about $5 million and focused on technologies that were not yet attracting enough buyers.

The latest round adds another 3,661 tonnes from eight suppliers. Cowboy’s 500-tonne purchase is therefore one piece of a broader portfolio.

Milkywire says it has now facilitated more than $12 million of durable CDR purchases across 45-plus projects in more than 20 countries. The approach is important for newer technologies because early buyers can provide revenue before projects reach large commercial scale.

Durable CDR Is Growing, But Delivery Is Still Limited

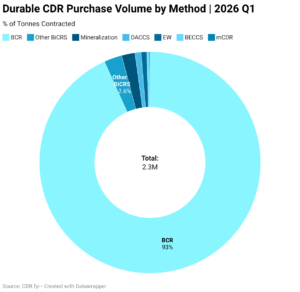
The Cowboy transaction comes as the durable carbon removal market grows rapidly. CDR.fyi reported that durable carbon removal purchases in Q1 2026 reached about 2.3 million tonnes, the largest first quarter on record.

durable-cdr-purchase-volume-by-method-2026-q1
Source: CDR.fyi

The total was 564% of Q1 2024’s volume. More than 113 buyers other than Microsoft contracted about 1.3 million tonnes during the quarter. But there is still a large difference between contracts and actual deliveries.

CDR.fyi said in June that durable CDR purchases outside Microsoft and Frontier had grown at a 151% compound annual rate from 2021 to 2025, while deliveries had grown at 131%. Biomass carbon removal and storage methods accounted for 96% of purchase volume and 91% of delivered volume in 2025.

This makes Cowboy’s sale notable. The company is not only signing a future purchase agreement. It is selling credits from an operating project with delivery in 2026. That moves the transaction closer to actual market performance rather than a long-term promise.

Could BiCRS Become CDR’s Next Growth Engine?

Biomass-based removal is receiving growing attention because it can combine carbon storage with energy production or waste management.

Cowboy’s model is one example. Other projects use biochar, BECCS, or underground biomass storage. The common idea is to take carbon absorbed by plants and keep it out of the atmosphere for a long period.

The challenge is proving the full climate benefit. Projects need to account for emissions from growing, collecting, and transporting biomass, as well as energy use and other parts of the supply chain. They must also show that the carbon remains stored for the required period.

Cowboy’s use of agricultural processing residues could help because the company is using an existing waste stream rather than growing dedicated energy crops. However, the sustainability and availability of feedstock will remain important as the company scales.

Cowboy is exploring more projects in the Powder River Basin. They are also contracting stronger carbon removal volumes and carbon-negative RNG supply.

Cowboy Clean Fuels carbon removal

The First Sale Tests a New Business Model

Cowboy’s first durable CDR sale is small in volume, but it links several parts of the emerging carbon market.

Salesforce’s approach also shows how large companies can help finance early CDR projects through smaller, targeted purchases. The bigger test is scale. Cowboy must demonstrate that it can grow while ensuring reliable carbon accounting, a sustainable biomass supply, and long-term storage.

The 500-tonne purchase does not prove that the technology can deliver hundreds of thousands of tonnes of removals. But it gives the company an important commercial milestone and provides a real-world test of its carbon removal pathway.

For the wider market, the development shows that durable carbon removal is slowly moving from early commitments toward actual deliveries. More buyers are entering the market. Projects that show measurable removals, clear accounting, and strong performance may secure bigger contracts.

The post Cowboy Clean Fuels Sells First Durable Carbon Removal Credits in Salesforce-Backed Purchase appeared first on Carbon Credits.
How Canada’s New ITMO Framework Could Unlock International Carbon Markets

Canada is exploring a new policy framework that could let Canadian companies participate in international carbon markets by trading internationally transferred mitigation outcomes (ITMOs).

The federal government announced the initiative on September 24, saying an ITMO framework could attract investment into Canadian climate projects, expand demand for carbon removal and nature-based solutions, and create new export opportunities for Canadian companies.

The move comes as international carbon markets develop under Article 6 of the Paris Agreement. At the same time, countries and companies are looking for ways to finance emissions reductions and carbon removals as they work toward net-zero targets.
For Canada, the opportunity is particularly significant because the country combines large natural resources, geological storage capacity, clean electricity and established expertise in energy and industrial infrastructure.

Canada’s Emissions Create a Large Decarbonization Challenge

Canada still has a substantial emissions-reduction challenge.

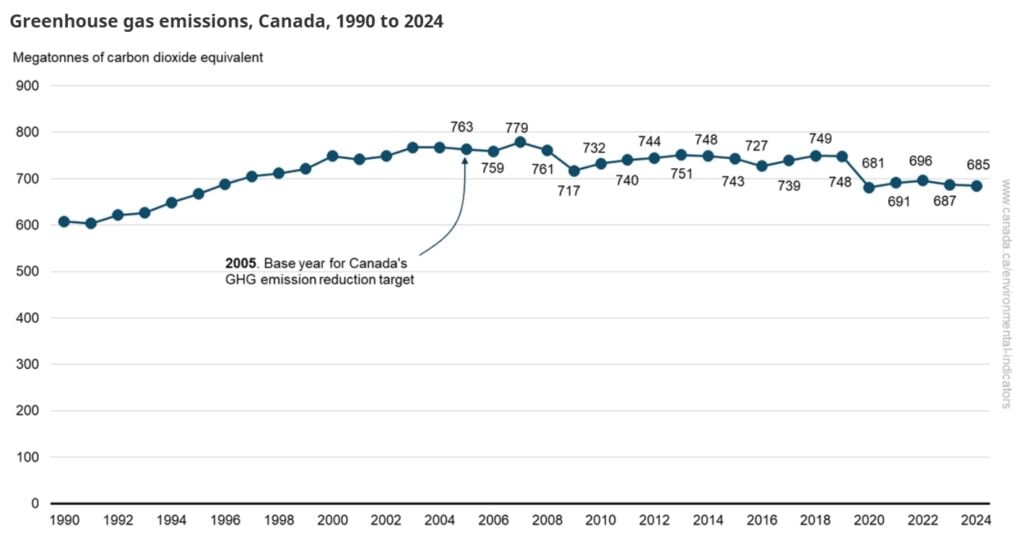
The country emitted about 685 million metric tons (Mt) of greenhouse gases in 2024, excluding emissions and removals from the land-use, land-use change and forestry sector. That was down 0.3% from 2023 and 10.3% below 2005 levels.

Oil and gas remained Canada’s largest source of emissions. The sector accounted for 208 Mt in 2024, although emissions have declined from their 2014 peak. Electricity emissions have fallen much more sharply, dropping 57% between 2005 and 2024 as Canada reduced coal-fired generation.

  • Canada’s government projects that emissions could fall to 600 Mt by 2030 under its “With Measures” scenario. Under a more ambitious “With Additional Measures” scenario, emissions could reach 546 Mt by 2030.

These figures show why Canada will need a combination of emissions reductions, carbon removal and other climate solutions to reach net zero.

An international market could provide another source of capital for some of those activities.

Canada emission

What Are ITMOs and Why Do They Matter?

ITMOs are internationally transferred mitigation outcomes created under Article 6.2 of the Paris Agreement.

In simple terms, one country can authorize the transfer of an emissions reduction or removal to another country under a cooperative approach. The receiving country can then use the mitigation outcome toward its climate target, subject to the applicable Article 6 accounting rules.

The system is designed to prevent the same emissions reduction from being counted toward the climate targets of both countries. This process, known as a corresponding adjustment, is central to maintaining the environmental integrity of international transfers.

Canada’s proposed framework would establish how these transfers could operate in the Canadian context.

The government said it will work with provinces and territories, Indigenous organizations and other stakeholders while developing the potential framework. It also said any ITMO trading would have to follow Article 6 rules, including requirements related to additionality, verification, permanence and avoiding double counting.

International Carbon Markets Are Expanding

Canada is considering the framework as carbon pricing and carbon-credit systems expand globally.

The World Bank’s 2026 State and Trends of Carbon Pricing report found that 87 carbon-pricing policies were operating worldwide, seven more than the previous year. Direct carbon pricing now covers nearly 30% of global greenhouse gas emissions, while carbon pricing generated more than $107 billion in public revenue in 2025.

The broader carbon-credit market is also attracting investment. The World Bank estimates that annual capital committed to future carbon-credit projects ranged from $12 billion to $16 billion in 2025.

The estimated annual value of traded carbon credits was about $535 million in 2024, although this figure covers a narrower segment of the overall carbon market than carbon taxes and emissions trading systems.

canada emission carbon market

The growth opportunity extends beyond today’s market.

The World Bank’s international carbon-market research has highlighted the potential for carbon markets to mobilize climate finance, particularly where domestic public funding cannot cover the investment needed for emissions reductions and removals.

Other market research has projected that voluntary carbon-credit demand could grow several-fold by 2030, while the World Bank’s Emission Reduction Program has cited estimates of a $10 billion to $40 billion voluntary carbon market by 2030 under one industry scenario.

This expanding market could create opportunities for countries that can supply credible emissions reductions and carbon removals.

Canada Sees Carbon Removal as an Economic Opportunity

Carbon removal is one area where Canada could potentially benefit from international demand.

  • Carbon Removal Canada has estimated that a large-scale domestic carbon removal industry could generate significant economic activity by 2050.
  • Its earlier modelling suggested that a Canadian industry capable of removing more than 300 Mt of CO₂ annually could create more than 330,000 jobs and add about $143 billion to GDP.
  • More recent modelling from the organization estimates that carbon removal could add $78 billion to Canada’s annual GDP by 2050 and create or support about 300,000 jobs.
canada carbon removal
Source: Carbon Removal Canada

Canada has several resources that could support this expansion. These include geological formations suitable for CO₂ storage, clean electricity, agricultural and forestry resources, industrial infrastructure and a workforce with experience in engineering, energy and large-scale construction.

Carbon removal technologies such as direct air capture and bioenergy with carbon capture and storage could therefore become part of Canada’s emerging clean-technology export industry.

ITMOs Could Bring More Capital Into Canadian Projects

The proposed ITMO framework could give developers another potential route to monetize verified emissions reductions and removals.

For example, a Canadian project could generate an eligible mitigation outcome, receive the required authorization, and transfer it internationally under an Article 6.2 agreement. Revenue from that transfer could help support project development and potentially improve the economics of technologies that remain expensive at early stages.

Nature-based projects could also benefit if they meet the requirements.

However, international transfers require more than simply creating a carbon credit. Countries need systems to authorize activities, track units, report transactions, and apply corresponding adjustments. These requirements are intended to ensure that a transferred mitigation outcome is not counted twice.

That accounting framework could also provide greater certainty for investors and buyers.

canada itmo

Canada Wants to Turn Climate Technology Into an Export Opportunity

The Honourable Julie Dabrusin, Minister of the Environment, Climate Change and Nature, said international ITMO trading could help Canadian companies attract capital and expand climate technologies.

She quoted:

“The trading of ITMOs under the Paris Agreement can unlock greater global climate action by making it easier to transfer emission reductions and removals between countries. This is about turning our natural advantages and homegrown climate innovation into investment, good jobs, and new export opportunities. A clear framework for international carbon credit transfers can help Canadian companies scale, attract capital, and bring more innovative technologies to market, strengthening our position as a leader in the global clean economy.”

$13 Billion in International Climate Finance

The government is also linking the initiative to more than $13 billion in international climate finance announced through the Spring Economic Update.

For Canada’s carbon market, the proposed framework could therefore represent more than a new trading mechanism. It could connect Canadian climate projects and technologies with international sources of demand and finance.

The framework is still under development, and its final rules will determine which projects and mitigation outcomes can participate. Canada will need to balance market access with rigorous accounting and environmental safeguards as it develops the system.

If implemented, the framework could give Canadian carbon removal developers, technology companies, and nature-based projects another potential pathway into the growing international market for emissions reductions and removals.

The post How Canada’s New ITMO Framework Could Unlock International Carbon Markets appeared first on Carbon Credits.